2029
Generalized anisotropy profiles distinguish cortical and subcortical structures in ex vivo diffusion MRI1Athinoula A. Martinos Center for Biomedical Imaging, Massachusetts General Hospital and Harvard Medical School, Charlestown, MA, United States
Synopsis
We propose an approach to extracting a generalized anisotropy profile from the ensemble average propagator, which can be obtained either from diffusion spectrum imaging (DSI) data or from a generalized DSI analysis of diffusion MRI data acquired on q-shells. We validate this approach on data from ex vivo human tissue, acquired at 9.4T with 0.25 mm spatial resolution. We show that the proposed anisotropy profile can be used to distinguish between various white- and gray-matter structures, revealing fundamental differences in their microstructure.
Introduction
Anisotropy maps derived from diffusion MRI (dMRI) contain contrast that allows us to delineate borders of subcortical structures that are not easily discernible in conventional T1- or T2-weighted images, and can be used jointly with such images to improve structural segmentation1. Fractional anisotropy (FA) maps from diffusion tensor imaging (DTI)2 or generalized FA (GFA) maps from high-angular resolution diffusion imaging (HARDI)3 capture only a fraction of the information on anisotropic structures that is contained in the diffusion signal. The ensemble average propagator (EAP), i.e., the probability distribution of water molecule displacements, offers a fuller description of diffusion processes in a voxel. Until recently, it was only possible to obtain the EAP from a demanding, diffusion spectrum imaging (DSI) acquisition. The introduction of generalized DSI (GDSI) allowed the EAP to be obtained from less demanding, q-shell acquisitions, thus making EAP-based analyses more practical4. Here we propose an approach to extracting anisotropy profiles from the EAP that can be used to distinguish different white-matter (WM) tracts and subcortical structures. We validate this approach using DSI data from ex vivo human tissue acquired at 0.25 mm spatial resolution on a 9.4T preclinical scanner.Methods
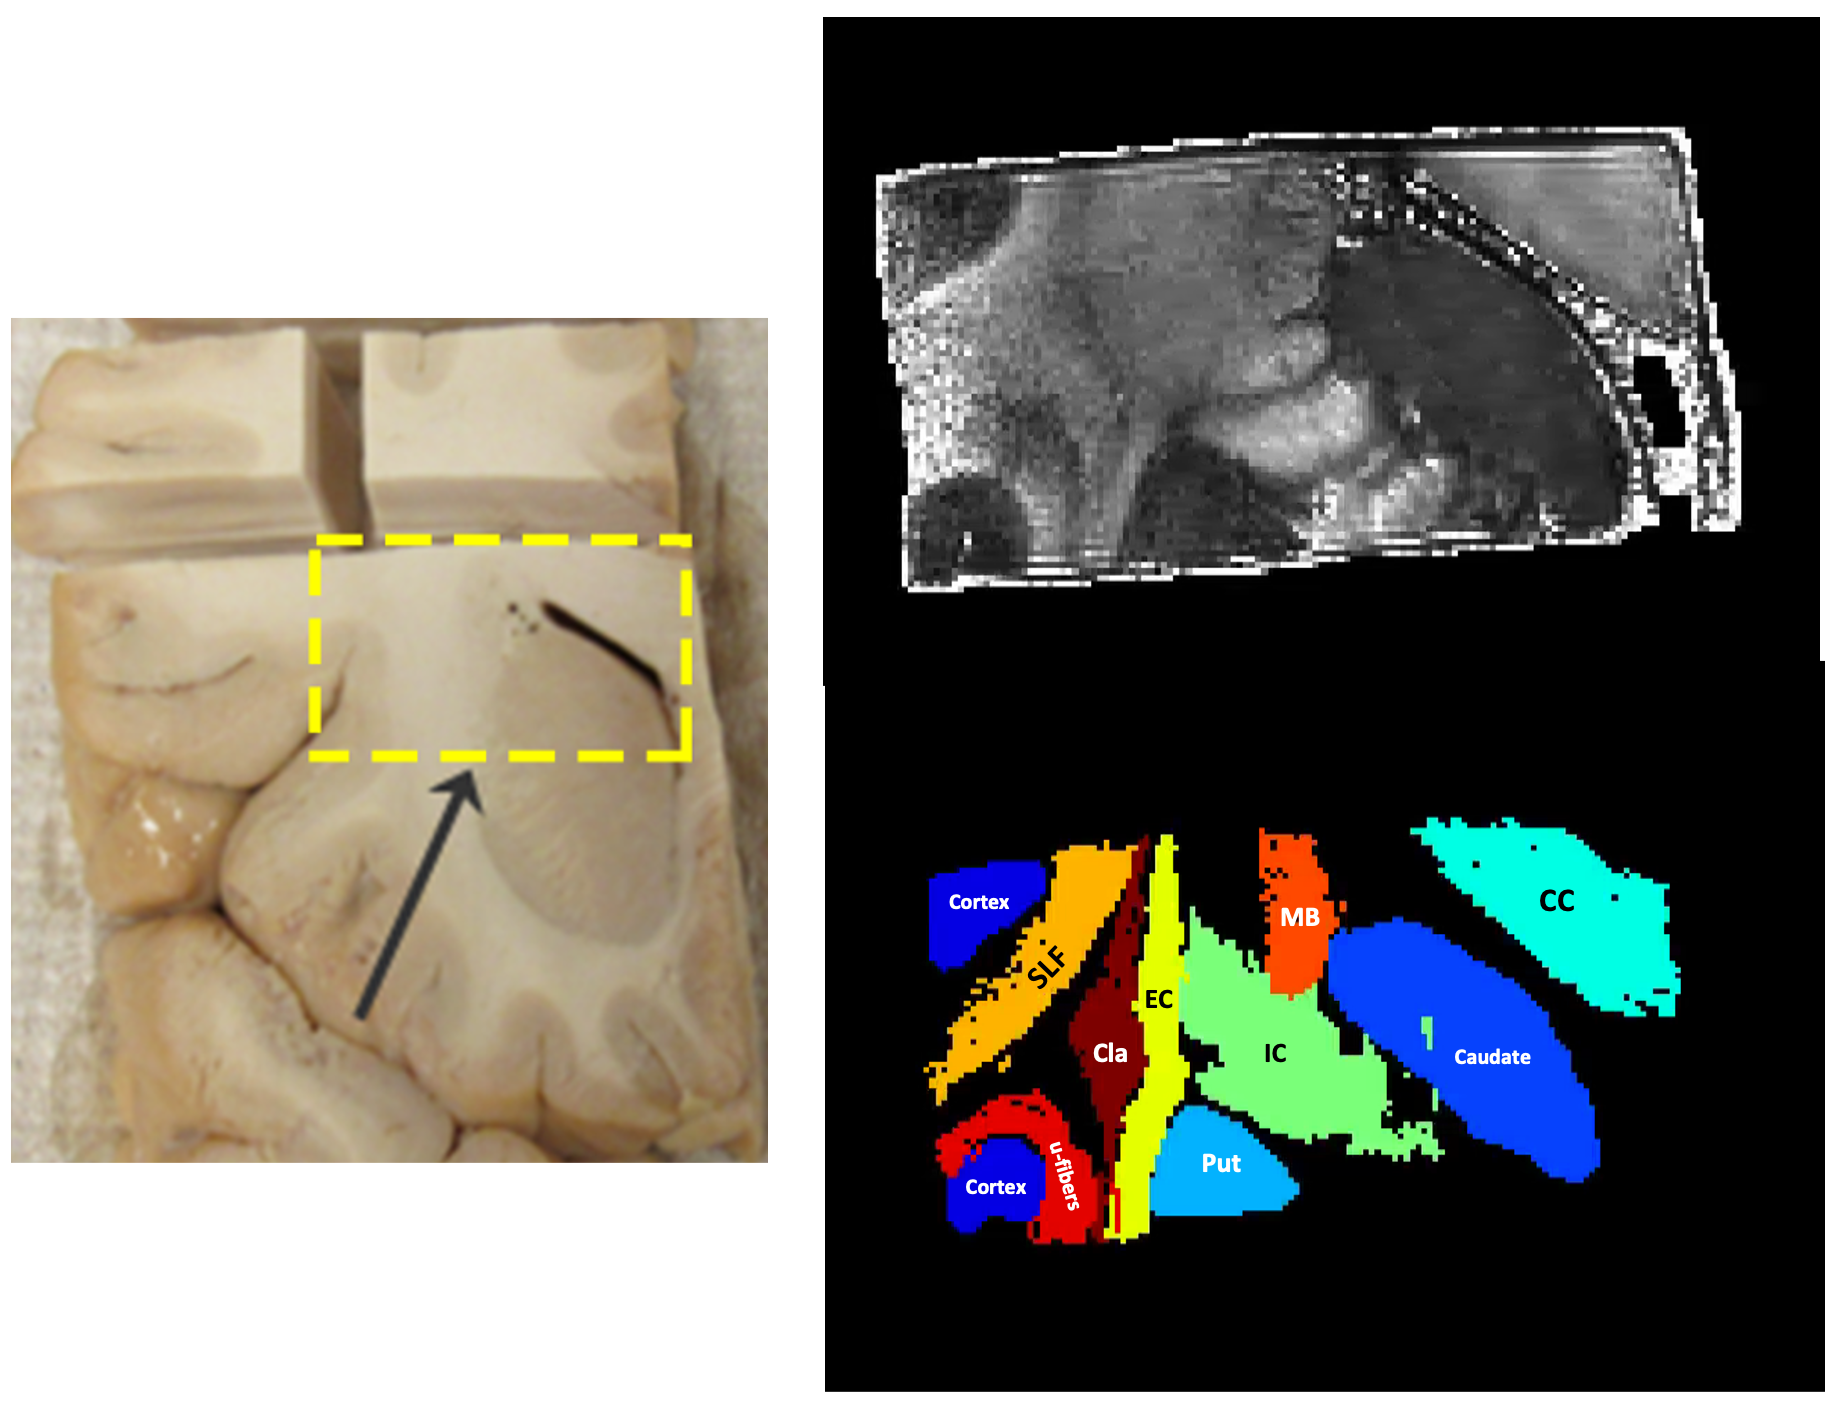
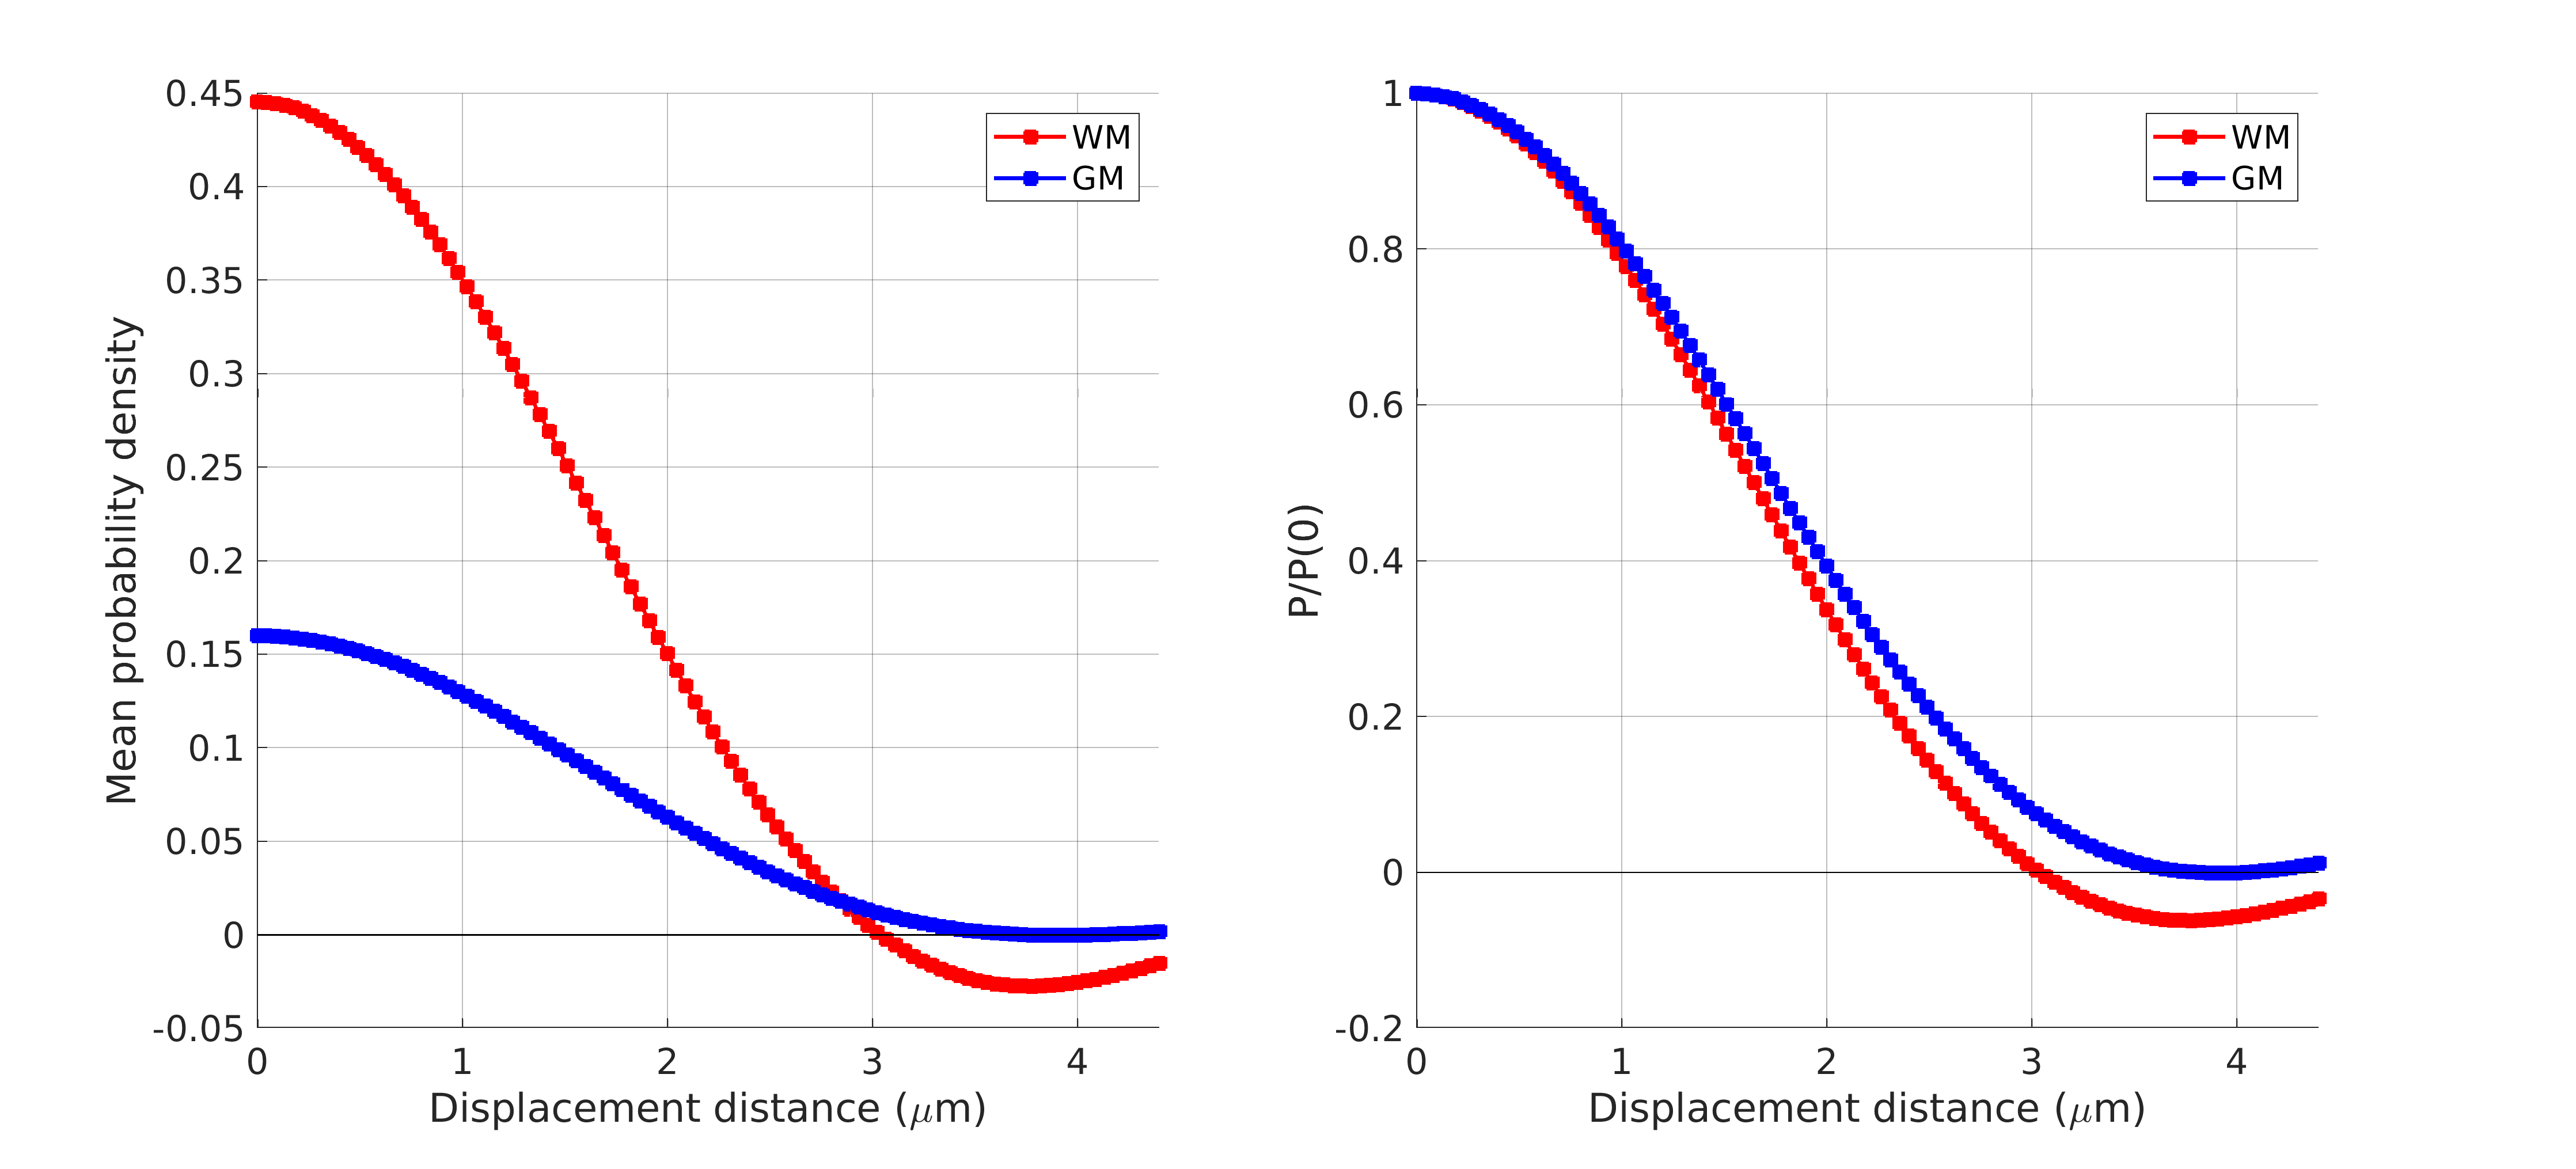
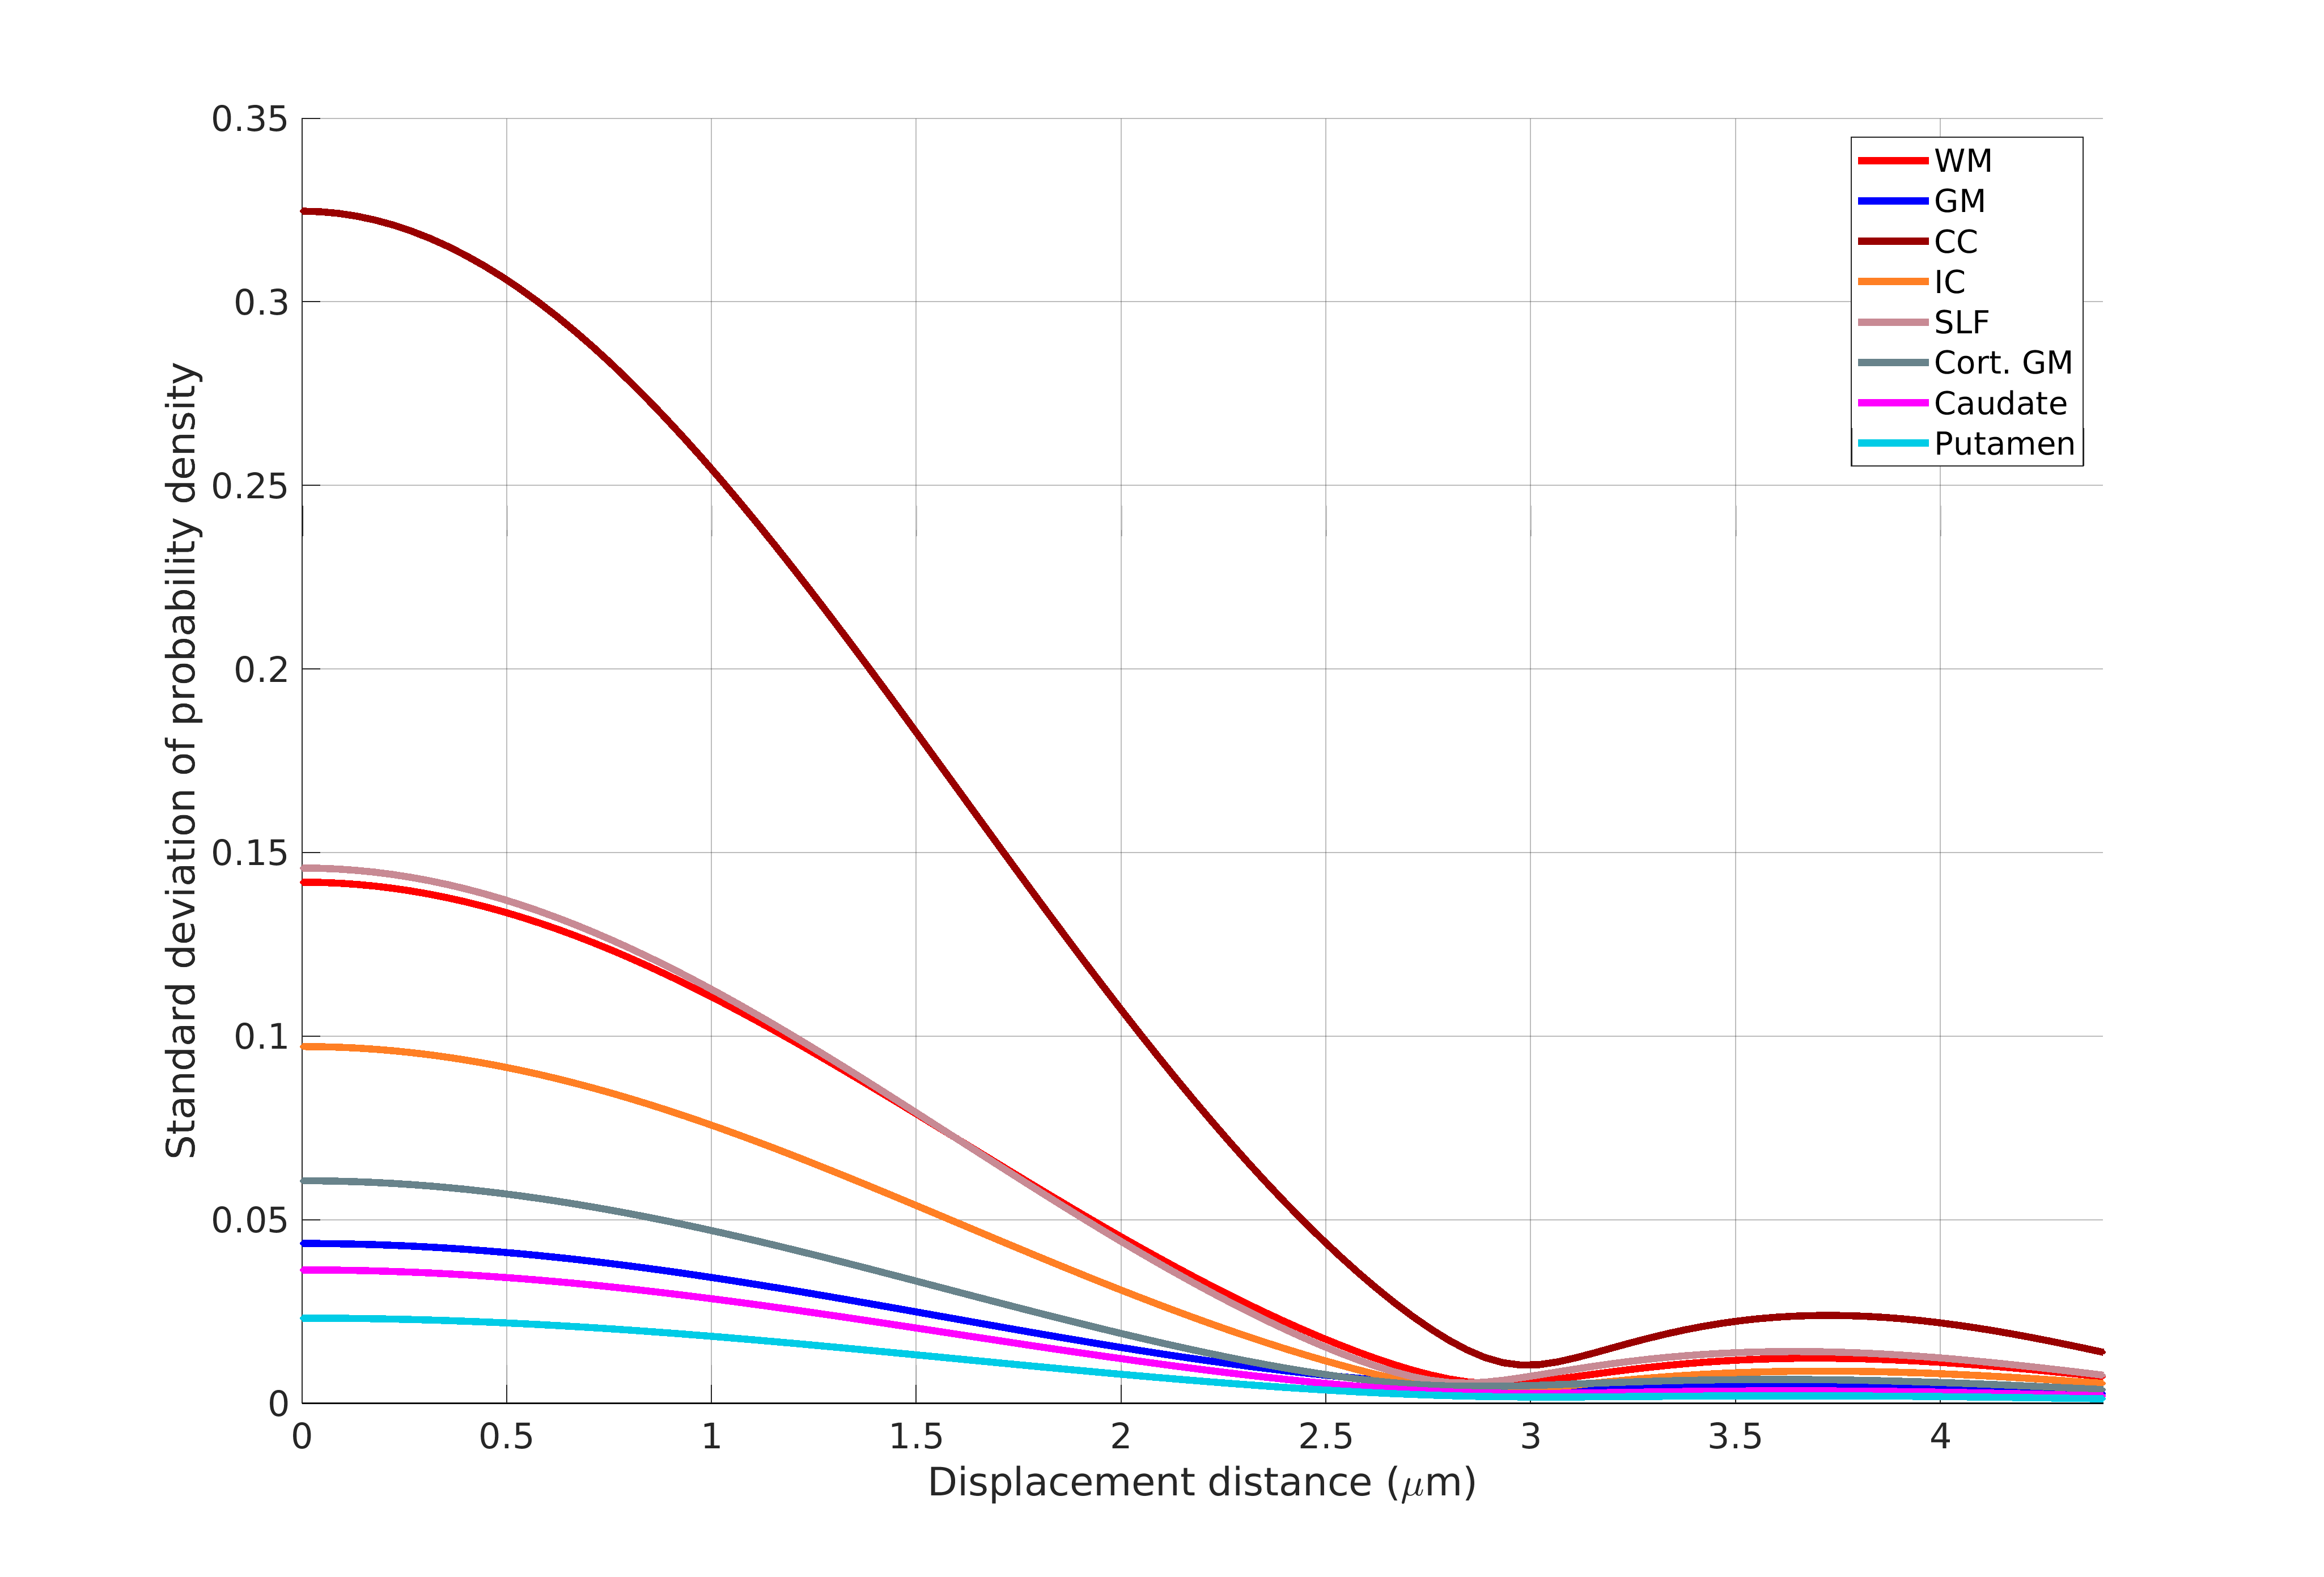
A block sized 3x2x2 cm was cut from a fixed, ex vivo, human hemisphere and imaged on a 9.4T Bruker Biospec system with gradients capable of |G|=480 mT/m. The dMRI data were acquired using spin echo 3D single-shot EPI (TE/TR=43/750 ms, GRAPPA factor 2, 250 μm isotropic resolution). We used a DSI sampling scheme consisting of one b=0 image and 514 gradient directions arranged on an 11x11x11 lattice in q-space. Diffusion encoding was applied with bmax=40000 s/mm2, ẟ=15 ms, and Δ=21 ms, corresponding to qmax=250 mm—1.Similarly to the GDSI framework4, we sampled the EAP on a sphere with 961 vertices. For each direction, the EAP was evaluated at 100 evenly spaced radii between 0 and the MDD of water (estimated in the corpus callosum). The displacement probability at each radius was averaged across all directions to obtain a 1D profile that represents the marginal probability distribution of radial displacements. In addition to the average, we also computed the standard deviation of displacement probabilities at each radius, yielding an additional 1D profile that quantifies diffusion anisotropy at different scales. We refer to this as a generalized anisotropy profile.
We created manually segmented masks of WM, as well as cortical and subcortical gray matter (GM). Guided by tractography streamlines seeded everywhere in the sample, we segmented various WM bundles, including the corpus callosum (CC), internal capsule (IC), external capsule (EC), superior longitudinal fasciculus II (SLF-II), and Muratoff bundle (MB). We also segmented two subcortical GM structures, the caudate nucleus and the putamen. We obtained the profiles described above for each of these segmentation labels.
Results
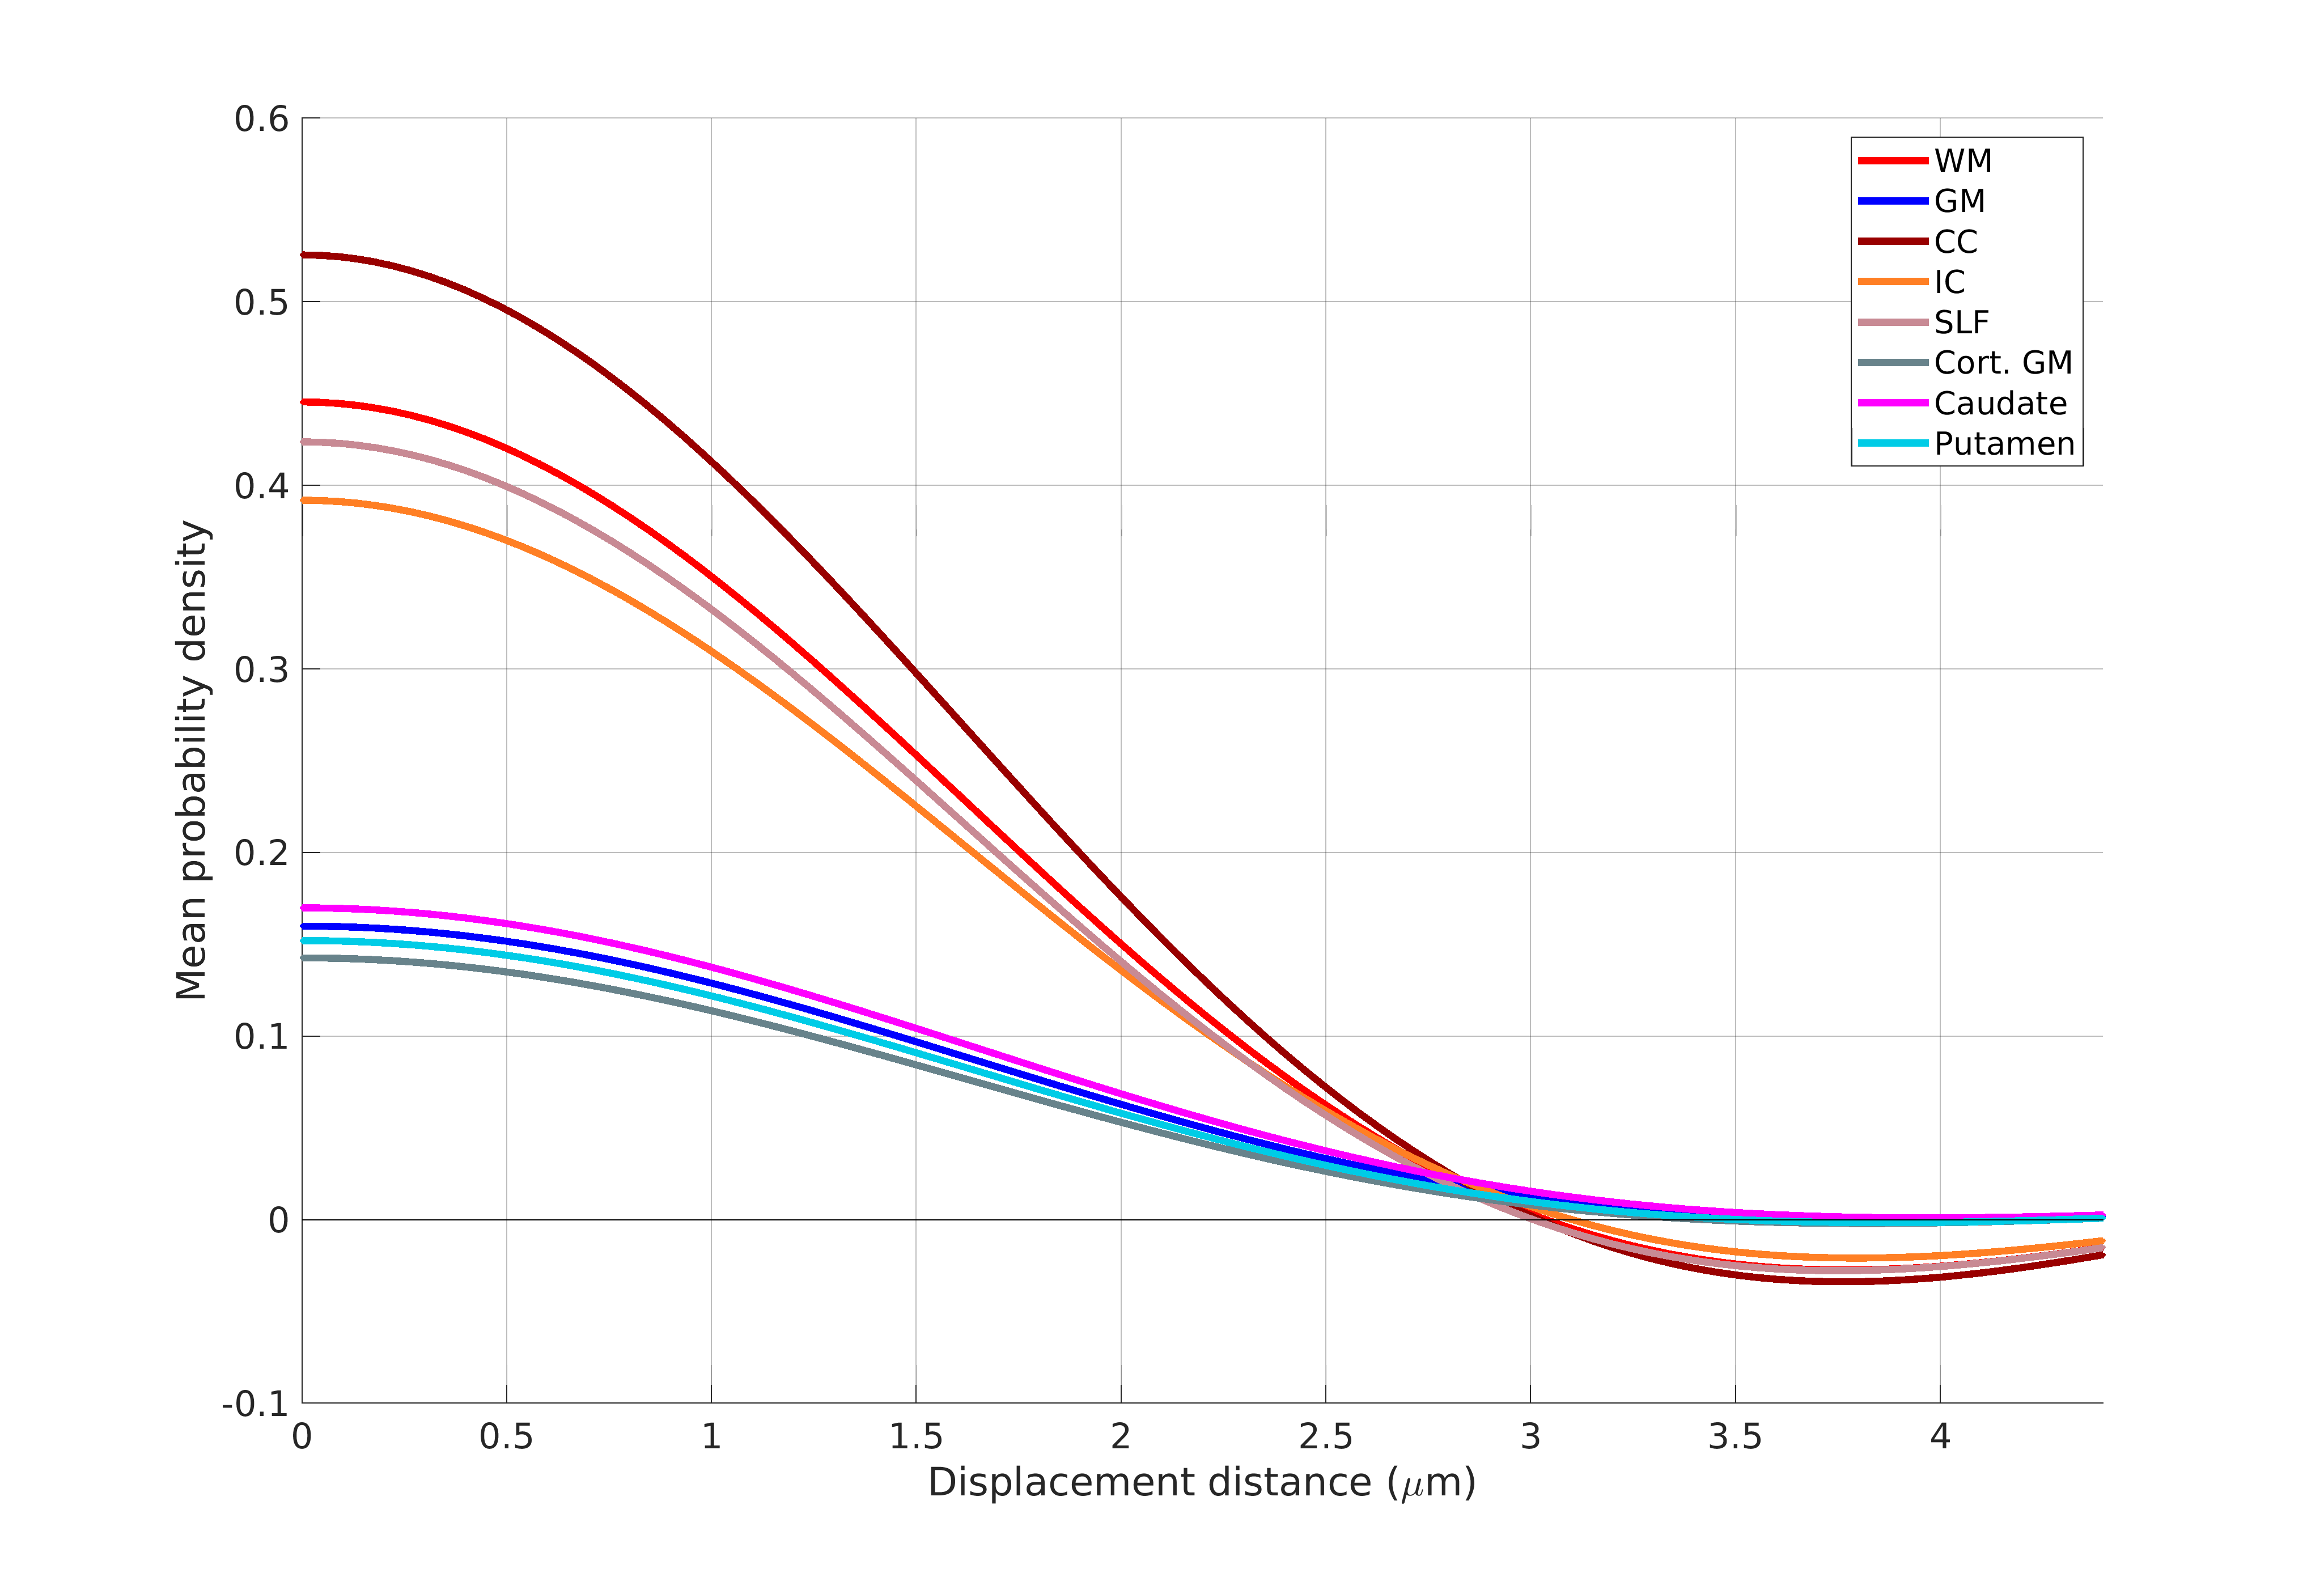
Figure 1 shows the sample and the segmented WM and GM structures. Figure 2 shows plots of the marginal probability distribution of water molecule displacements (average EAP at each radius). We show average probabilities across all voxels in the WM tracts (red) and the GM subcortical structures (blue). The plot on the left shows the probability densities. We see a narrower distribution with low probability of large displacements in the WM, due to higher restriction. The plot on the right shows the probability densities normalized by the zero displacement probability. Figure 3 shows plots of the marginal probability of displacements for each individual WM tract and GM structure. We see a clear differentiation of the CC from the IC and SLF, less differentiation between the IC and SLF, and little differentiation between the caudate, putamen, and cortical GM. Figure 4 shows the generalized anisotropy profile of each WM tract and GM structure. Here we see much clearer differentiation among WM and GM structures, suggesting that this profile is better at capturing differences in their microstructure.Discussion
The FA index derived from DTI quantifies the standard deviation of diffusivity among 3 axes, defined by the eigenvectors of the tensor. The GFA index derived from HARDI quantifies the standard deviation on the sphere on which the orientation distribution function (ODF) is defined. The generalized anisotropy profiles proposed here extend this concept to the full EAP. The ODF is obtained by marginalizing the EAP over the radial direction, which leads to a substantial loss of the information content in the EAP. Our results suggest that, by extracting an anisotropy profile that takes advantage of the full information contained in the EAP, we can differentiate several WM and GM structures.Conclusions
In this preliminary validation study, we show the potential for extracting measures of anisotropy from the EAP that is informative on the microstructure of different WM and GM structures. The generalized anisotropy profile that we propose here could be used as a multi-channel input to structural segmentation algorithms. It may be used jointly with T1- or T2-weighted scans, similarly to prior work that combined T1 with FA and principal eigenvectors from DTI to improve subcortical segmentation1. Importantly, this profile provides contrast between WM structures, which is unavailable to conventional structural scans. Therefore, it may serve as a valuable component in a framework for true whole-brain GM and WM segmentation.Acknowledgements
No acknowledgement found.References
1. J. E. Iglesias, K. Van Leemput, P. Golland, A. Yendiki, Joint inference on structural and diffusion MRI for sequence-adaptive Bayesian segmentation of thalamic nuclei with probabilistic atlases, Inf Process Med Imaging, Lecture Notes in Computer Science, 11492:767-779, 2019.
2. Basser PJ. Inferring microstructural features and the physiological state of tissues from diffusion-weighted images. NMR Biomed, 1995 Nov-Dec;8(7-8):333-44.
3. Tuch DS. Q-ball imaging. Magn Reson Med, 52(6):1358-72, Dec. 2004.
4. Tian, Qiyuan, et al. "Generalized diffusion spectrum magnetic resonance imaging (GDSI) for model-free reconstruction of the ensemble average propagator." Neuroimage 189 (2019): 497-515.
Figures