2028
Surface based analysis of cortical diffusion metrics: associations with cortical myeloarchitecture and underlying white matter anisotropy1School of Biomedical Engineering, The University of Sydney, Sydney, Australia, 2Sydney Imaging, The University of Sydney, Sydney, Australia
Synopsis
We employ structural and diffusion MRI metrics to evaluate their effectiveness for cortical segregation based on myelination, neurite density and microstructure in cortex. Three cortical measures (T1w/T2w, FA and total apparent fibre density, AFDtotal, demonstrated significant inter-correlations. Two track-weighted parameters (FOD and FA, measured in white matter adjacent to cortex), also showed significant correlations to cortical FA and AFDtotal. The spatial cortical patterns corresponding to these parameters suggest they provide complementary information on cortical features, and may help improve our understanding of cortical organisation in vivo and eventually lead to a further multi-parametric model for cortical parcellation.
Introduction
The complexity and heterogeneity of cerebral myeloarchitecture in vivo are ongoing topics of interest as well as ambiguity in neuroscience.1-3 Despite availability of various metrics, cortical MRI analysis has been primarily limited to structural scans (T1w, T2w). Consequently, cortical parcellation used for neuroimaging is primarily driven by the macro-scale structural information. T1w/T2w contrast has later been incorporated for myelin mapping and myeloarchitecture assessment.4-6 More recently, a diffusion MRI (dMRI) measure (AFDtotal, which measures apparent fibre density over all directions) was used to assess cortical neurite density 7, and demonstrated the potential of dMRI for cortical parcellation related to tissue microstructure properties. We evaluate several structural and dMRI parameters on their effectiveness for cortical segregation. We also check for the inter-correlations of these parameters to assess the overlapping/complementary nature of the information communicated by each.Methods
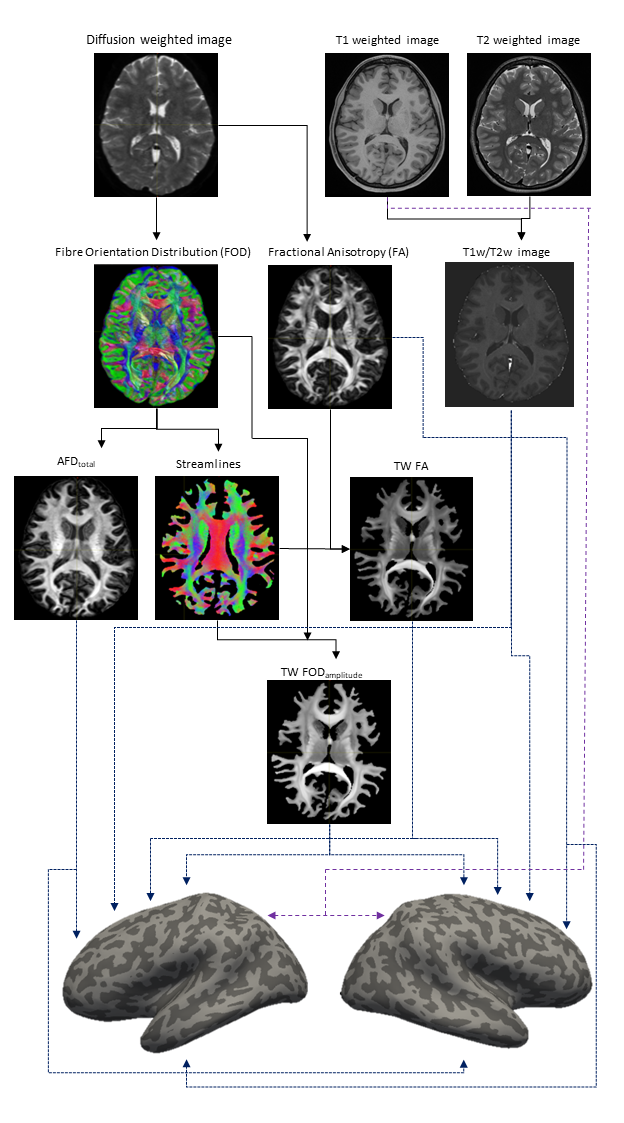
MRI data from ten healthy subjects were downloaded from the 100 unrelated group of the Human Connectome Project. 8,9. dMRI had 18 b0 and 90 diffusion directions each for b=1000,2000, and 3000 s/mm2 and 1.25mm isotropic resolution. T1-weighted and T2-weighted data had 0.7mm isotropic resolution. dMRI was analysed using MRtrix3 (http://www.mrtrix.org), 10 and bias-corrected 11 data was upsampled to 0.7mm resolution. FA maps were computed using tensor estimation while fibre orientation distributions (FODs) calculated using multi-shell multi-tissue (MSMT) constrained spherical deconvolution.12 The apparent fibre density (AFD) summed over all orientations (AFDtotal) was computed from the L=0 term of the FOD spherical-harmonic expansion.7 10M streamlines were generated using probabilistic tractography, 13-15 to compute Track-Weighted Imaging (TWI) maps 16,17 for contrasts FA (i.e. TW-FA) and FOD amplitude (i.e. TW-FOD), computing a local streamline-based smoothing (40mm full-width-half-maximum gaussian kernel) 16 and 0.5mm super-resolution.T1w/T2w volumes were computed as a measure of myelin. 4 Cortical reconstruction was done using FreeSurfer (http://surfer.nmr.mgh.harvard.edu). For three cortical metrics (T1w/T2w, FA and AFDtotal), the data were sampled across the cortex and averaged over 70% of the cortical thickness (excluding the 30% closer to the WM-GM interface, to minimise WM partial volume contamination), 7 and displayed projected along the mid-cortical surface (Figure 1). In contrast, for TWI metrics (representative of WM, as they are only computed where there are streamlines), values were sampled along the WM-GM interface (where streamlines terminated) 15 and again projected along the mid-cortical surface (Figure 1). (Note that due to streamline-based TWI smoothing and track-termination at WM-GM interface, the TWI surface data reflect WM properties). Each surface dataset was correlated against each other to evaluate associations.
Results
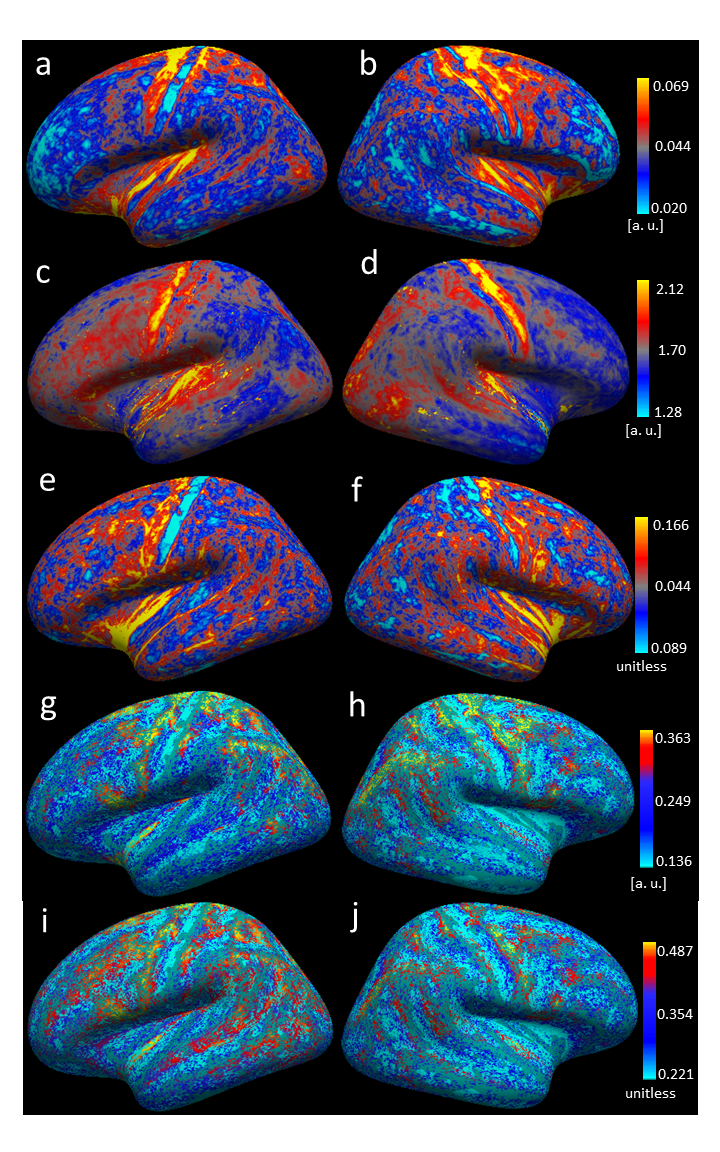
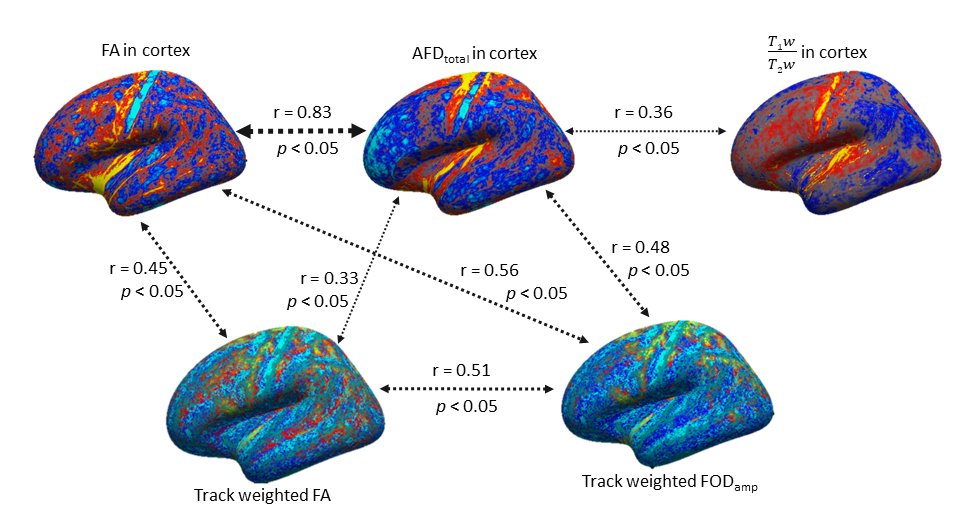
Figure 1 shows an overview of the processing pipeline; group-average surface maps are shown in Figure 2. Figure 3 shows pair-wise Pearson correlation coefficients among the three cortical MRI metrics (including metrics used for myeloarchitecture (T1w/T2w) 4 and neurite density (AFDtotal) 7 and two parameters that are sensitive to WM properties in near-cortical region. Consistent with previous findings, 7 we found AFDtotal significantly correlated to T1w/T2w (Figure 3) in cortex, although the association was not very strong. Cortical FA, despite its low anisotropy values, was also found to be significantly correlated to AFDtotal. The inter-correlations and spatial cortical patterns observed in Figure 2 demonstrated the sensitivity of dMRI to cortical organisation. Additionally, these parameters were also significantly correlated to TW-FOD and TW-FA at the WM-GM interface, both which reflect tissue properties (intra-axonal density and anisotropy, respectively) in the WM near cortical areas.Discussion
We showed that cortical T1w/T2w is correlated with neurite density measured by AFDtotal. Their spatial cortical patterns on Figure 2 show similarities to well-known patterns of myeloarchitecture. 4,5 Considerable variations were however also evident, consistent with the low, albeit significant correlation (r = 0.36, p < 0.05) between these parameters. This suggests that AFDtotal can facilitate segregation of cortical regions based on neurite/microstructure variability; however, it cannot be used to replicate the myelin sensitivity observed by T1w/T2w. The high correlation between cortical FA and AFDtotal reaffirmed diffusion MRI’s sensitivity to tissue microstructure organisation heterogeneity in cortex.Promising correlations were also observed between parameters measured from WM tracts adjacent to cortex (which are representative of water anisotropy and intra-axonal volume in those tracts) and cortical metrics. For example, TW-FOD and TW-FA were correlated to dMRI derived cortical measures, AFDtotal and cortical FA.
It should be stressed that, while measured also from dMRI, the dMRI cortical metrics measure different tissue properties than in WM (e.g., cortical AFDtotal reflects neurite density, while TW-FOD reflects tract intra-axonal volume). The cortical patterns observed with TWI maps highlight the spatial heterogeneity of WM in the proximity to the cortex. Some gaps in TW maps were observed, which may be attributed to the bias observed in tract termination between gyral crown and sulci banks, 18 highlighting a limitation of current tracking methods.
Overall, this study demonstrated the sensitivity of several dMRI parameters to identify spatial cortical patterns with reliable inter-correlation and complementary information. It also presents the probable pathway of combining these parameters, which may lead to a multi-parametric parcellation technique of cortical regions with improved sensitivity towards compositional information.
Acknowledgements
No acknowledgement found.References
1. Amunts, K. and K.J.N. Zilles, Architectonic mapping of the human brain beyond Brodmann. Neuron. 2015. 88(6): p. 1086-1107.
2. Palomero-Gallagher, N. and K.J.N. Zilles, Cortical layers: Cyto-, myelo-, receptor-and synaptic architecture in human cortical areas. NeuroImage. 2019. 197: p. 716-741.
3. Eickhoff, S., et al., High‐resolution MRI reflects myeloarchitecture and cytoarchitecture of human cerebral cortex. Human brain mapping. 2005. 24(3): p. 206-215.
4. Glasser, M.F. and D.C.J.J.o.N. Van Essen, Mapping human cortical areas in vivo based on myelin content as revealed by T1-and T2-weighted MRI. Journal of Neuroscience. 2011. 31(32): p. 11597-11616.
5. Van Essen, D.C., et al., Cerebral cortical folding, parcellation, and connectivity in humans, nonhuman primates, and mice. Proceedings of the National Academy of Sciences. 2019. 116(52): p. 26173-26180.
6. Ganzetti, M., N. Wenderoth, and D.J.F.i.h.n. Mantini, Whole brain myelin mapping using T1-and T2-weighted MR imaging data. Frontiers in Human Neuroscience. 2014. 8: p. 671.
7. Calamante, F., et al., The role of whole‐brain diffusion MRI as a tool for studying human in vivo cortical segregation based on a measure of neurite density. Magnetic Resonance in Medicine. 2018. 79(5): p. 2738-2744.
8. Sotiropoulos, S.N., et al., Advances in diffusion MRI acquisition and processing in the Human Connectome Project. Neuroimage. 2013. 80: p. 125-143.
9. Van Essen, D.C., et al., The WU-Minn human connectome project: an overview. Neuroimage. 2013. 80: p. 62-79.
10. Tournier, J.-D., et al., MRtrix3: A fast, flexible and open software framework for medical image processing and visualisation. NeuroImage. 2019. 202: p. 116137.
11. Tustison, N.J., et al., N4ITK: improved N3 bias correction. IEEE transactions on medical imaging. 2010. 29(6): p. 1310-1320.
12. Jeurissen, B., et al., Multi-tissue constrained spherical deconvolution for improved analysis of multi-shell diffusion MRI data. NeuroImage. 2014. 103: p. 411-426.
13. Tournier, J.D., et al., MRtrix: diffusion tractography in crossing fiber regions. International journal of imaging systems and technology. 2012. 22(1): p. 53-66.
14. Tournier, J.D., F. Calamante, and A. Connelly. Improved probabilistic streamlines tractography by 2nd order integration over fibre orientation distributions. in Proceedings of the international society for magnetic resonance in medicine. 2010. Ismrm.
15. Smith, R.E., et al., Anatomically-constrained tractography: improved diffusion MRI streamlines tractography through effective use of anatomical information. Neuroimage. 2012. 62(3): p. 1924-1938.
16. Calamante, F., et al., A generalised framework for super-resolution track-weighted imaging. Neuroimage. 2012. 59(3): p. 2494-2503.
17. Calamante, F., Track-weighted imaging methods: extracting information from a streamlines tractogram. Magnetic Resonance Materials in Physics, Biology and Medicine, 2017. 30(4): p. 317-335.
18. Schilling, K., et al., Confirmation of a gyral bias in diffusion MRI fiber tractography. Human Brain Mapping. 2018. 39(3): p. 1449-1466.
Figures