2027
Using Sub-Millimeter Isotropic DTI to Observe the Cortical Depth Dependence of Diffusion Anisotropy and Diffusivity in-vivo1Brain Imaging and Analysis Center, Duke University, Durham, NC, United States
Synopsis
The cerebral cortex is comprised of short column structures that span across the cortical layers between white matter and the pial surface. Subtle abnormalities in this microstructure, which may not be visible on anatomical scans, can have a large effect on brain function and development. In an effort to delineate such abnormalities, this study presents a technique to accurately and effectively observe the cortical depth dependence of diffusion anisotropy and diffusivity in-vivo using sub-millimeter isotropic resolution diffusion tensor imaging.
Purpose
It is well documented that the cerebral cortex is organized into vertical column structures that traverse the horizontal layers of gray matter (GM), and that this specific architecture plays an important role in brain function and development. While most larger deformities (e.g. tumors) can be recognized in anatomical images, the presence of more subtle abnormalities in cortical microstructures can also directly affect brain functions, often before the onset of symptoms. An ability to accurately describe these microstructures is therefore essential in providing early imaging biomarkers for neurological and neurodegenerative disorders. Multiple studies have shown through ultrahigh-resolution (<0.6mm) diffusion tensor imaging (DTI) that diffusion anisotropy and diffusivity exhibit a cortical depth dependence between the white matter (WM) boundary and the pial surface (PS). However, these studies used either incredibly long scans (5-11 days) on post-mortem specimens1, or only focused on a small region using thick slices2 to maintain a high signal-to-noise ratio (SNR). Achieving whole brain DTI in-vivo at ultrahigh isotropic resolutions remains a challenge due to technical limitations of acquisition techniques (i.e. low SNR, distortions, long scans durations) and physiological confounds (e.g. brain pulsation). This study aims to accurately and effectively characterize cortical microstructures by observing the cortical depth dependence of DTI metrics across the whole brain in-vivo through a technique that achieves sub-millimeter isotropic spatial-resolution DTI with high SNR, high spatial fidelity, and maintains a conventional scan duration.Methods
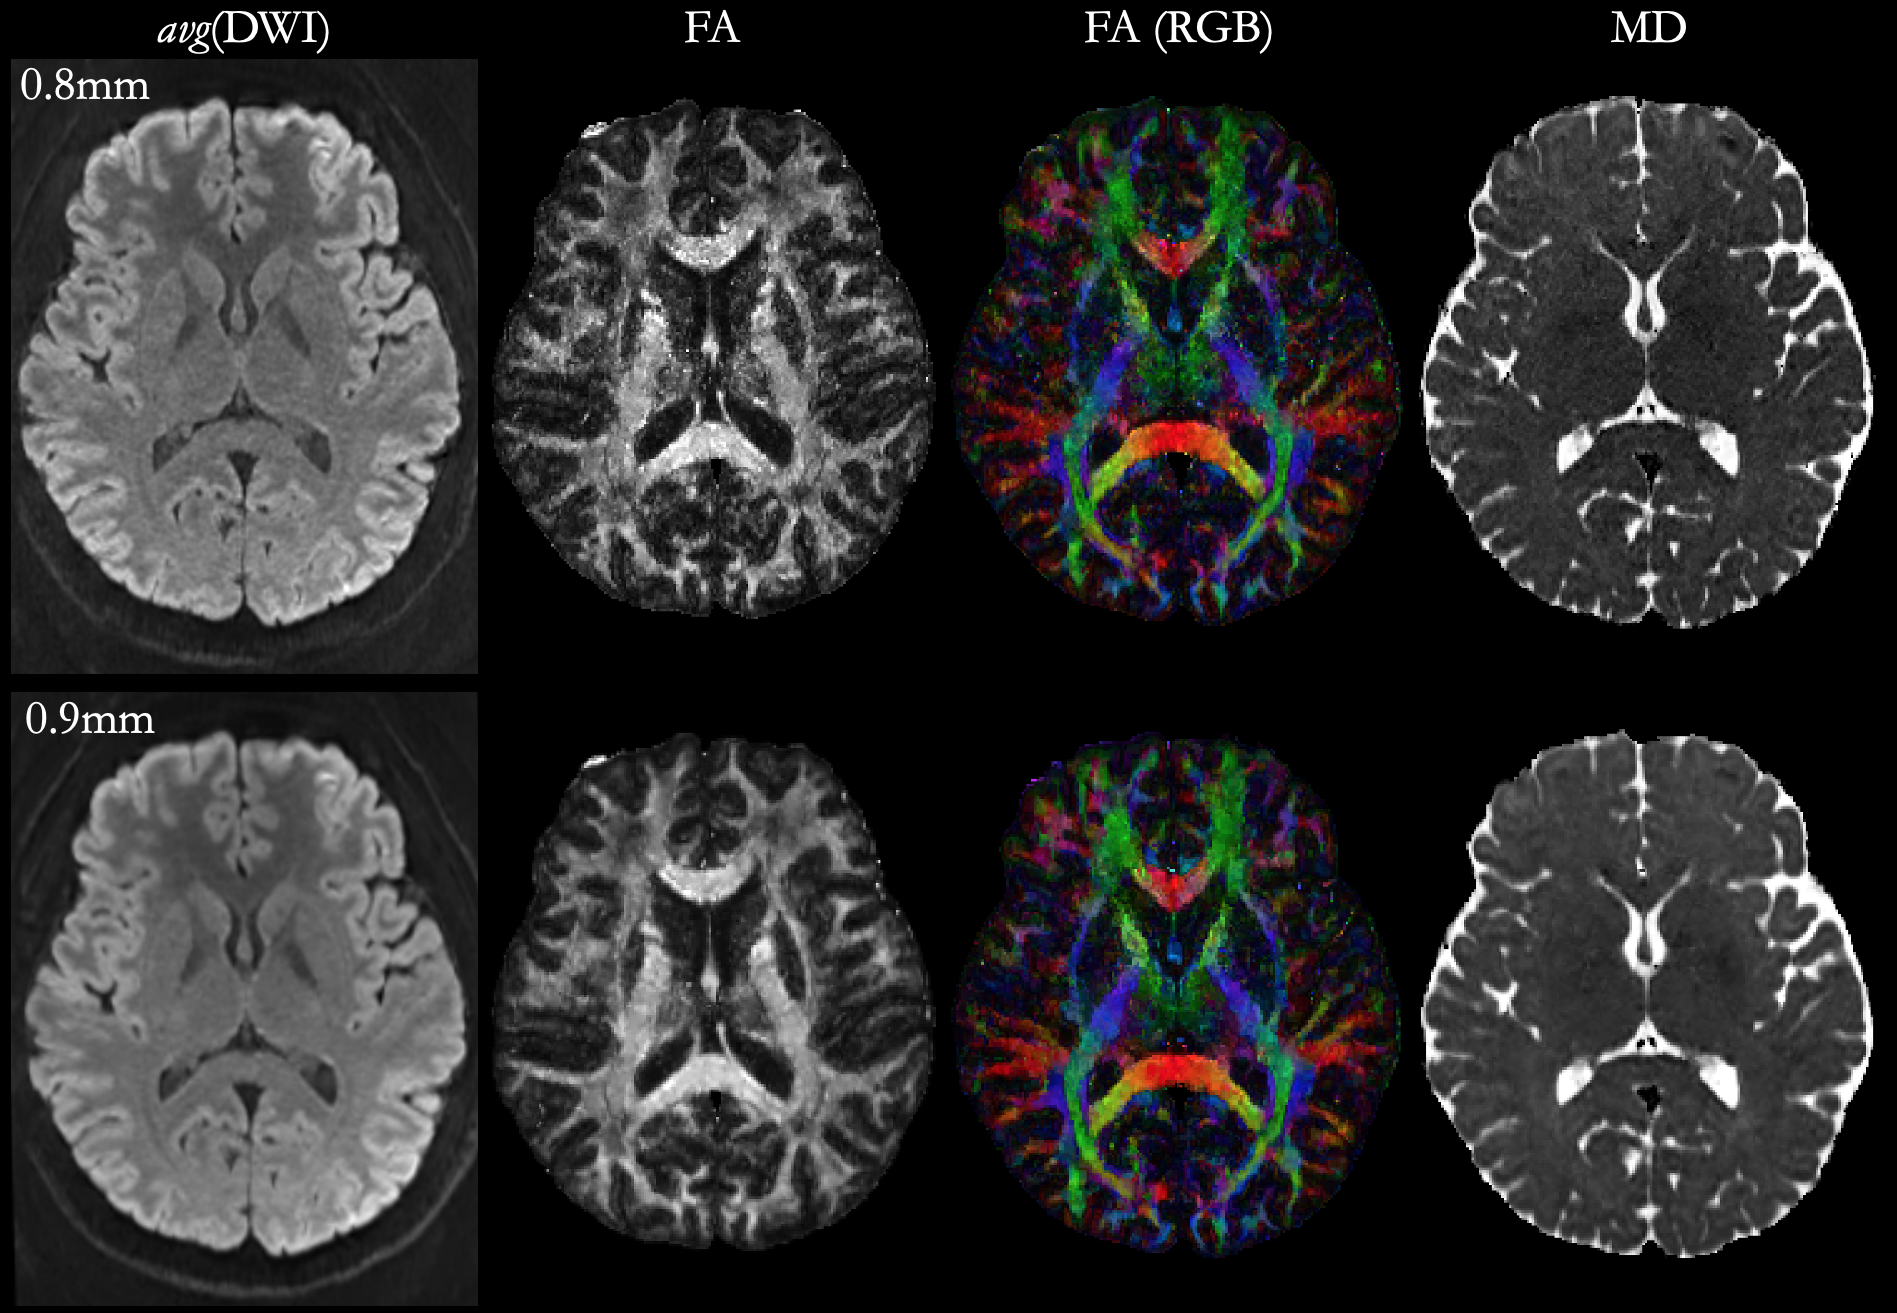
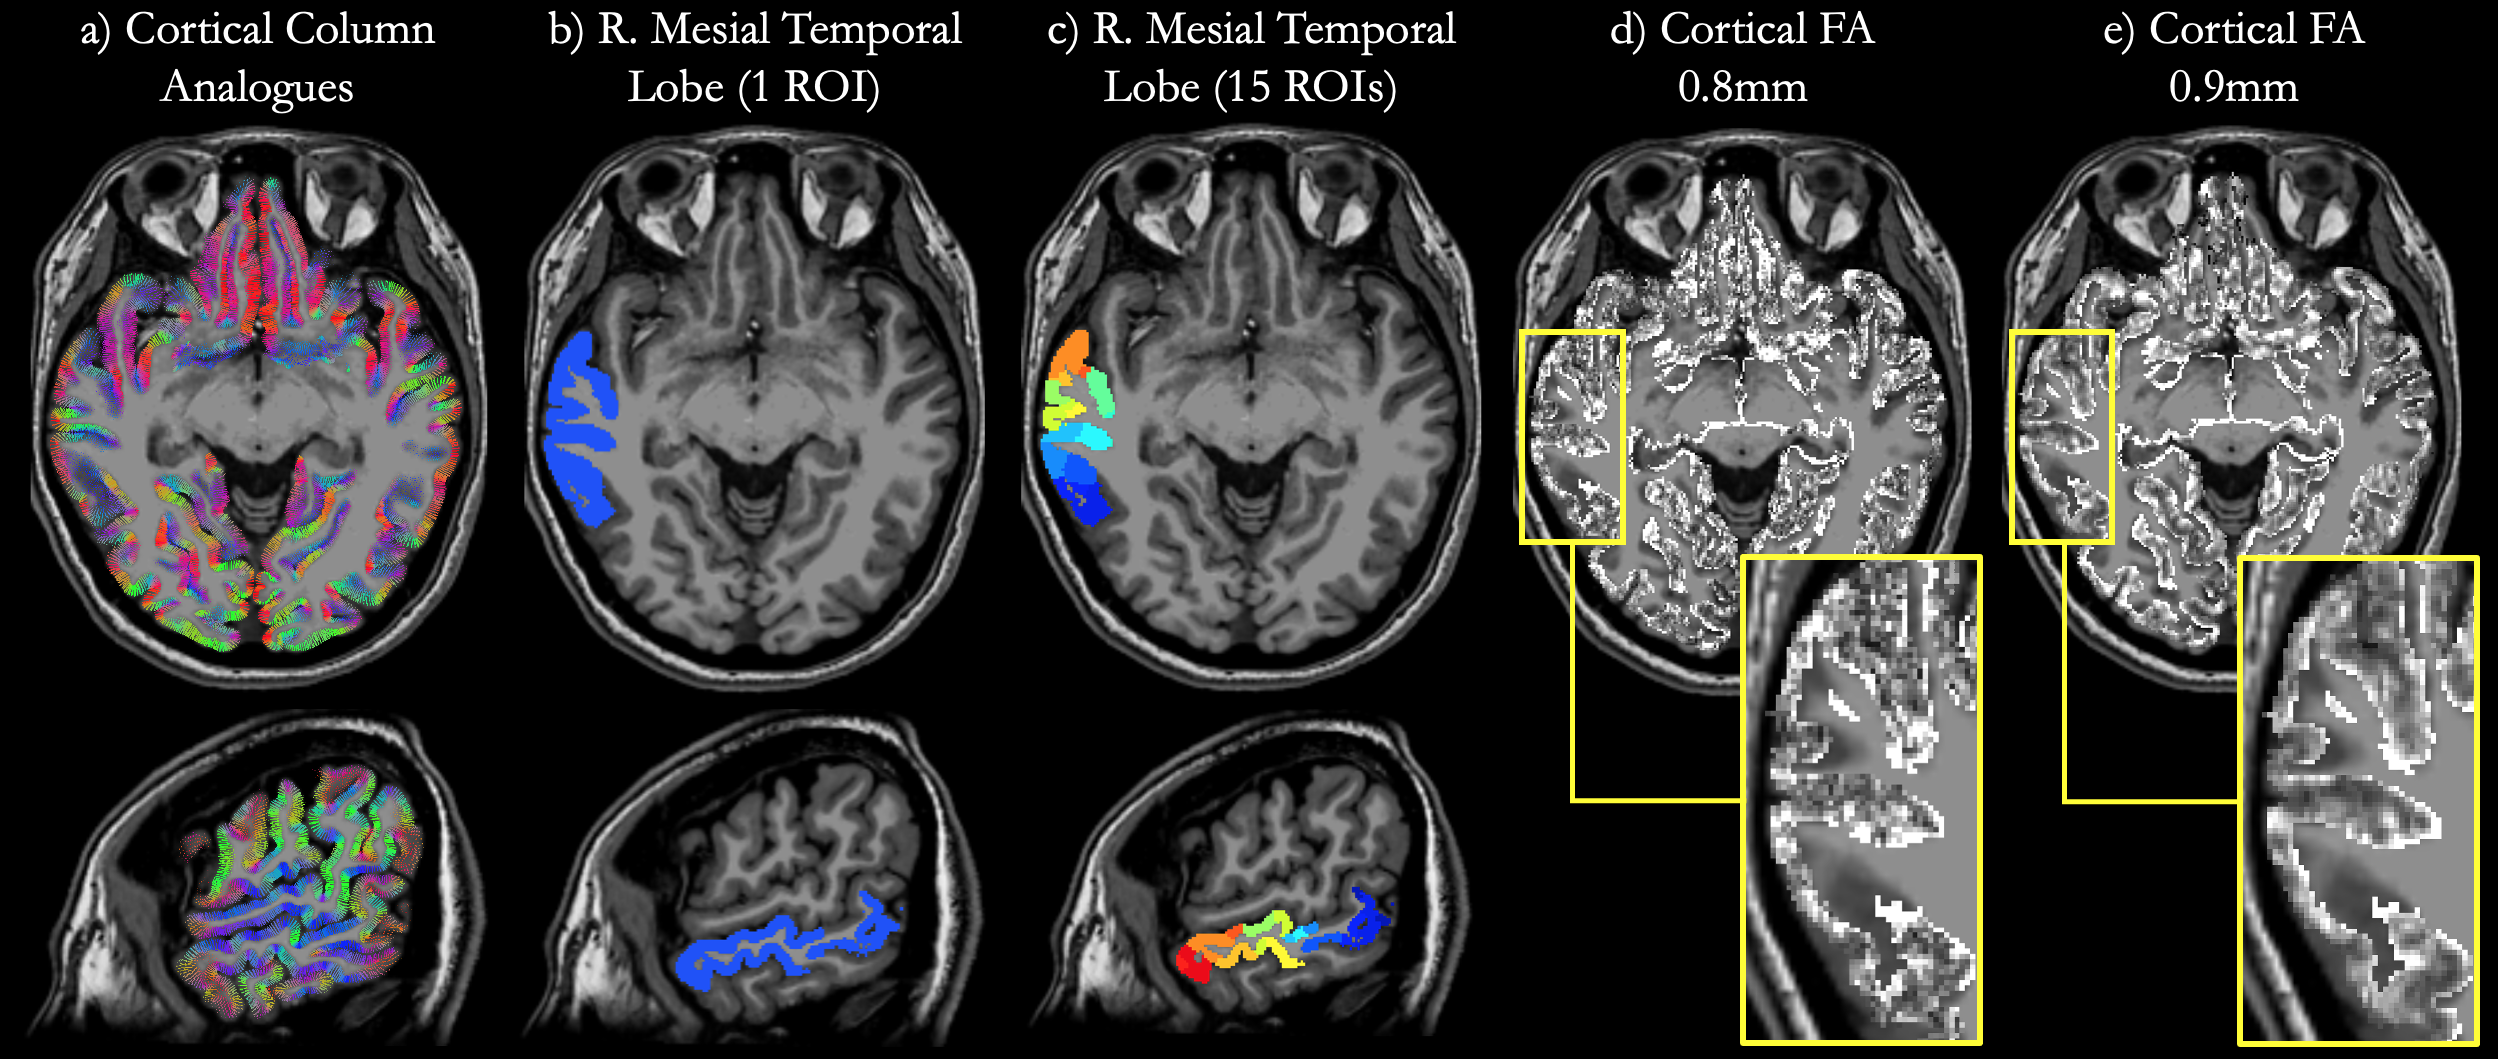
Whole brain DTI data was acquired from a healthy volunteer at 0.8mm and 0.9mm isotropic spatial-resolutions using a GE (Waukesha, WI) MR-750 Premier Performance 3T scanner. This scanner is equipped with a 60cm ultrahigh-power gradient coil (peak strength 115mT/m) specifically designed for efficient diffusion MRI. Written informed consent was obtained from human subjects in accordance with the Duke University IRB. Multi-shot EPI (ms-EPI) data was acquired using 4 interleaved shots and 2 simultaneously excited bands of slices, with a blipped-CAIPI3 FOV/2 shift applied to one band. To further minimize overlap between bands, all DTI data was acquired using a rectangular 15.4x30.8cm FOV. In the 0.8mm scan, 4 b=0 and 30 b=800s/mm2 volumes were acquired with 142 axial slices, 192x384 sampling matrix (66% partial ky), TR/TE=9947/66.3ms, in 23:13min. In the 0.9mm scan, 4 b=0 and 38 b=800s/mm2 volumes were acquired with 126 axial slices, 172x344 sampling matrix (68% partial ky), TR/TE=8062/63.5ms, in 23:07min. The use of b=800 s/mm2 was based on a study in which sub-millimeter (0.8-0.9 mm) DTI was shown to have sufficient SNR to achieve reliable fiber tractography in GM4. To mitigate spatial distortions, an additional b=0 volume was acquired at the onset of each scan with a reversed polarity PE gradient. After reconstructing all ms-EPI data with multi-band (MB) MUSE5,6, MRtrix37 was used to remove noise8,9, Gibbs ringing artifacts10, eddy current effects11 and spatial distortions12,13 before applying a bias field correction. Diffusion tensors were then calculated and used to estimate fractional anisotropy (FA) and mean diffusivity (MD) maps.Additionally, a T1-weighted anatomical volume (MPRAGE) was acquired with a 0.8mm isotropic resolution. After registration with each DTI data set14, an anatomical segmentation was performed on the T1-weighted volume using FreeSurfer15 to estimate the WM boundary and PS. To approximate DTI metrics across the cortical layers, column analogues were generated between the cortical surfaces using surface normal vectors evenly spaced throughout the GM ribbon. Finally, cortical profiles of diffusion anisotropy and diffusivity were generated by projecting FA and MD maps onto 21 equidistant vertices along each column analogue.
Results and Discussion
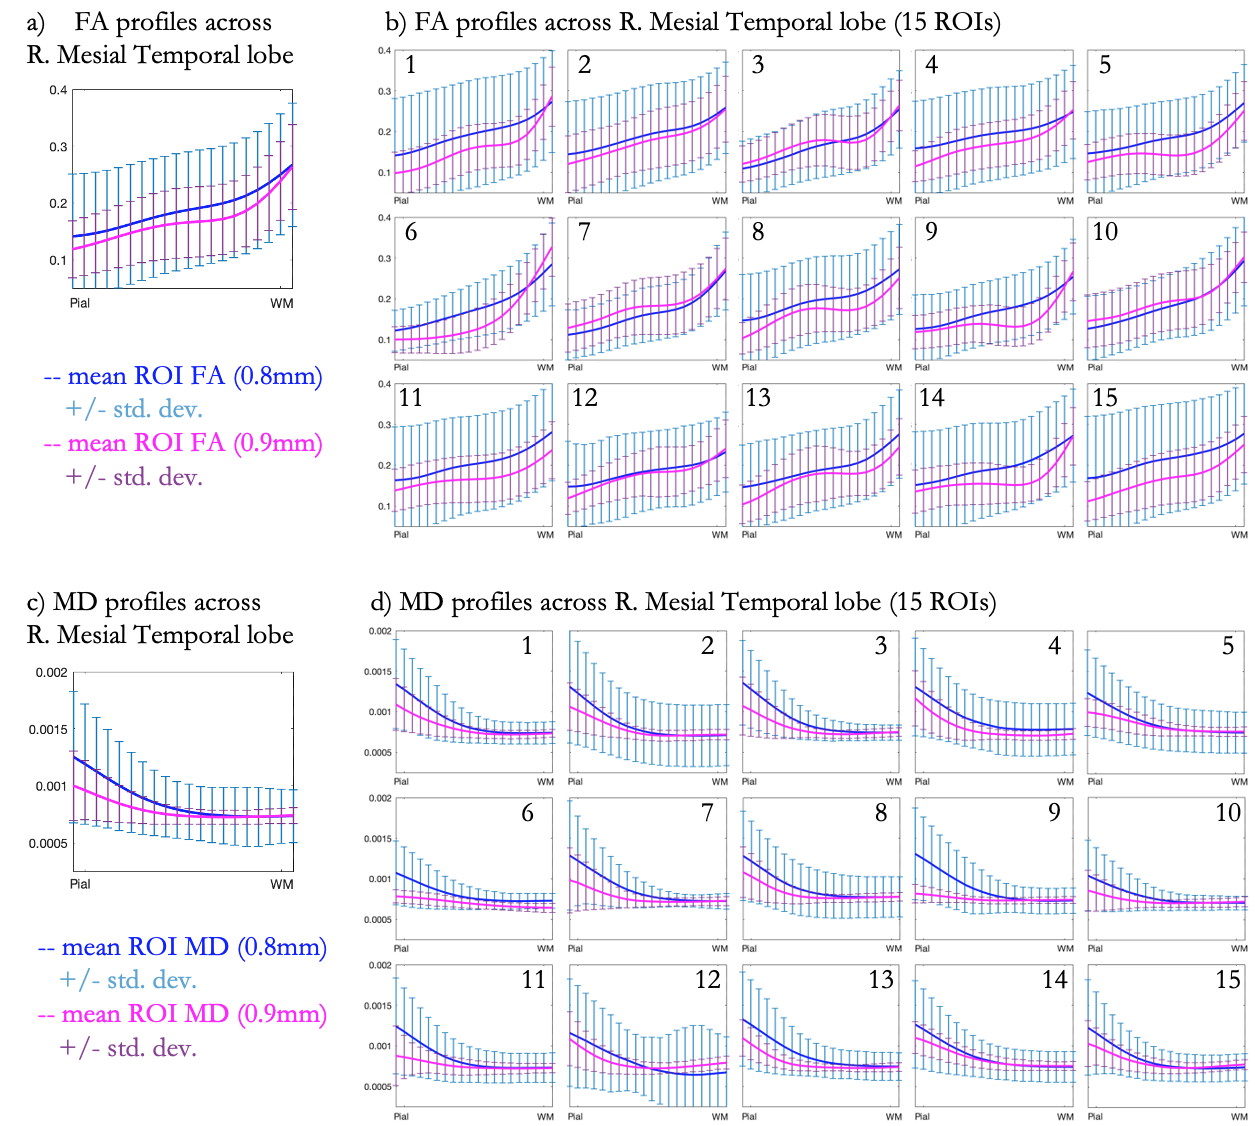
Fig. 1 shows avg(DWI), FA and MD maps for both 0.8mm and 0.9mm scans, highlighting the SNR and fidelity achieved at both sub-millimeter isotropic resolutions through MB-MUSE. Fig. 2a shows cortical column analogues spanning across the cortex, perpendicular to WM and PS. For this analysis, Fig. 2b shows the right mesial temporal lobe (rMTL) region while Fig. 2c shows the rMTL partitioned into 15 sub-regions. The SNR advantage of larger voxels and higher angular resolution at 0.9mm produces fewer noisy voxels in FA than at 0.8mm (Figs. 2d-2e), which is reflected in the cortical FA profiles averaged across all columns in the rMTL (Fig. 3a) and in each sub-ROI (Fig. 3b). Both resolutions show FA increasing with cortical depth from the PS to WM in both large and small ROIs, but the variance at 0.9mm is consistently much lower than at 0.8mm, and local extrema around the mid-cortex are more pronounced at 0.9mm. In Figs. 3c-3d, MD is shown to decrease steadily with cortical depth in all ROIs, with less variation again noted at 0.9mm than at 0.8mm.Conclusion
It has been shown that sufficient SNR to conduct DTI analyses in GM can be achieved at sub-millimeter isotropic spatial-resolutions using MB-MUSE. Cortical profiles derived from FA/MD maps projected onto column analogues appear consistent throughout the cortex, showing similar profiles across both large regions (rMTL) and smaller sub-regions. Although DTI at both 0.8mm and 0.9mm show similar profiles, the SNR advantage of 0.9mm provides a more robust interpretation of cortical microstructures, without a large sacrifice in resolution. Any irregularities noted in profiles of this kind can indicate abnormalities in cortical microstructures, potentially serving as biomarkers in detecting the early onset of neurological and neurodegenerative disorders.Acknowledgements
This work was funded in part by NIH grants R01 NS 075017, R24-106048, and S10-OD-021480.References
[1] Miller, K.L., Stagg, C.J., Douaud, G., Jbabdi, S., Smith, S.M., Behrens, T.E.J., Jenkinson, M., Chance, S.A., Esiri, M.M., Voets, N.L., Jenkinson, N., Aziz, T.Z., Turner, M.R., Johansen-Berg, H., McNab, J.A., Diffusion imaging of whole, post-mortem human brains on a clinical MRI scanner. Neuroimage 57(1), 167-181, 2011.
[2] Truong, T.K., Arnaud, G., Song, A.W. Cortical depth dependence of the diffusion anisotropy in the human cortical gray matter in vivo. PloS one 9.3:e91424, 2014.
[3] Setsompop, K., Gagoski, B.A., Polimeni, J.R., Witzel, T., Wedeen, V.J., Wald, L.L., Blipped-Controlled Aliasing in Parallel Imaging (blipped-CAIPI) for simultaneous multi-slice EPI with reduced g-factor penalty. Magn. Reson. Med. 67(5), 1210–1224, 2012.
[4] Bruce, I.P., Petty, C., Song, A.W., Imaging Cortical Columns in Gray Matter with Sub-Millimeter Isotropic DTI. Intl. Proc. Soc. Magn. Reson. Med. 26, 3361, 2019.
[5] Chen, N. K., Guidon, A., Chang, H. C., Song, A., W. A robust multi-shot scan strategy for high-resolution diffusion weighted MRI enabled by multiplexed sensitivity-encoding (MUSE). Neuroimage 72: 41-47, 2013.
[6] Bruce, I.P., Chang, H.C., Petty, C., Chen, N.K., Song, A.W. 3D-MB-MUSE: a robust 3D multi-slab, multi-band and multi-shot reconstruction approach for ultrahigh resolution diffusion MRI. Neuroimage, 159:46-56, 2017.
[7] Tournier, J. D., Calamante, F., Connelly, A. MRtrix: Diffusion tractography in crossing fiber regions. Int. J. Imaging Syst. Technol. 22: 53-66, 2012.
[8] Veraart, Jelle, et al. Denoising of diffusion MRI using random matrix theory. Neuroimage 142:394-406, 2016.
[9] Veraart, J., Fieremans, E., Novikov, D.S. Diffusion MRI noise mapping using random matrix theory. Magn. Reson. Med. 76(5): 1582-1593, 2016.
[10] Kellner, E., Dhital, B., Kiselev, V.G., Reisert, M. Gibbs‐ringing artifact removal based on local subvoxel‐shifts. Magn. Reson. Med. 76(5): 1574-1581, 2016.
[11] Yongyue, Z., Brady, M., Smith, S. Segmentation of brain MR images through a hidden Markov random field model and the expectation-maximization algorithm. IEEE transactions on medical imaging 20.1: 45-57, 2001.
[12] Andersson JLR, Skare S, Ashburner J. How to correct susceptibility distortions in spin-echo echo-planar images: application to diffusion tensor imaging. NeuroImage, 2003; 20(2):870-888.
[13] Smith SM, et al. Advances in functional and structural MR image analysis and implementation as FSL. NeuroImage, 2004; 23(S1):208-219.
[14] Avants, B.B., Tustison, N., Song, G. Advanced normalization tools (ANTS). Insight j 2.365: 1-35, 2009.
[15] Fischl, B. FreeSurfer. NeuroImage. 62 (2): 774–781, 2012.
Figures