2026
Probing human cortical microstructure using diffusion MRI: Insights from N=17,646 individuals of the UK Biobank.1Department of Health and Functioning, Western Norway University of Applied Sciences, Bergen, Norway, 2NORMENT, University of Oslo, Oslo, Norway
Synopsis
While diffusion MRI (dMRI) has been established as a powerful tool for studying human brain white matter, its potential for characterising structural grey matter properties waits for to be fully realised. dMRI is capable of providing unique complementary information about cortical microstructure, function and connectivity. Here, we describe the spatial distribution and individual differences in cortical grey matter microstructure across 17,646 UK Biobank (UKB) participants using three diffusion MRI approaches, namely, diffusion tensor imaging, kurtosis tensor imaging and spherical mean technique, and demonstrate its predictive value for brain age prediction using machine learning.
Introduction
Cerebral cortical structure is usually visualised and quantified using T1- or T2-weighted MRI modalities, which enable quantitative mapping of MRI signal properties and provide morphometric information such as thickness, surface and volume1. Recently, increased interest in grey matter (GM) architecture has stimulated an intensive application of diffusion MRI to the cortex2. Not so many conventional diffusion approaches are applicable to study low anisotropic GM tissue, namely diffusion and kurtosis tensor imaging (DTI&DKI)3, and spherical mean technique (SMT MC)4. Modelling of the GM tissue is not well developed in terms of diffusion approaches5 and demands a complementary evaluation of the diffusion parameters in different GM regions, recalling large samples sizes to gain adequate statistical power to delineate characteristic GM microstructural patterns6. Here, we estimated a range of diffusion parameters derived from three aforementioned diffusion approaches in the cortex using UK Biobank (UKB) data7 (N = 17,646). We subsequently applied a brain age prediction technique1 based on diffusion measures for the left and right hemispheres in order to demonstrate the feasibility and predictive value of diffusion approaches in GM.Methods
In order to extract GM regional metrics delineated by gyri and sulci and to perform cortex parcellation, we used a commonly accepted method based on the FreeSurfer v6.0.0 pipeline for T1-weighted images8. In parallel, raw diffusion data were processed using an optimised pipeline9. Next, we converted all scalar diffusion maps into FreeSurfer space using cross-modal registration with a boundary-based cost function (bbregister13). The transformations were estimated using fractional anisotropy (FA) map for each subject and applied to the remaining scalar diffusion maps. After quality control (QC) procedures allowing one to exclude distorted and misaligned images based on the YTTRIUM algorithm10 and thresholding of the mean FA values in corpus callosum in the aligned FA maps by 3 standard deviations (std), the final sample consisted of 17,646 participants.In order to evaluate the dependence of the diffusion metrics on the cortical thickness, we evaluated the correlations for each region of interest based on the Desikan-Killiany atlas14 using a linear regression model: Diffusion ~ Thickness + Age + Sex + Site using fitlm Matlab function.
Brain age was predicted age for each subject using the XGBoost algorithm with 10-folds cross-validation implemented in Julia language11, and brain age gap (BAG), i.e. the difference between the chronological and predicted age was computed for each subject and corrected for a well known age-bias12. For brain age prediction, we used FA, mean kurtosis (MK) and SMT MC axonal water fraction (intra) metrics averaged over the cortical regions from the Desikan-Killiany atlas for the left and right hemispheres, separately. The scanner sites and participants’ age and sex were used as covariates in the linear regression model12.
Results
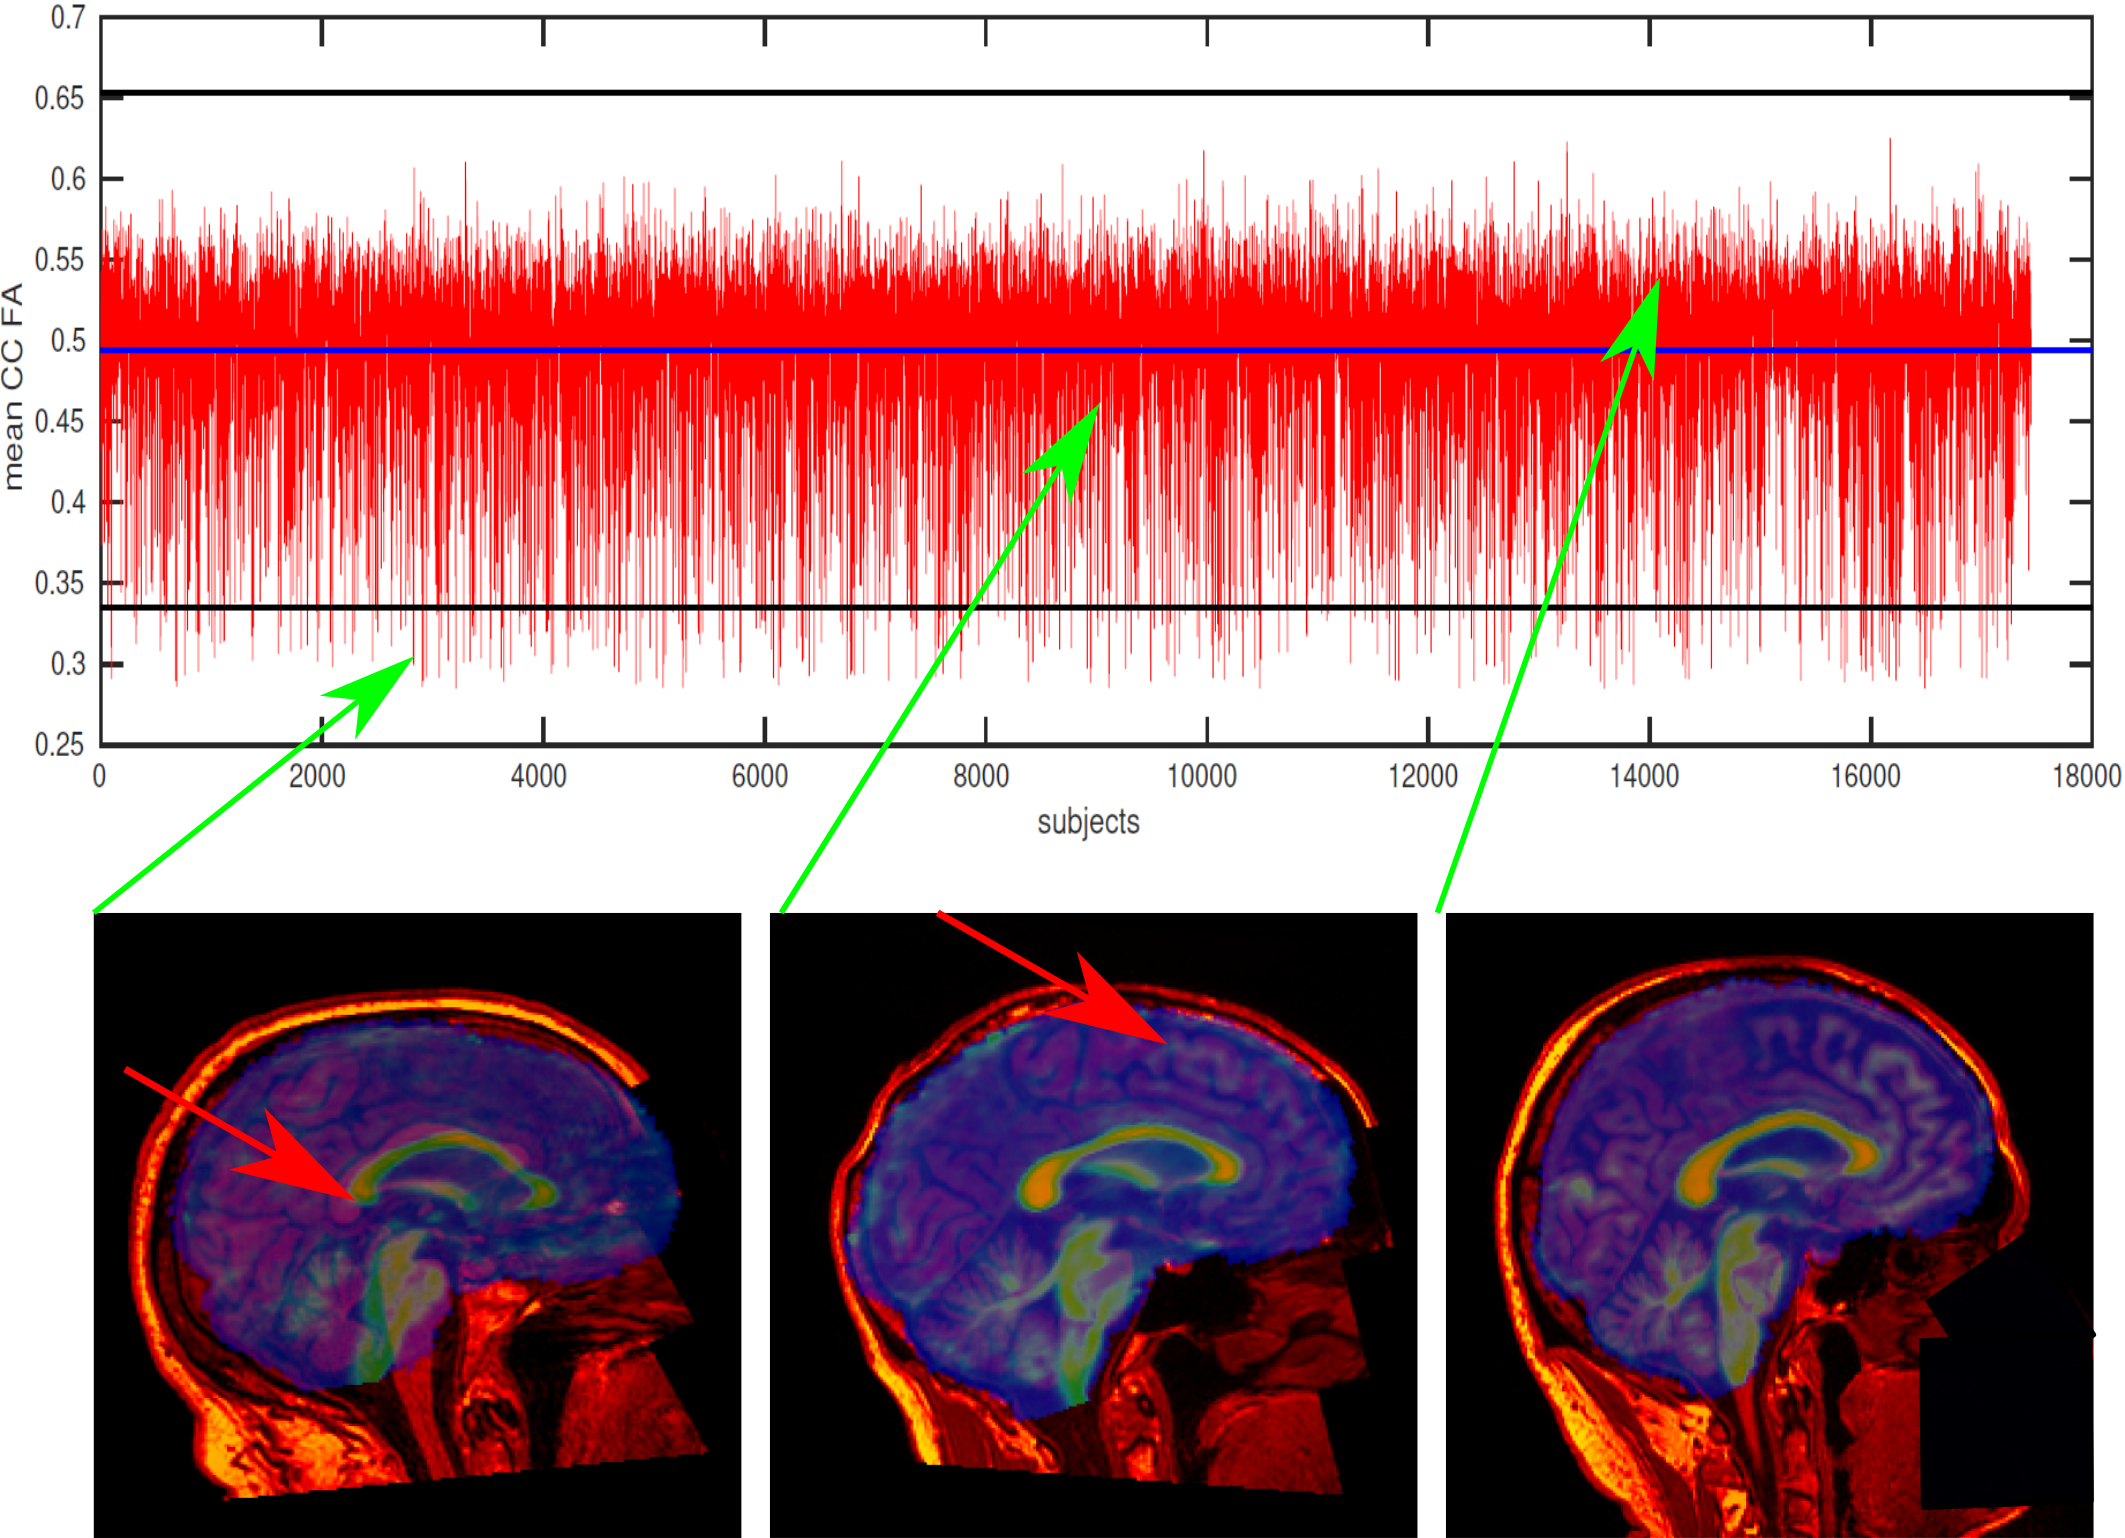
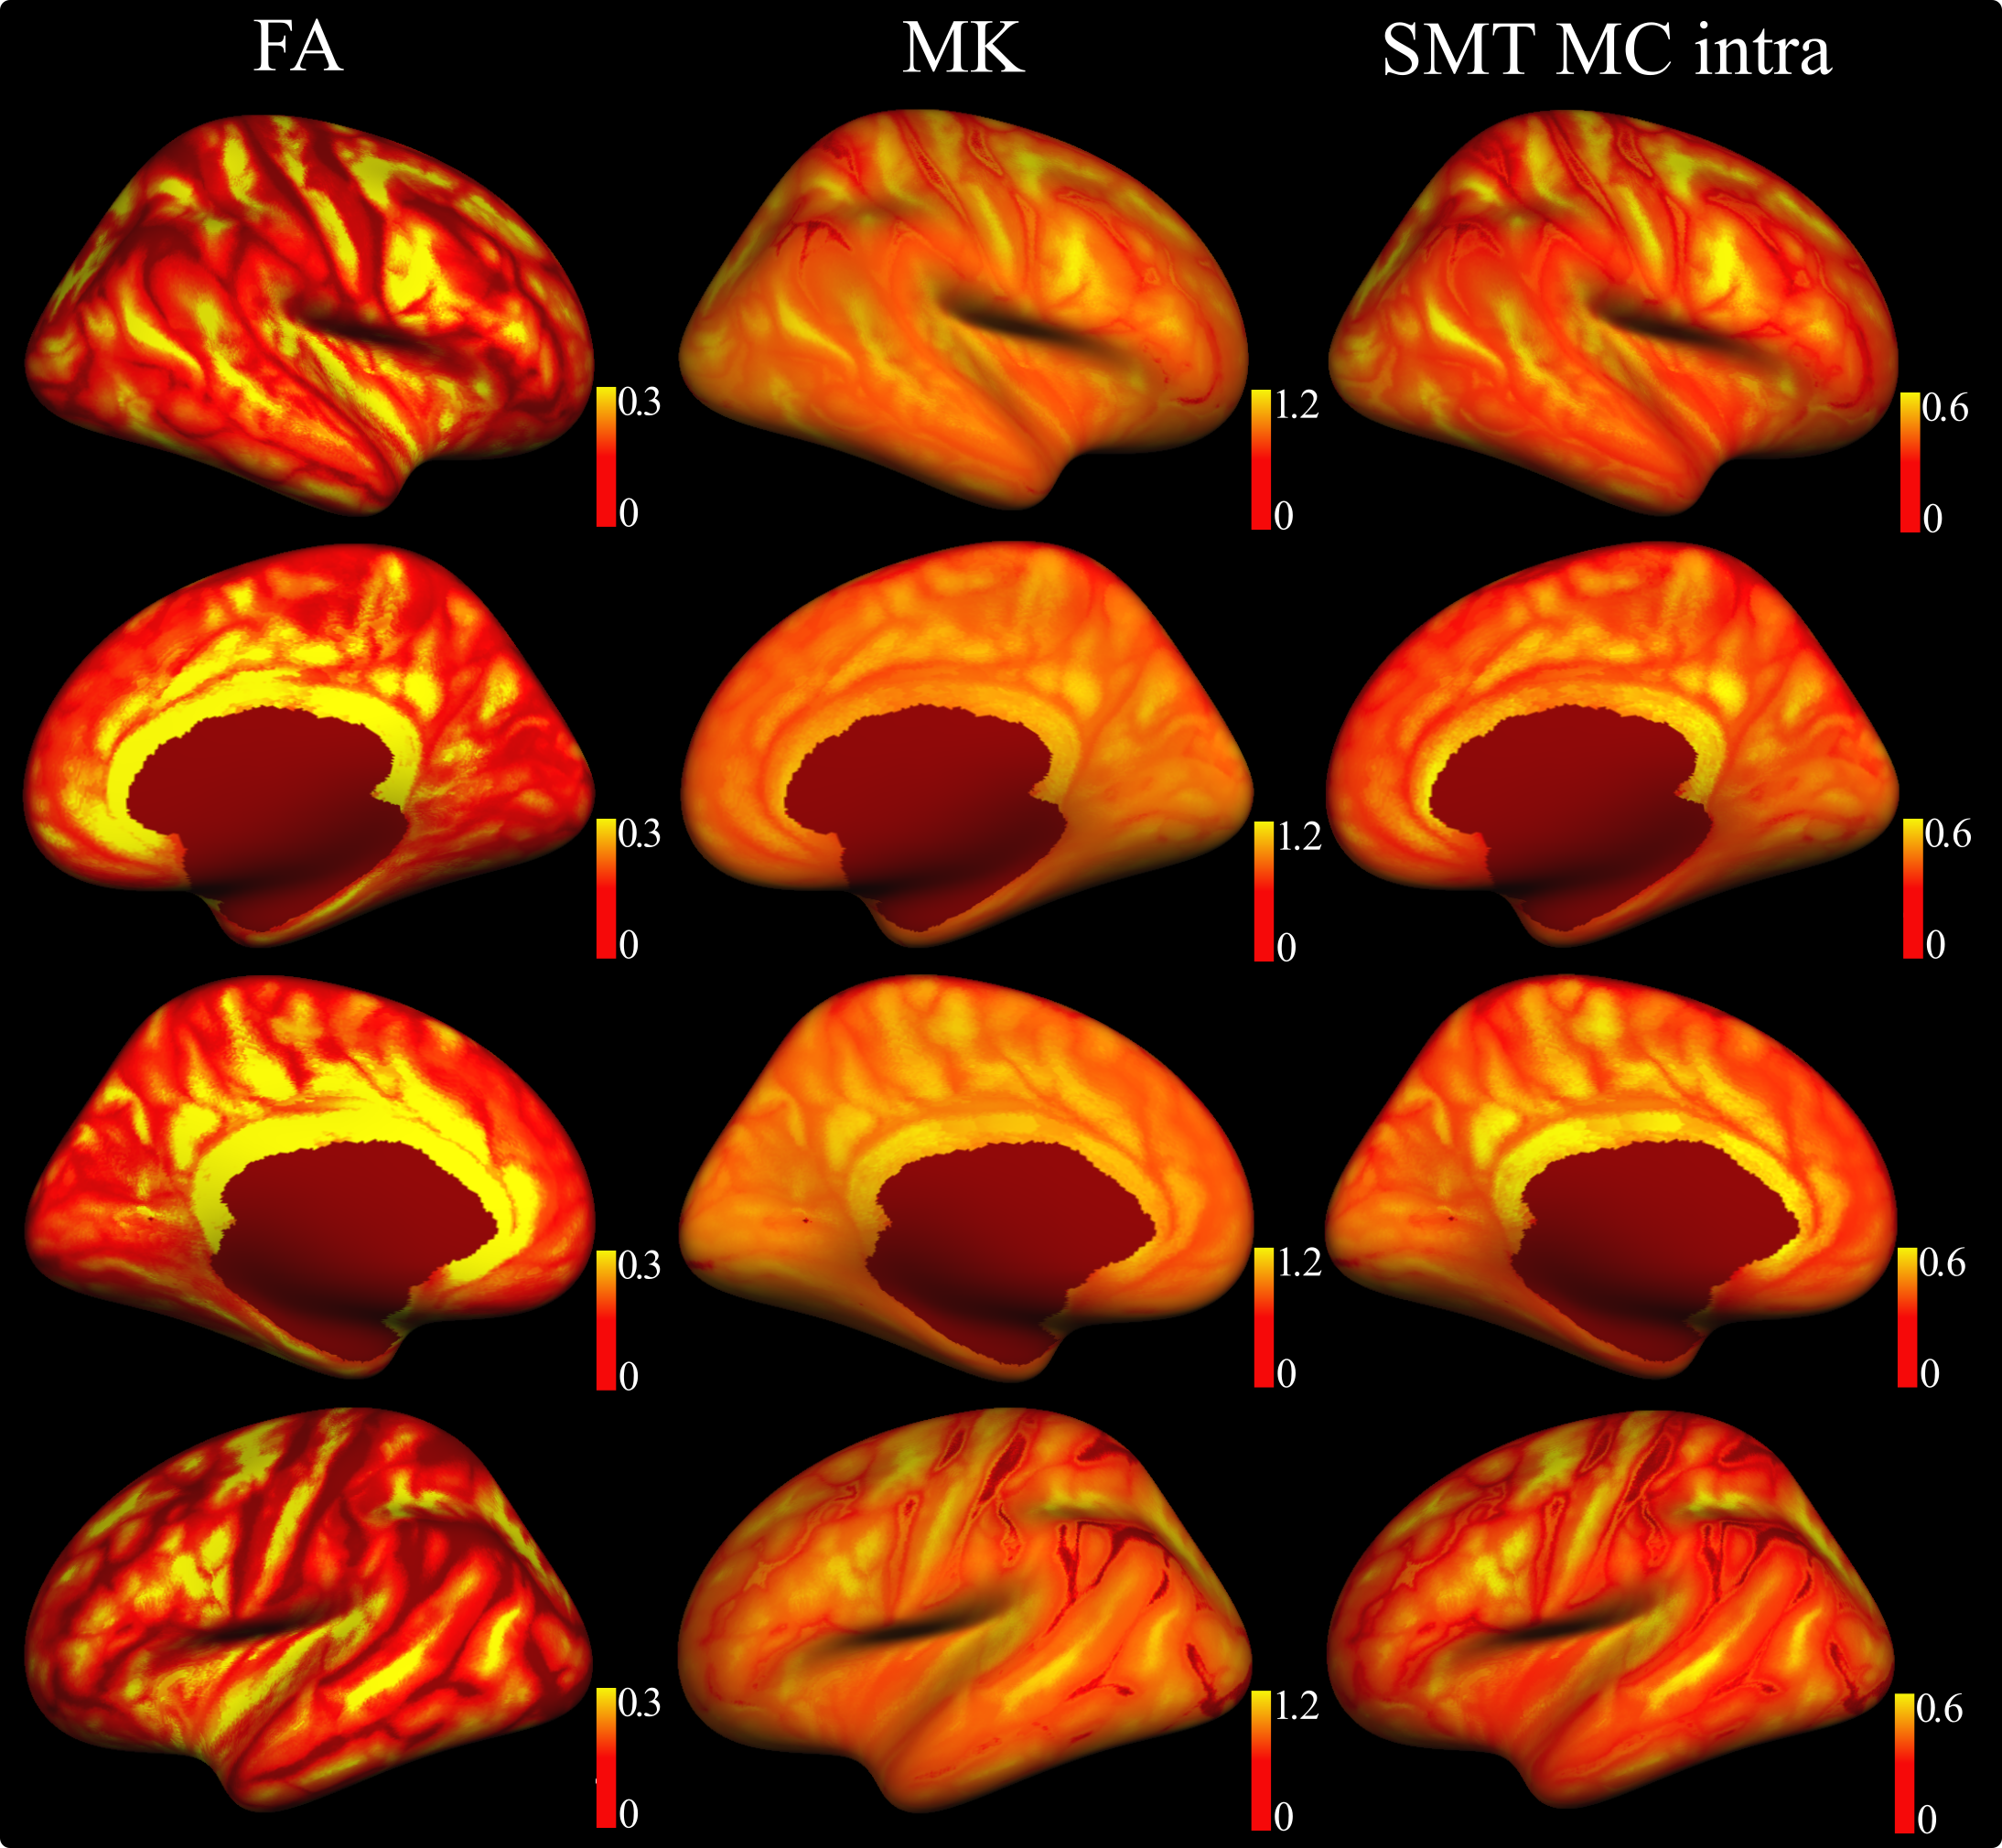
The results of QC procedure are presented in Fig. 1: Images with FA below 3 std (low quality, 395 subjects), between 3 std and mean value (intermediate quality, 6546 subjects), and over the mean value (high quality, 10705 subjects).In Fig. 2 we present the diffusion maps for left/right hemispheres on the cortex averaged over 17,646 participants for FA, MK and intra metrics. In the case of FA map, the spatial pattern repeats gyri/sulci distribution. In turn, intra map pattern has a bit more complicated structure with smoothed cortex region transitions.
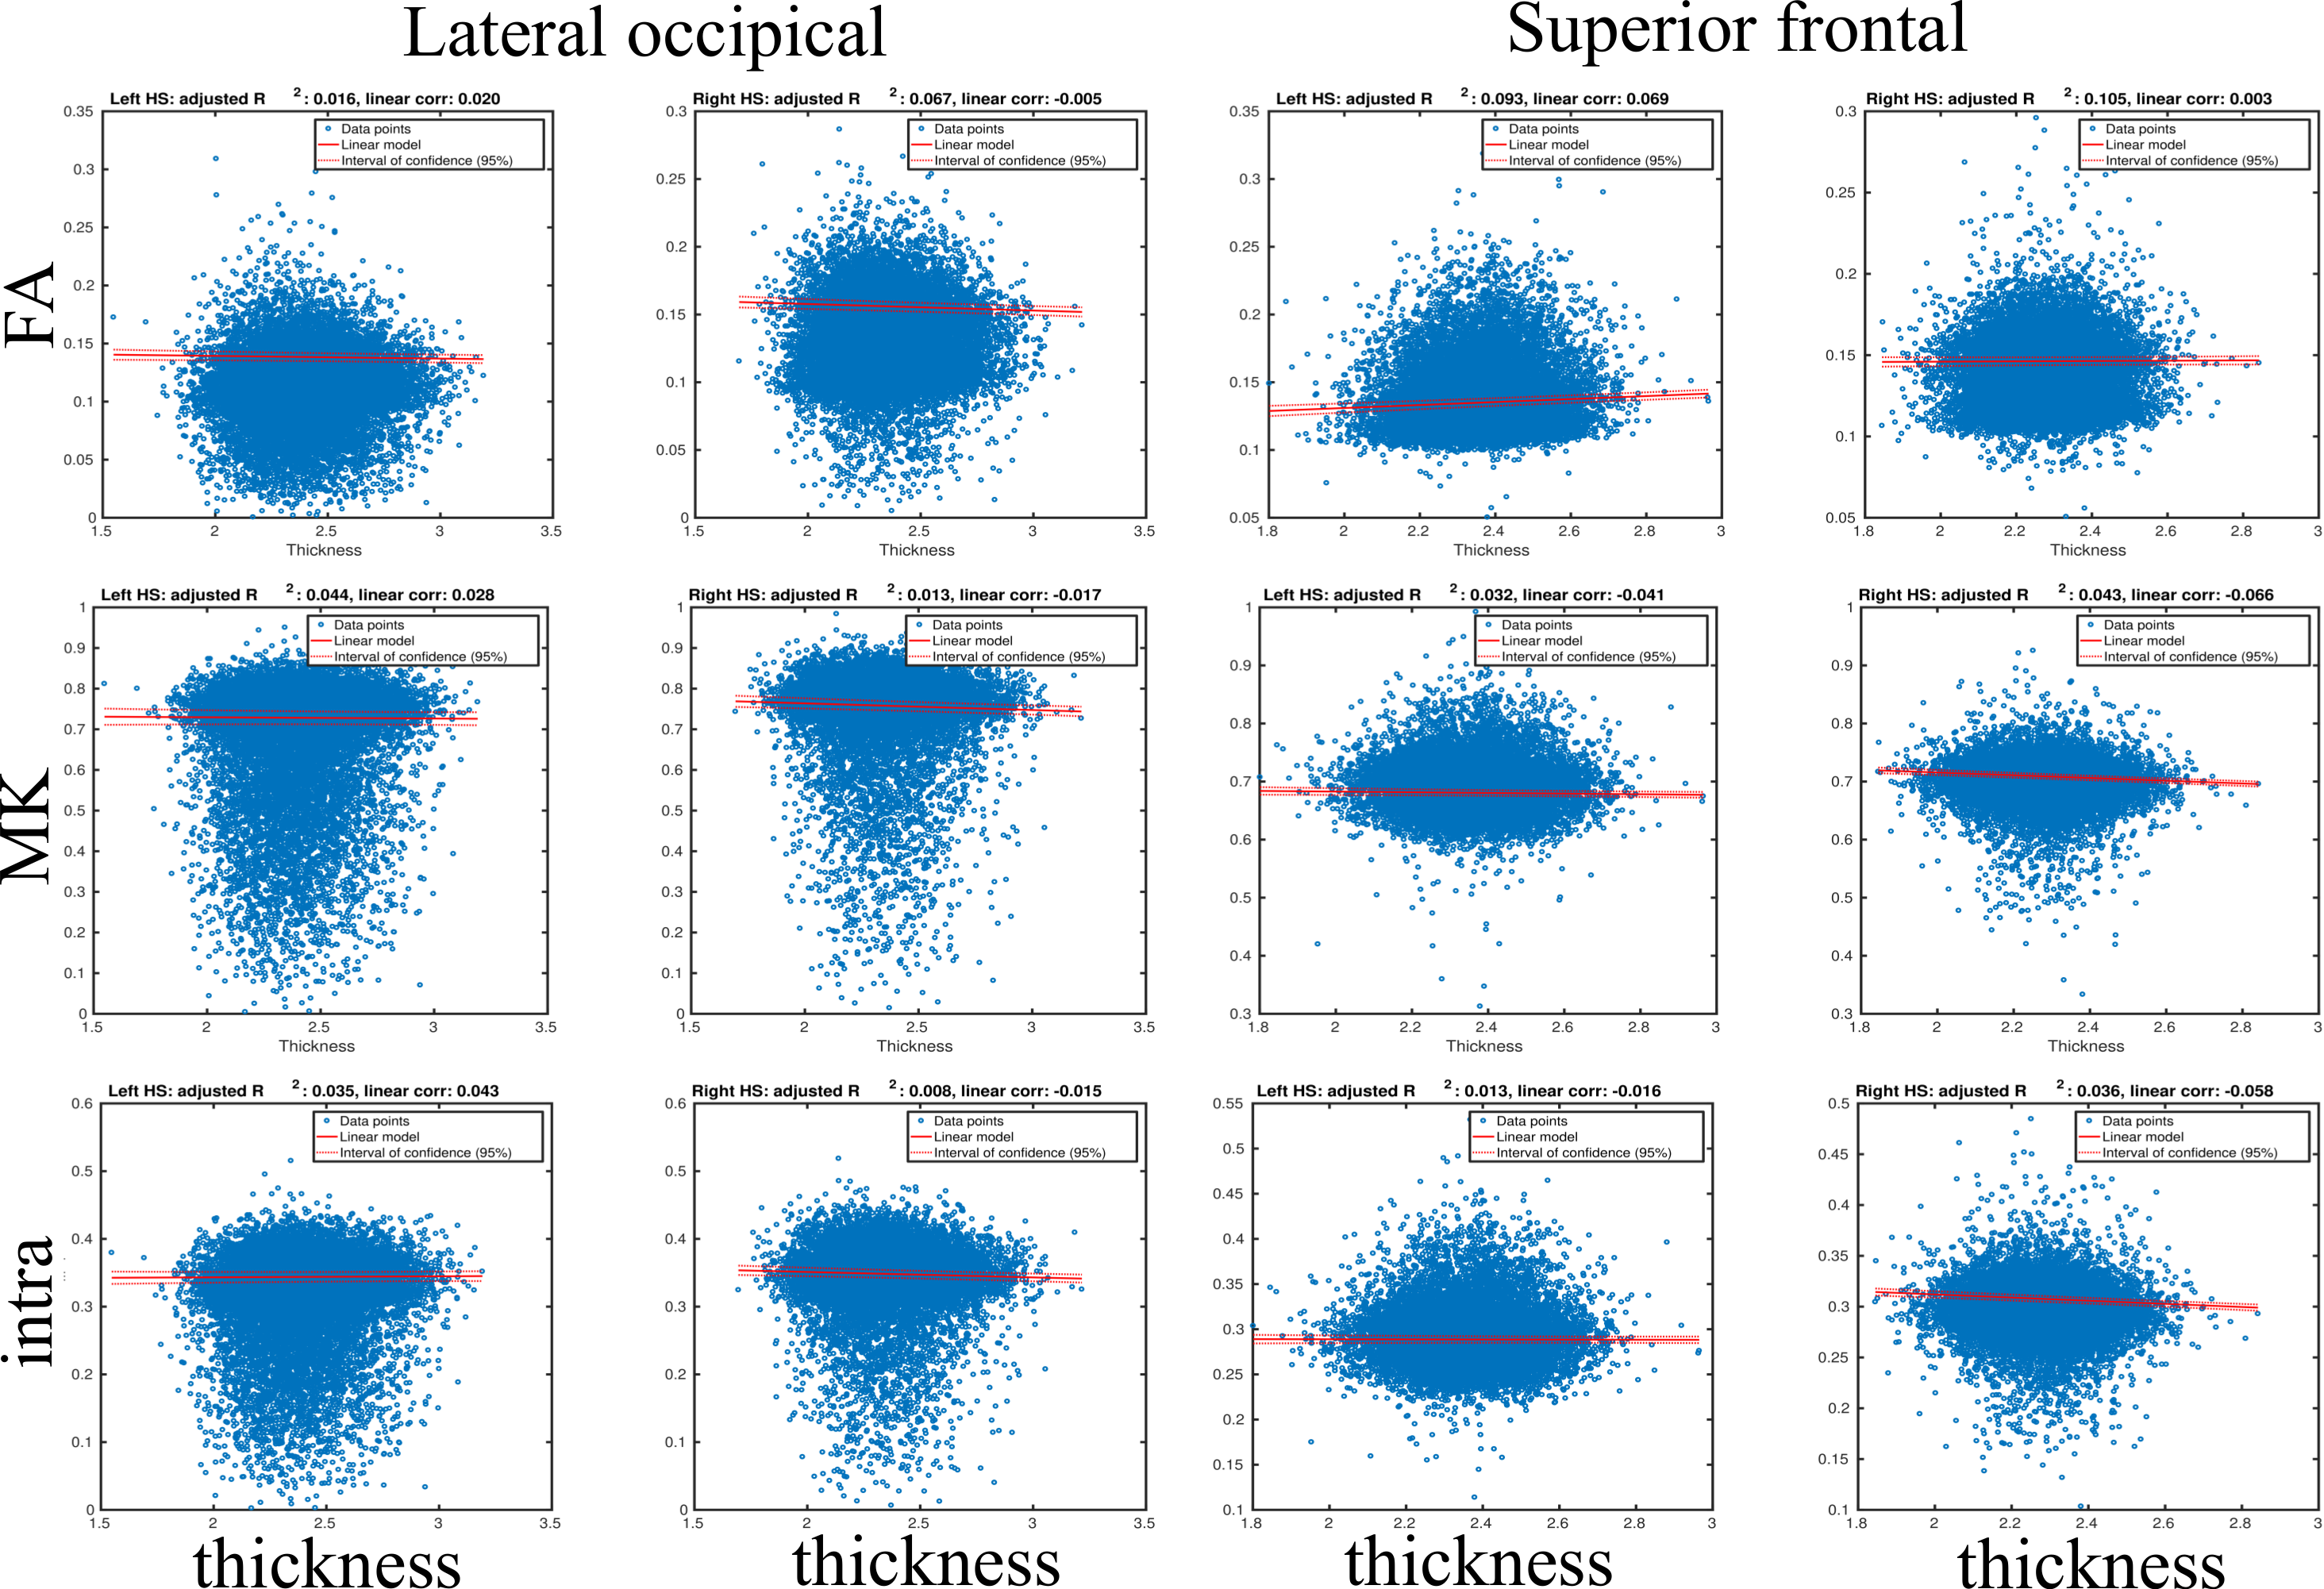
Fig. 3 shows the scatter plots between the diffusion metrics and GM thickness and the results of the regression analysis. Linear regressions revealed weak associations between the diffusion metrics and cortical thickness (max R-squared < 0.1, max linear correlation < 0.07), while covarying for age, sex, and scanner site.
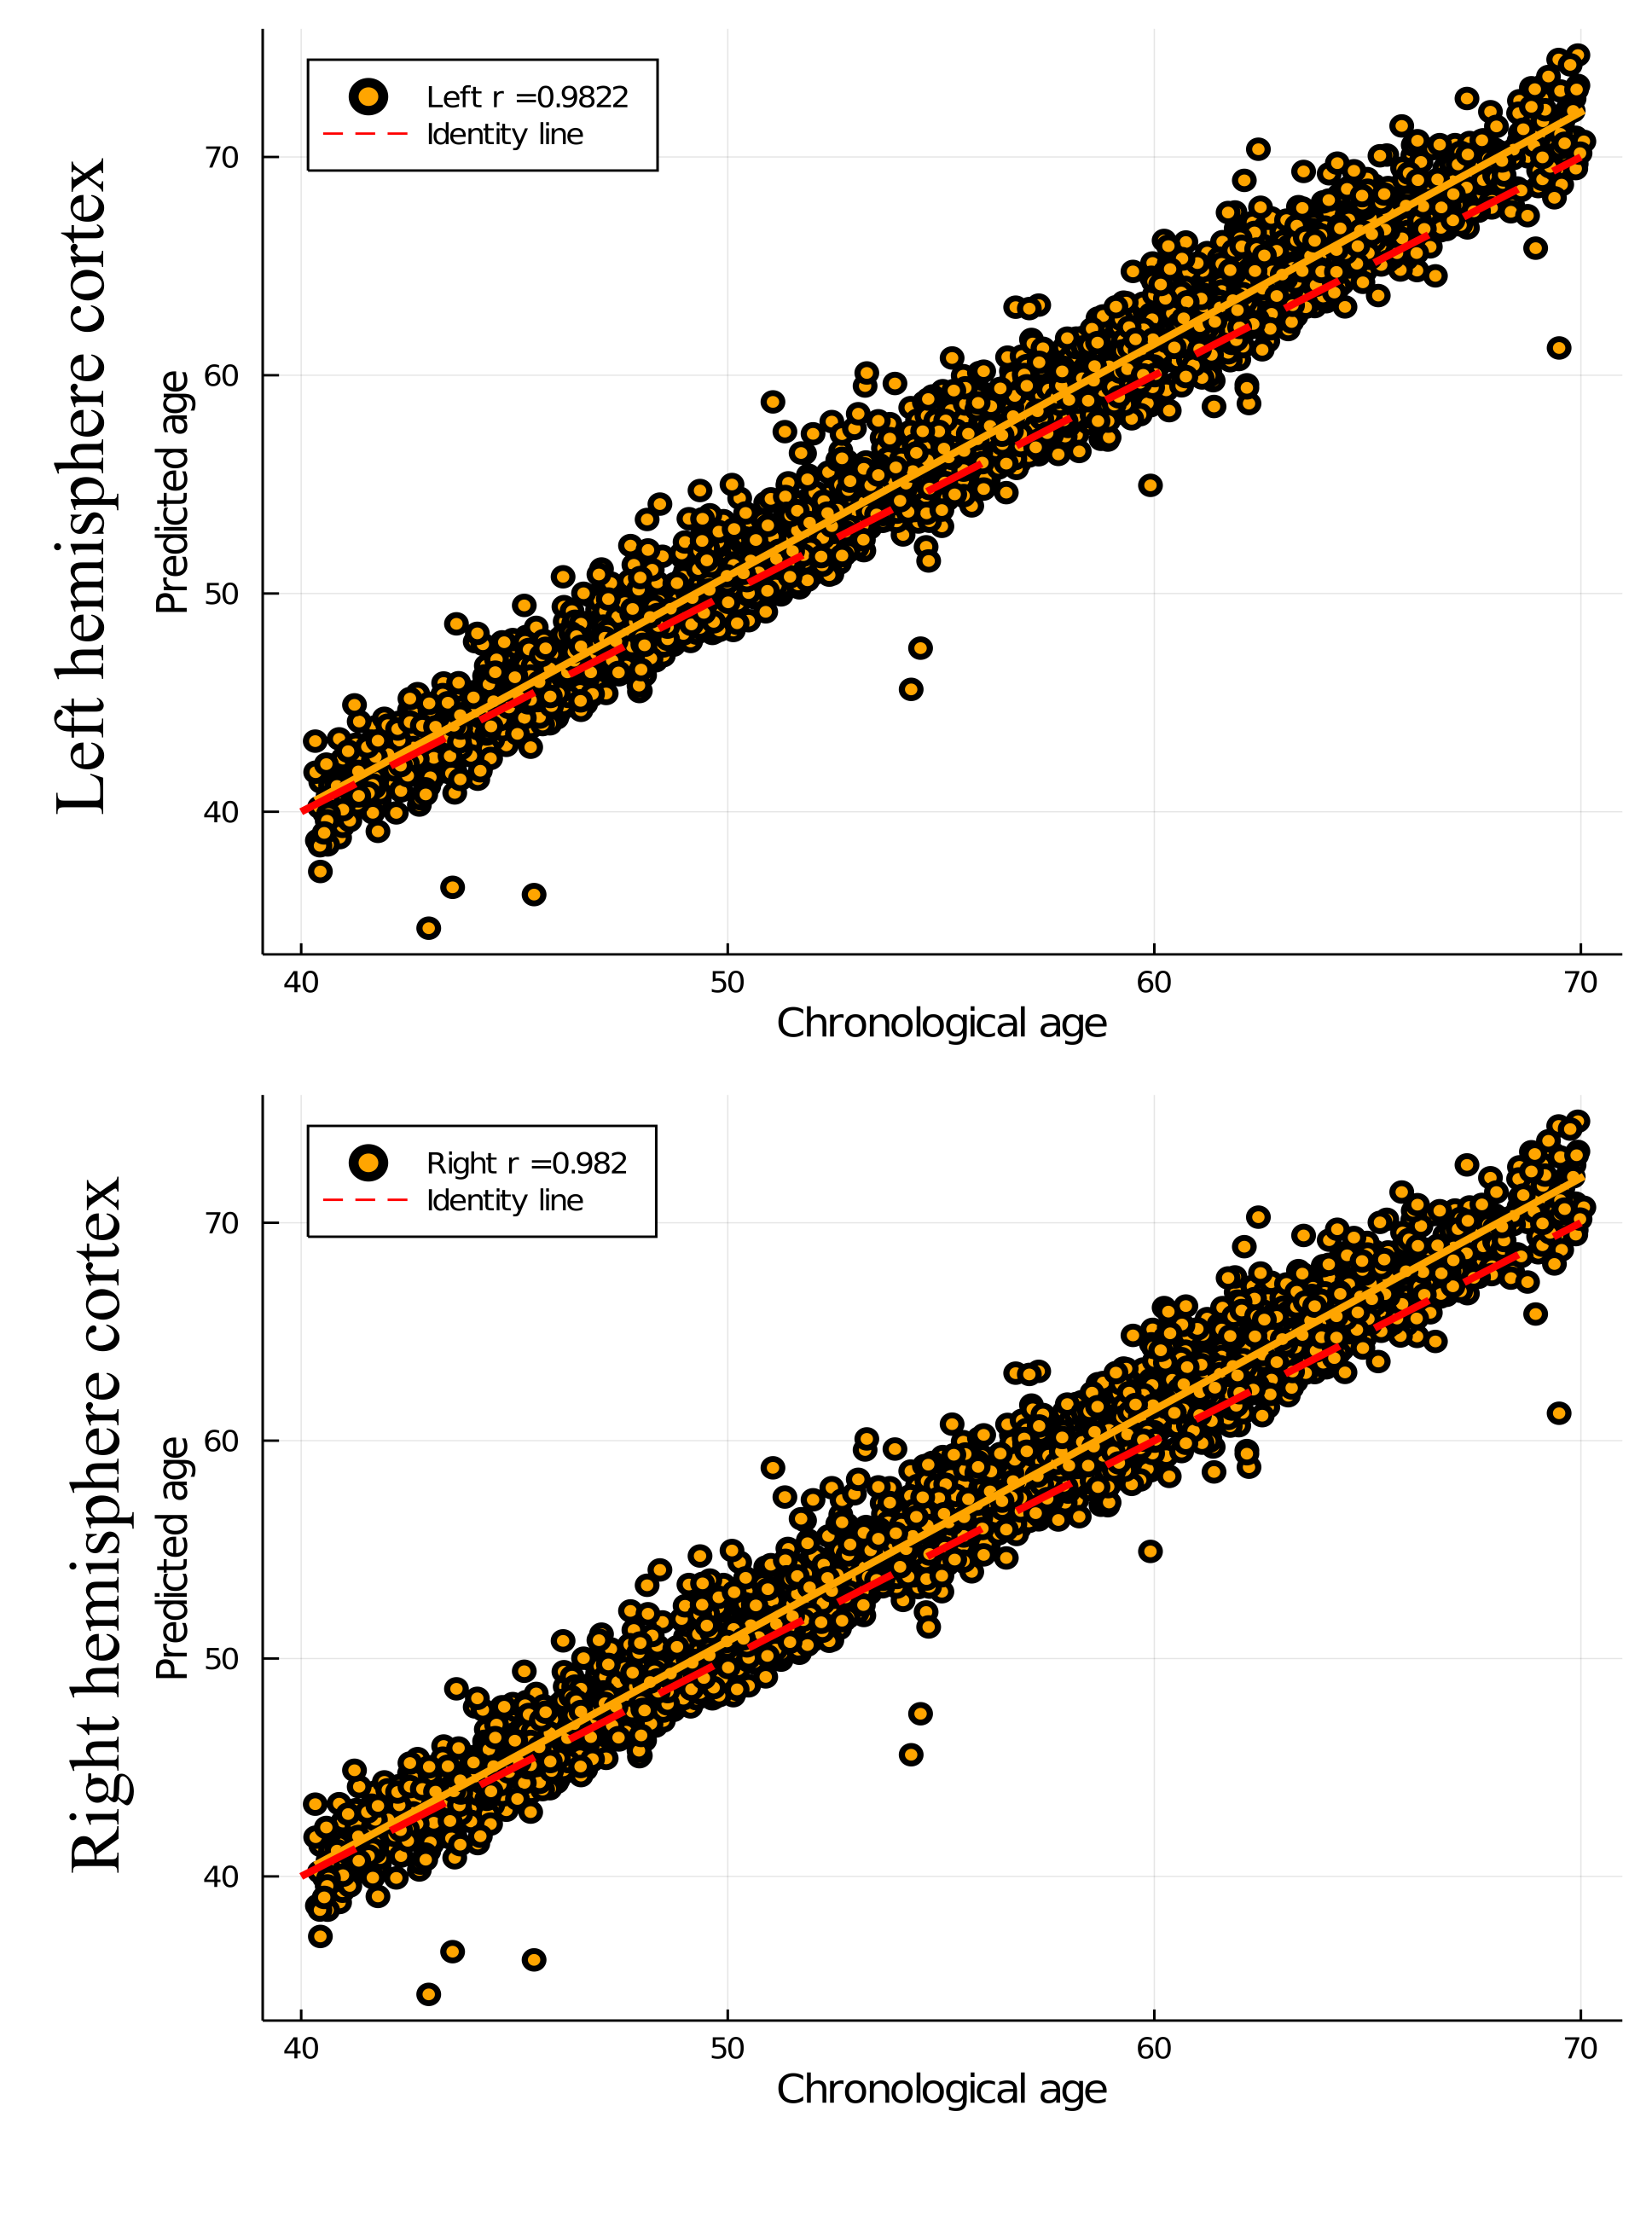
Fig. 4 shows predicted age as a function of chronological age. The linear correlations for left- and right-hemisphere derived brain age predictions were 0.9822 and 0.982, respectively.
Discussion and Conclusion
Advanced diffusion MRI approaches provide rich and complementary information about cortical GM organisation and integrity. The mean diffusion maps projected on the cortex and averaged over the 17,646 subjects present reference information about microstructural variability that complements conventional GM measures such as thickness and volume (see Fig. 2). Notably, SMT MC intra metric exhibits quite interesting spatial patterns on the cortex distinguishing from FA and MK maps. One can observer that intra values on the cortex are distributed in finer structures with clearly visible difference comparing to FA or MK maps. Keeping in mind, that intra is sensitive to axonal density, we plan to verify these results with other parcellation atlases in order to reveal persistent regions and repeatable spatial patterns on the cortex. Interestingly, linear regressions revealed weak associations between diffusion measures and cortical thickness (Fig. 3). Thus, GM diffusion metrics may provide independent MRI phenotypes for relevant clinical applications, such as brain age prediction (see Fig. 4). Moreover, the diffusion features from left- and right-hemispheres demonstrated close predictive power in the case of BAG estimations.In conclusion, diffusion MRI provides sensitive phenotypes of cortical microstructure that supplement conventional morphometric measures and show predictive value for brain age prediction, with potential utility for the clinical neurosciences.
Acknowledgements
This work was funded by the Research Council of Norway (249795). This research has been conducted using the UK Biobank under Application 27412.References
1. Kaufmann et al., Common brain disorders are associated with heritable patterns of apparent aging of the brain. Nature Neuroscience 22 (2019) 1617-1623.
2. Ganepola et al., Using diffusion MRI to discriminate areas of cortical grey matter. Neuroimage 182 (2018) 456-468.
3. Jensen et al., Diffusional kurtosis imaging: the quantification of non-gaussian water diffusion by means of magnetic resonance imaging. Magn. Reson. Med. 53 (2005) 1432-1440.
4. Kaden et al., Multi-compartment microscopic diffusion imaging. Neuroimage 139 (2016) 346-359.
5. Jespersen et al., Neurite density from magnetic resonance diffusion measurements at ultrahigh field: comparison with light microscopy and electron microscopy. Neuroimage 49 (2009) 205-216.
6. Lerch et al., Studying neuroanatomy using MRI. Nature Neuroscience 20 (2017) 314-326.
7. Miller et al., Multimodal population brain imaging in the UK Biobank prospective epidemiological study. Nature Neuroscience 19 (2016) 1523-1536.
8. Fischl, Freesurfer. Neuroimage 62 (2012) 774-781.
9. Maximov et al., Towards an optimised processing pipeline for diffusion magnetic resonance imaging data: Effects of artefact corrections on diffusion metrics and their age associations in UK Biobank. Human Brain Mapping 40 (2019) 4146-4162.
10. Maximov et al., Fast qualitY conTrol meThod foR derIved diffUsion Metrics (YTTRIUM) in big data analysis: UK Biobank 18608 example. BioRxiv.org https://doi.org/10.1101/2020.02.17.952697.
11. Chen and Guestrin. XGBoost: A Scalable Tree Boosting System. In Proceedings of the 22nd ACM SIGKDD International Conference on Knowledge Discovery and Data Mining (pp. 785–794). New York, NY, USA: ACM. https://doi.org/10.1145/2939672.2939785
12. Smith et al., Estimation of brain age delta from brain imaging. Neuroimage 200 (2019) 528-539.
13. Greve and Fischl. Accurate and robust brain image alignment using boundary-based registration. Neuroimage 48 (2009) 63-72.
14. Desikan et al., An automated labeling system for subdividing the human cerebral cortex on MRI scans into gyral based regions of interest. Neuroimage 31 (2006) 968-980.
Figures