2025
Investigating the Relationship Between Morphology and Microstructure in the Hippocampus1Department of Neuroscience, Schulich School of Medicine & Dentistry, Western University, London, ON, Canada, 2Centre for Functional and Metabolic Mapping, Robarts Research Institute, Western University, London, ON, Canada
Synopsis
Aberrations of hippocampal subfields and microstructure are well studied, however, current in-vivo measures of microstructure are non-specific towards intra-hippocampal pathways and neurites within subfields. This is partly due to its complex and folded structure. Although highly folded, the hippocampus maintains an intrinsic coordinate system with well defined axes along the anterior-posterior, proximal-distal, and inner-outer dimensions. Importantly, hippocampal microstructure tends to align with these axes. Specific macrostructural measures such as gradient vector fields can be derived from these axes. Leveraging these measures, we were able to find systematic correlations between macrostructure and local microstructure in the hippocampus.
Introduction
The hippocampus is particularly vulnerable to certain neurological diseases such as dementia and epilepsy, in which it is often one of the earliest aberrant structures1,2. Atrophy in hippocampal subfields is well studied2,3, but microstructural characterization of intra-hippocampal pathways and neurites within these subfields has the potential to provide increasingly specific markers of hippocampal integrity. Although the hippocampus is a complex folded structure, it possesses an intrinsic coordinate system with defined axes along the anterior-posterior (AP), proximal-distal (PD), and inner-outer (IO) directions. Notably, hippocampal microstructure is aligned with these macrostructural axes. For example, the pyramidal axons of the CA1 subfield are oriented across lamina (IO axis), the trisynpatic pathway is aligned across subfields (PD axis), and external white matter bundles such as the fimbria are aligned longitudinally (AP axis)2. Recent studies have proposed an approach to computationally unfold the hippocampus to define these macrostructural axes4. The purpose of this study is to investigate how the morphology of the hippocampus, namely the macrostructural gradients formed along the canonical axes, are related to local microstructure. Correlations between macro and micro-structure could be used to develop anatomical priors for microstructural models and potentially provide pathway-specific biomarkers of hippocampal integrity.Methods
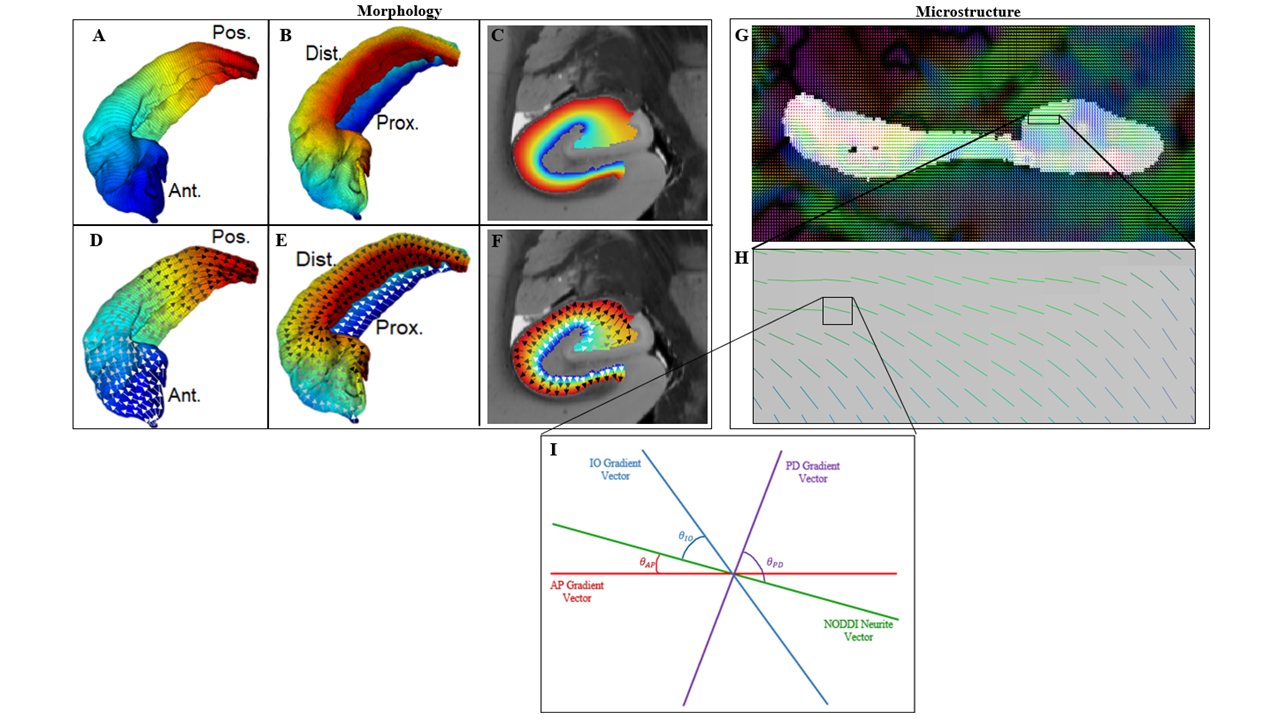
Data – The Human Connectome Project (HCP) 1200 dataset5 was used including 3T structural and diffusion weighted images. Specifically, the Unrelated 100 subset was chosen. Structural images from HCP 12005 were obtained using a 3D MPRAGE sequence with 0.7 mm3 isotropic voxels. Diffusion images were obtained using a spin-echo EPI sequence with 1.25 mm3 isotropic voxels, 3 shells, and 90 diffusion-encoding directions.Macrostructural Gradients - Unfolding of hippocampi was performed to generate Laplacian potential fields in the AP, PD, and IO directions4 (figure 1A-C). The first derivative of the potential field was taken, resulting in the gradient or local vector field along each dimension (figure 1D-F).
Microstructure – Neurite Orientation Dispersion and Density Imaging (NODDI)6 was applied on diffusion data using the Microstructure Diffusion Toolbox7. Specifically, the NODDI neurite vectors (“sticks”) (figure 1G & H), Orientation Dispersion Index (ODI), and Neurite Density Index (NDI) were used6.
Dot Products – Figure 1I shows a pictorial of macrostructural vectors and the NODDI neurite vector in a single voxel. The angle between each macro and NODDI vector was used to calculate dot products. The dot product values between each direction and NODDI were then averaged across all participants and the standard deviation for each direction was calculated. Averaging across participants was done in an unfolded coordinate space4. Left and right hippocampi measures were combined.
Correlation Coefficients – Correlation coefficients were calculated between each participant’s dot product map (AP, PD, IO) and their corresponding ODI and NDI maps.
Analysis – For the dot products, one-way ANOVAs and post-hoc Tukey tests were performed within each gradient direction to determine if there were any significant differences across subfields. A similar analysis was done on the correlation coefficients to determine if there were any significant differences between directions. Fisher’s Z-transformation was applied to correlational values to approximate normality8.
Results
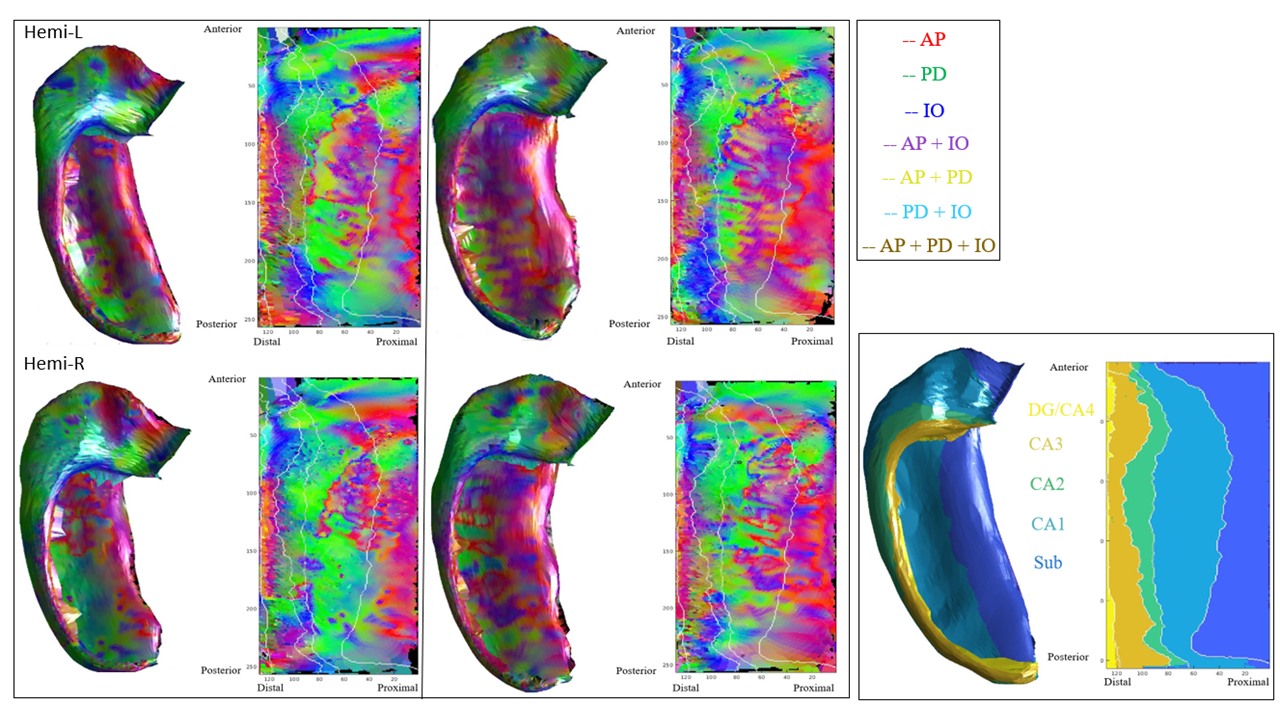
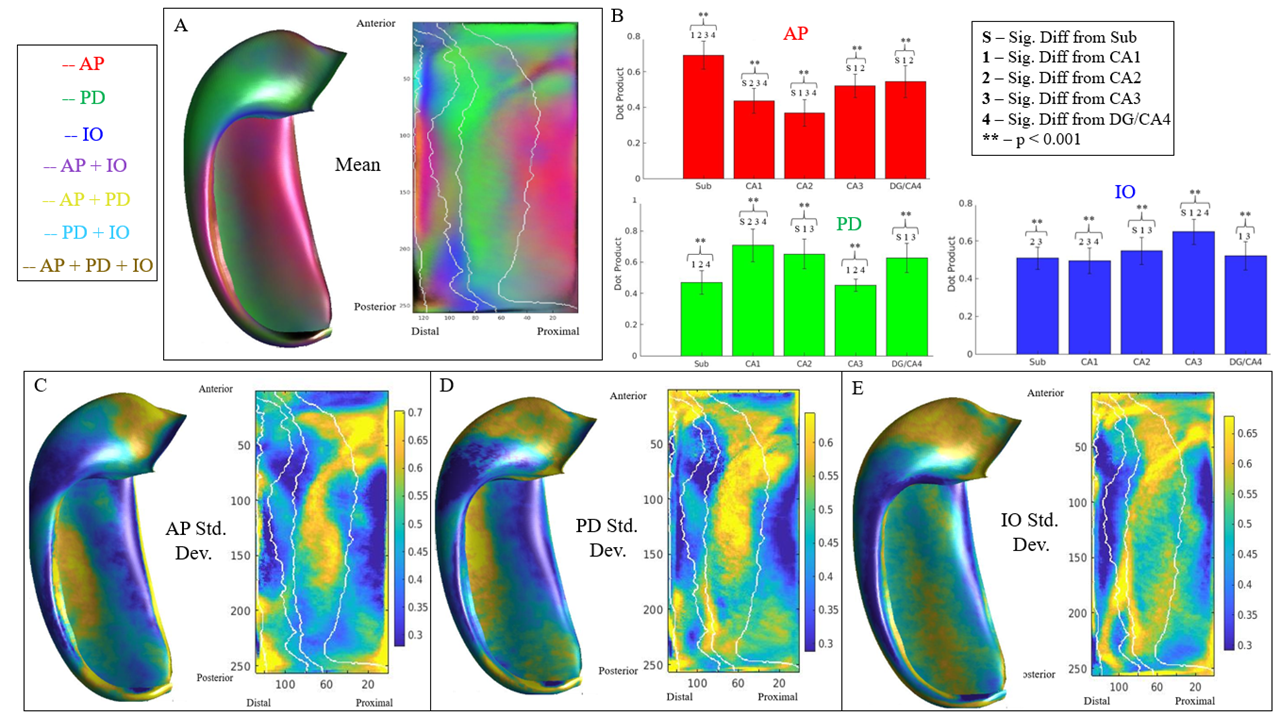
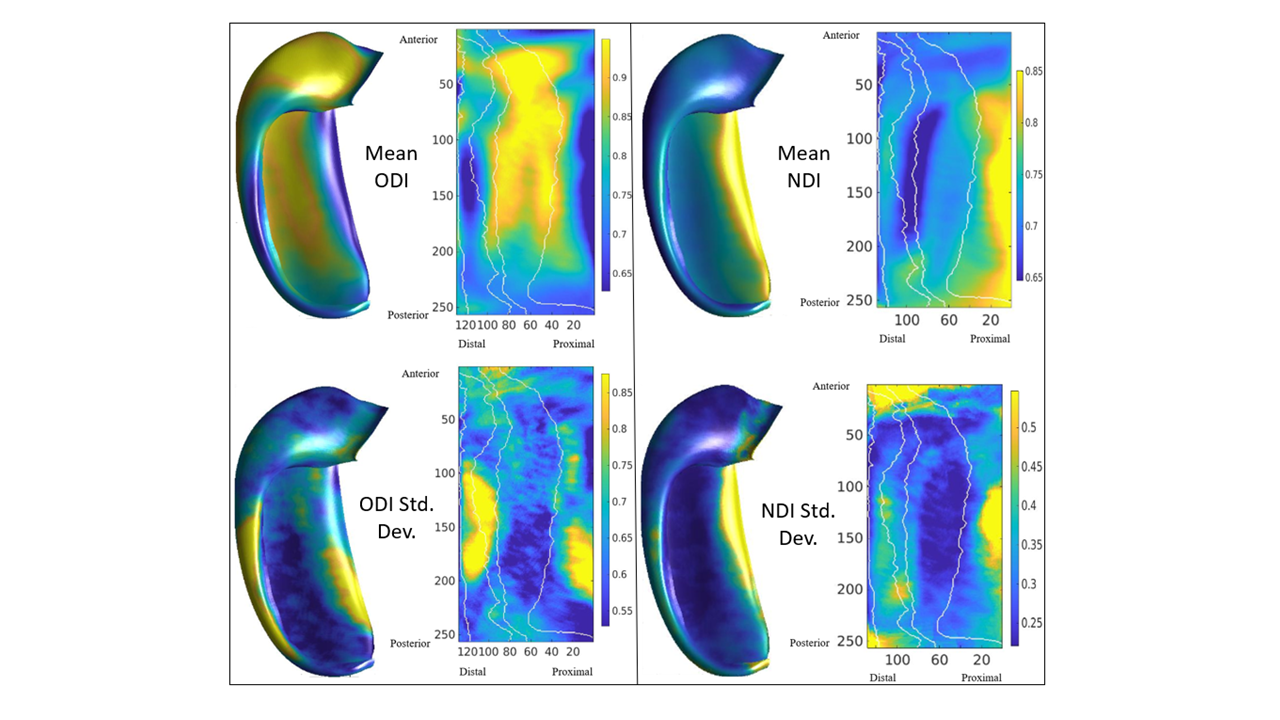
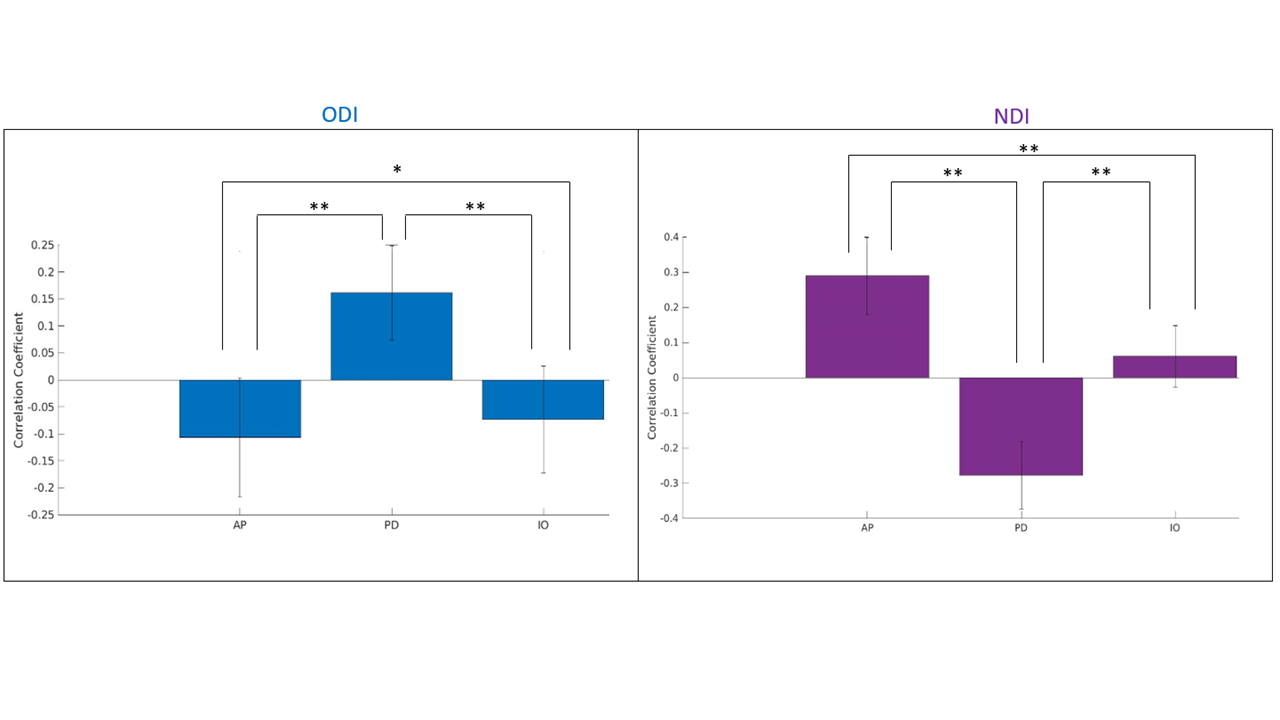
Figure 2 displays the dot products between each gradient direction and NODDI neurite vectors from four hippocampi. Figure 3A presents these dot product correlations averaged across all hippocampi (N = 192), and figure 3B shows bar plots of each gradient directions mean dot product value by subfield. One-way ANOVA and post-hoc Tukey tests indicated significant differences within each gradient direction of mean dot product across the subfields (see figure 3B legend for reference). Figure 3C-E depicts the standard deviation of the dot product based on gradient direction. Figure 4 shows the mean ODI and NDI across all participants, as well as the standard deviation for these measures. Figure 5 depicts the mean correlation coefficient between ODI and dot product and NDI and dot product across each direction. One-way ANOVA and post-hoc Tukey tests indicated significant differences of mean correlation coefficient between gradient directions in both ODI and NDI.Discussion/Conclusion
Here we show that the macrostructural gradients are systematically correlated to local microstructure measured using NODDI. This method may allow for the development of anatomical microstructure priors and potentially increase the accessibility of hippocampal integrity measures. Within each principal gradient direction significant differences were seen between subfields. These differences likely relate to the true variability in neurite orientation between subfields, as well as from white matter bundles piercing the hippocampus. For example, in figure 3A the proximal-distal direction was closely aligned with the neurite orientation provided by NODDI across all participants in CA1. This may be a result of the perforant path coming from the entorhinal cortex and entering CA1 in a proximal-distal direction or, similarly, from Schaffer collaterals entering CA1 from CA3. There are several fibre bundles that likely drive correlations in the anterior-posterior and proximal-distal direction. This might explain why the inner-outer gradient did not have high dot product values in CA1, even though there are pyramidal neurites oriented laminarly2. This may be seen in figure 3C-E, where there were high standard deviations of dot product values in CA1 across each direction, suggesting variability in neurite orientation. Future studies will examine these gradients in high-resolution ex-vivo data where fibre bundles will be more apparent.Acknowledgements
We acknowledge the Human Connectome Project and support from the Canadian Institutes for Health Research and Natural Sciences and Engineering Research Council of Canada.References
1. Moodley K, and Chan D. The Hippocampus in Neurodegenerative Disease. Front Neurol Neurosci. 2014;34:95-108.
2. Anand K, and Dhikav V. Hippocampus in health and disease: An overview. Ann. Indian Acad. Neurol. 2012;15(4):239-246.
3. Lemprière S. Birth of hippocampal neurons declines in Alzheimer disease. Nat. Rev. Neurol. 2019;15(5):245.
4. DeKraker J, Ferko K, Lau J, Köhler S, and Khan A. Unfolding the hippocampus: An intrinsic coordinate system for subfield segmentations and quantitative mapping. NeuroImage. 2018;167:408-418.
5. Van Essen D, Smith S, Barch D, Behrens T, Yacoub E, and Ugurbil K. The WU-Minn Human Connectome Project: An overview. NeuroImage. 2013;80:62-79.
6. Zhang H, Schneider T, Wheeler-Kingshott C, and Alexander D. NODDI: Practical in vivo neurite orientation dispersion and density imaging of the human brain. NeuroImage. 2012;61:1000-1016.
7. Harms R. Microstructure Diffusion Toolbox [Computer software]. https://mdttoolbox.readthedocs.io/en/latest_release/index.html
8. Fisher RA. Statistical methods for research workers (5th ed.). 1938; Edinburgh.
Figures