2022
The influence of spectral registration on diffusion-weighted magnetic resonance spectroscopy ADC estimates.1CUBRIC, Cardiff University, Cardiff, United Kingdom
Synopsis
Spectral registration is a powerful frequency and phase offset correction method. Diffusion-weighted MRS (dMRS) provides a particularly stern challenge for drift correction due to the lower SNR, varying lineshape, and increased gradient-induced frequency drift. Here, simulated data are used to examine spectral registration and its new robust iteration in the context of dMRS. The accuracy of these methods is examined across a broad range of SNR, and the effect they have on ADC estimates, investigated.
Introduction
Magnetic resonance spectroscopy (MRS) is an inherently low signal-to-noise ratio (SNR) technique, necessitating multiple acquisitions to produce sufficient data quality. However, due to heating/cooling of hardware and physiological/bulk motion, transients incur frequency/phase offsets. Without correction, incoherent averaging occurs, broadening the spectrum, distorting the lineshape, and reducing the final SNR. These issues are further exacerbated in diffusion-weighted MRS (dMRS). Here, field gradients encode diffusion-weighting into the MRS experiment, attenuating the metabolite signals. Unlike the water molecules in standard diffusion-weighted imaging, metabolites are predominantly intracellular and some are cell-specific, reducing the need for complex modelling. However, this increased specificity comes at the cost of sensitivity, with SNR hampered by diffusion-weighting, and large gradient amplitudes inducing further frequency drift [1].Several processing approaches have been suggested to mitigate frequency and phase errors, including referencing to peaks like Creatine [2] or residual-water [3], alignment by correlation [4], and the widely adopted spectral registration (SR) method [5], which fits transients to a reference spectrum, adjusting the individual frequency and phase terms. A more recent iteration of the SR algorithm – robust spectral registration (RSR) [6] includes automated lipid and residual-water removal to improve corrections for unstable data, and performs SR to a weighted average spectrum in a statistically optimised order.
In the SR and RSR papers, the influence of SNR is considered, with both methods exhibiting a performance noise floor. When these methods are applied to dMRS, there are inherent SNR/lineshape variations across b-values, and the effect this might have on diffusion estimates has not been investigated. This work applies SR and RSR to a simulated dataset with known frequency/phase offsets, and the effect of SNR on apparent diffusion coefficient (ADC) estimates is investigated.
Methods
MR spectra were simulated using a density matrix formalism in FID-A [7]. MRS acquisition parameters were chosen to mirror previous work [8]: a DW-PRESS sequence, TR = 2500ms, TE = 74ms, 24 averages, 2KHz bandwidth, 2048 points, and 5Hz line broadening was added. The 24 simulated metabolites were then appropriately scaled by relative in-vivo concentration, and the metabolite diffusion properties modelled using a mono-exponential decay:$$S(b) = S_0 e^{-D_{1} b},$$
where: $$$D_{1}$$$ is the ADC, $$$S_0$$$ is 1 for the simulated data, and b are the b-values: 0, 557, 2260, 5107, 9099, 14237, 19837 s/mm2. Gaussian noise was then added to create a dataset of 100 dMRS experiments with b=0 SNR varying between 0.03 to 3000, sampled logarithmically. Frequency and phase errors were modelled in a similar manner to the original SR paper, with a total drift of 5Hz and -1 degrees, respectively, and random noise with standard deviations of 0.2Hz and 6 degrees, respectively.
Frequency and phase errors of the simulated transients were then quantified using RSR and SR. Additionally, the effect of direct averaging (DA) was investigated, whereby each transient was averaged to its nearest neighbour in a pairwise fashion prior to correction. This has been suggested [9] as a means to extend the performance of correction methods to lower SNR data. Each recombined spectra was then quantified using Tarquin [10], and the fitted peaks used to estimate the mono-exponential decay of TNAA, Tcho, and MyI. The estimates of frequency, phase and ADC were then compared to the known ground truth, across the range of SNR .
Results & Discussion
Fig.1 and Fig.2 show the frequency and phase correction fidelities, respectively. Where the fidelity, Q, of parameter P is given by:$$Q = 1- \sqrt{\sum \frac{(P_{fit} - P_{known})^2}{P_{known}^2}},$$
where: $$$P_{known}$$$ is the simulated frequency/phase offset, and $$$P_{fit}$$$ is the estimate of the correction algorithm. While both methods performed well over similar SNR ranges, RSR appears to be less accurate than SR for high b-value spectra. This could impact diffusion fits, with higher b-values more greatly affected by incoherent averaging. DA does offer some benefit to frequency correction of low SNR data, providing a minor extension to the effective SNR range of both approaches. However, this effect is minor, and the detrimental impact DA has to phase correction suggests it might not be beneficial, at least for the frequency/phase offsets considered here.
Fig.4 shows the distribution of the fitted ADC values as a percentage difference from the known ground truth. I.e.:
$$D1_{\%Diff} = \frac{D1_{Fit} - D1_{known}}{D1_{known}} *100.$$
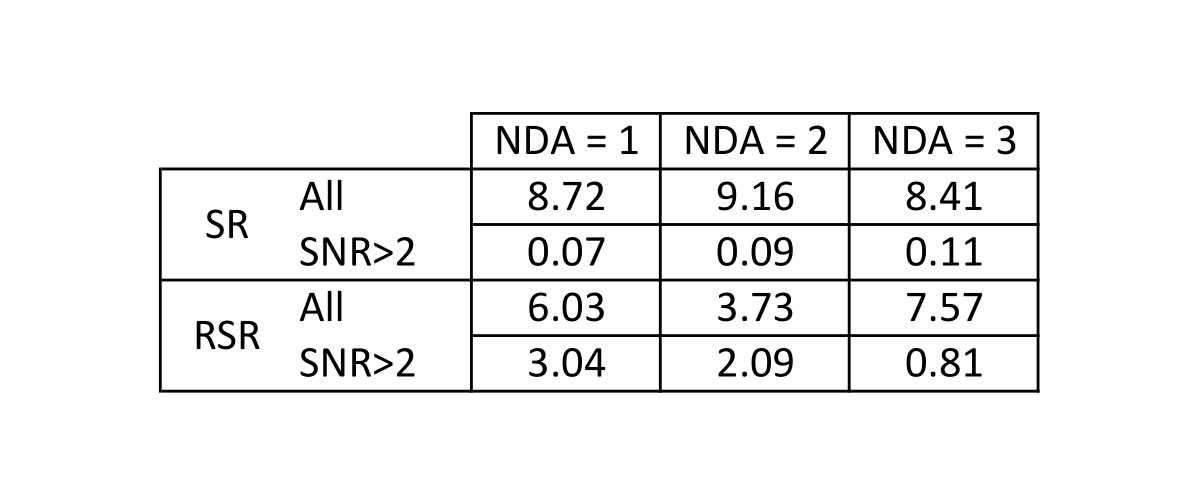
While both approaches lead to overestimation of the ADC, the bias appears worse for RSR. This is attributed to higher frequency/phase errors for larger b-values, artificially attenuating the signal. This effect is mitigated by excluding points based on the SNR of the averaged spectrum. A threshold of 2 was established as most effective for this dataset. Table.1 shows the skewness of the ADC distributions for both methods, with and without SNR filtering. While SR and RSR are similarly skewed before SNR filtering, afterwards, SR is an order of magnitude better than RSR, suggesting this as the preferred method for dMRS.
Conclusions
While RSR improves on the previous iteration's robustness to in-vivo acquisition instabilities, a bias could be introduced for lower SNR dMRS data. If experimental instabilities can be sufficiently screened, SR appears to be the preferable method for dMRS pre-processing. While direct averaging appears to have little effect on ADC estimates, SNR-based filtering is essential to avoid overestimation of ADCs.Acknowledgements
This work was supported by a Wellcome Trust Strategic Award (104943/Z/14/Z).References
[1] Rowland, B.C., Liao, H., Adan, F., Mariano, L., Irvine, J. and Lin, A.P., 2017. Correcting for frequency drift in clinical brain MR spectroscopy. Journal of Neuroimaging, 27(1), pp.23-28.
[2] Evans, C.J., Puts, N.A., Robson, S.E., Boy, F., McGonigle, D.J., Sumner, P., Singh, K.D. and Edden, R.A., 2013. Subtraction artifacts and frequency (Mis‐) alignment in J‐difference GABA editing. Journal of Magnetic Resonance Imaging, 38(4), pp.970-975.
[3] Helms, G. and Piringer, A., 2001. Restoration of motion‐related signal loss and line‐shape deterioration of proton MR spectra using the residual water as intrinsic reference. Magnetic Resonance in Medicine: An Official Journal of the International Society for Magnetic Resonance in Medicine, 46(2), pp.395-400.
[4] Wiegers, E.C., Philips, B.W., Heerschap, A. and van der Graaf, M., 2017. Automatic frequency and phase alignment of in vivo J-difference-edited MR spectra by frequency domain correlation. Magnetic Resonance Materials in Physics, Biology and Medicine, 30(6), pp.537-544.
[5] Near, J., Edden, R., Evans, C.J., Paquin, R., Harris, A. and Jezzard, P., 2015. Frequency and phase drift correction of magnetic resonance spectroscopy data by spectral registration in the time domain. Magnetic Resonance in Medicine, 73(1), pp.44-50.
[6] Mikkelsen, M., Tapper, S., Near, J., Mostofsky, S.H., Puts, N.A. and Edden, R.A., 2020. Correcting frequency and phase offsets in MRS data using robust spectral registration. NMR in Biomedicine, 33(10), p.e4368.
[7] Simpson, R., Devenyi, G.A., Jezzard, P., Hennessy, T.J. and Near, J., 2017. Advanced processing and simulation of MRS data using the FID appliance (FID‐A)—an open source, MATLAB‐based toolkit. Magnetic resonance in medicine, 77(1), pp.23-33.
[8] Jenkins, C., Kleban, E., Mueller, L., Evans, J., Rudrapatna, U., Jones, D., Branzoli, F., Ronen, I. and Tax, C.M., Practical considerations of DW-MRS with ultra-strong diffusion gradients.
[9] Near, Jamie, Ashley D. Harris, Christoph Juchem, Roland Kreis, Małgorzata Marjańska, Gülin Öz, Johannes Slotboom, Martin Wilson, and Charles Gasparovic. "Preprocessing, analysis and quantification in single‐voxel magnetic resonance spectroscopy: experts' consensus recommendations." NMR in Biomedicine (2020): e4257.
[10] Wilson, M., Reynolds, G., Kauppinen, R.A., Arvanitis, T.N. and Peet, A.C., 2011. A constrained least‐squares approach to the automated quantitation of in vivo 1H magnetic resonance spectroscopy data. Magnetic resonance in medicine, 65(1), pp.1-12.
Figures
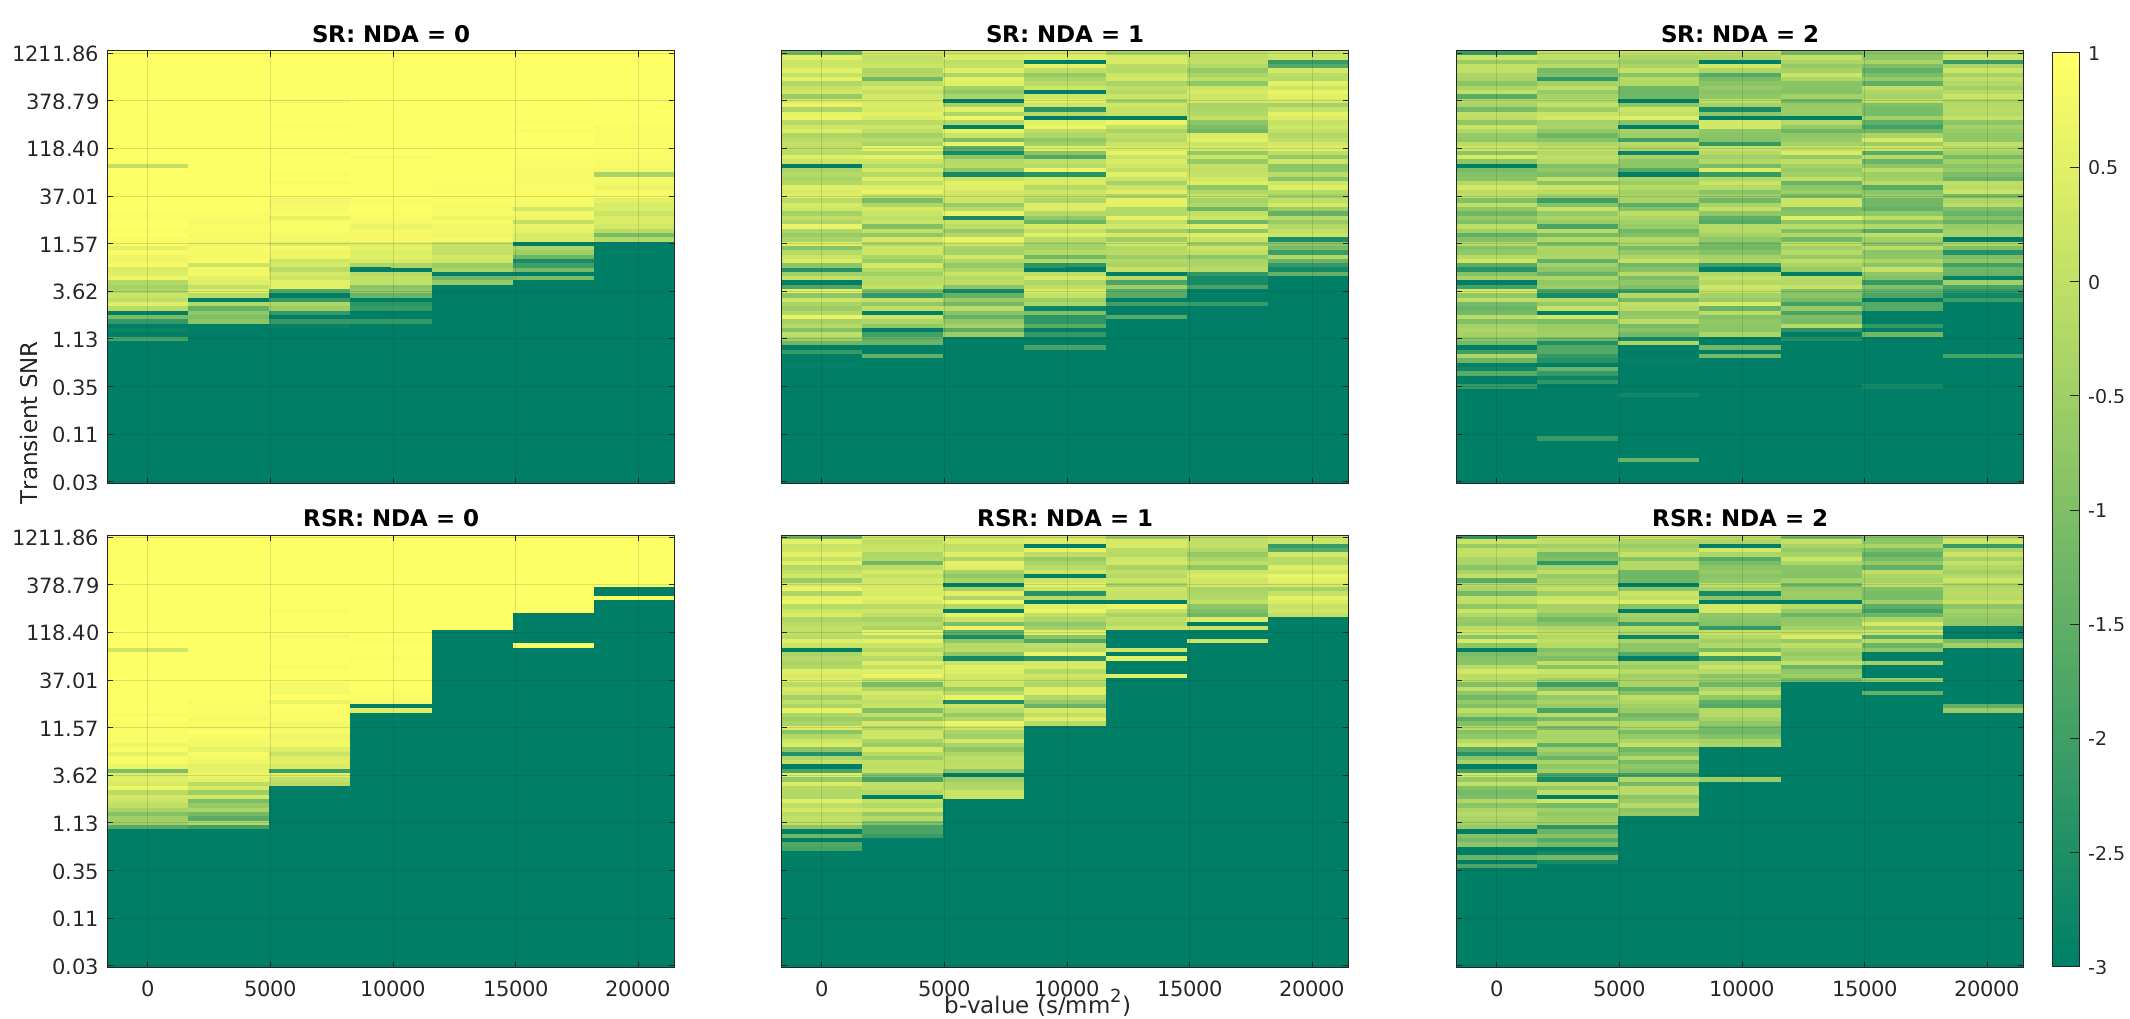
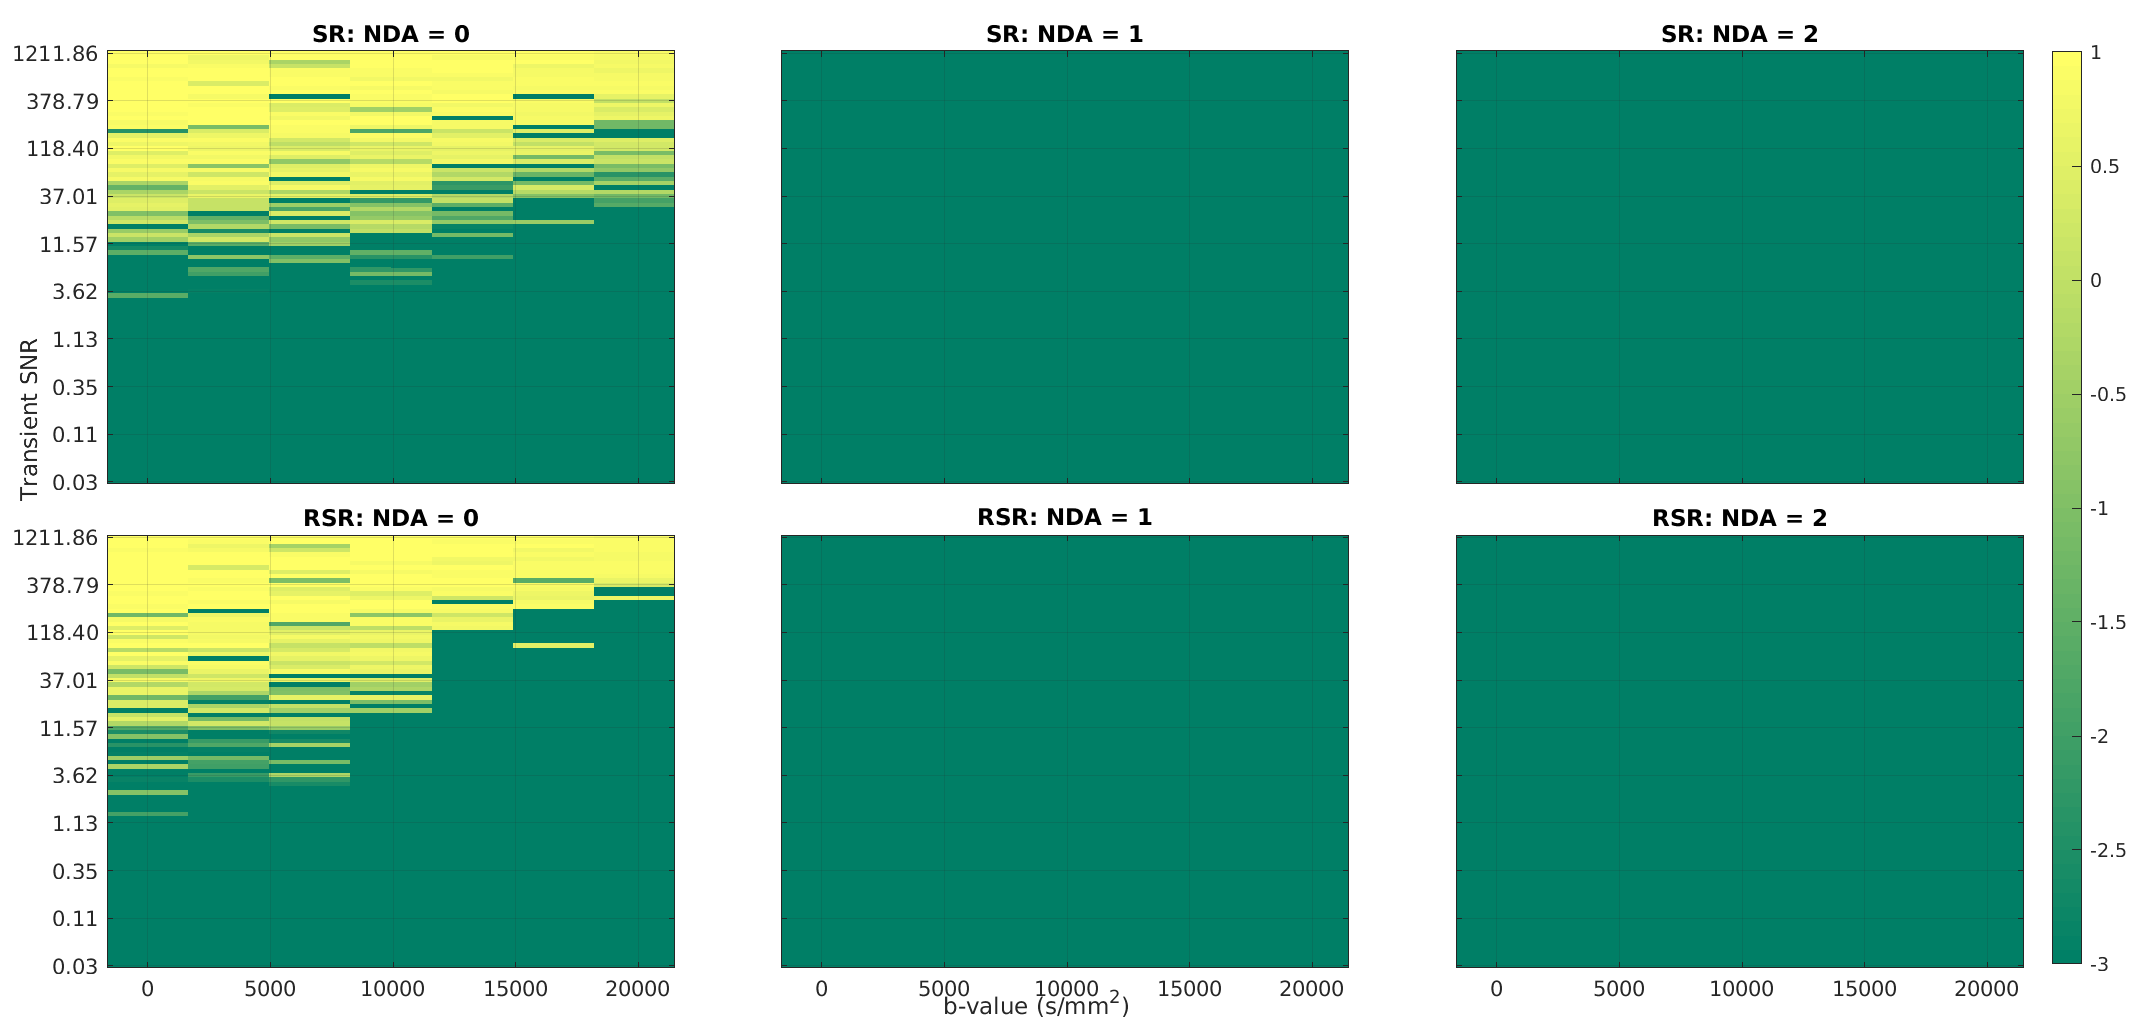
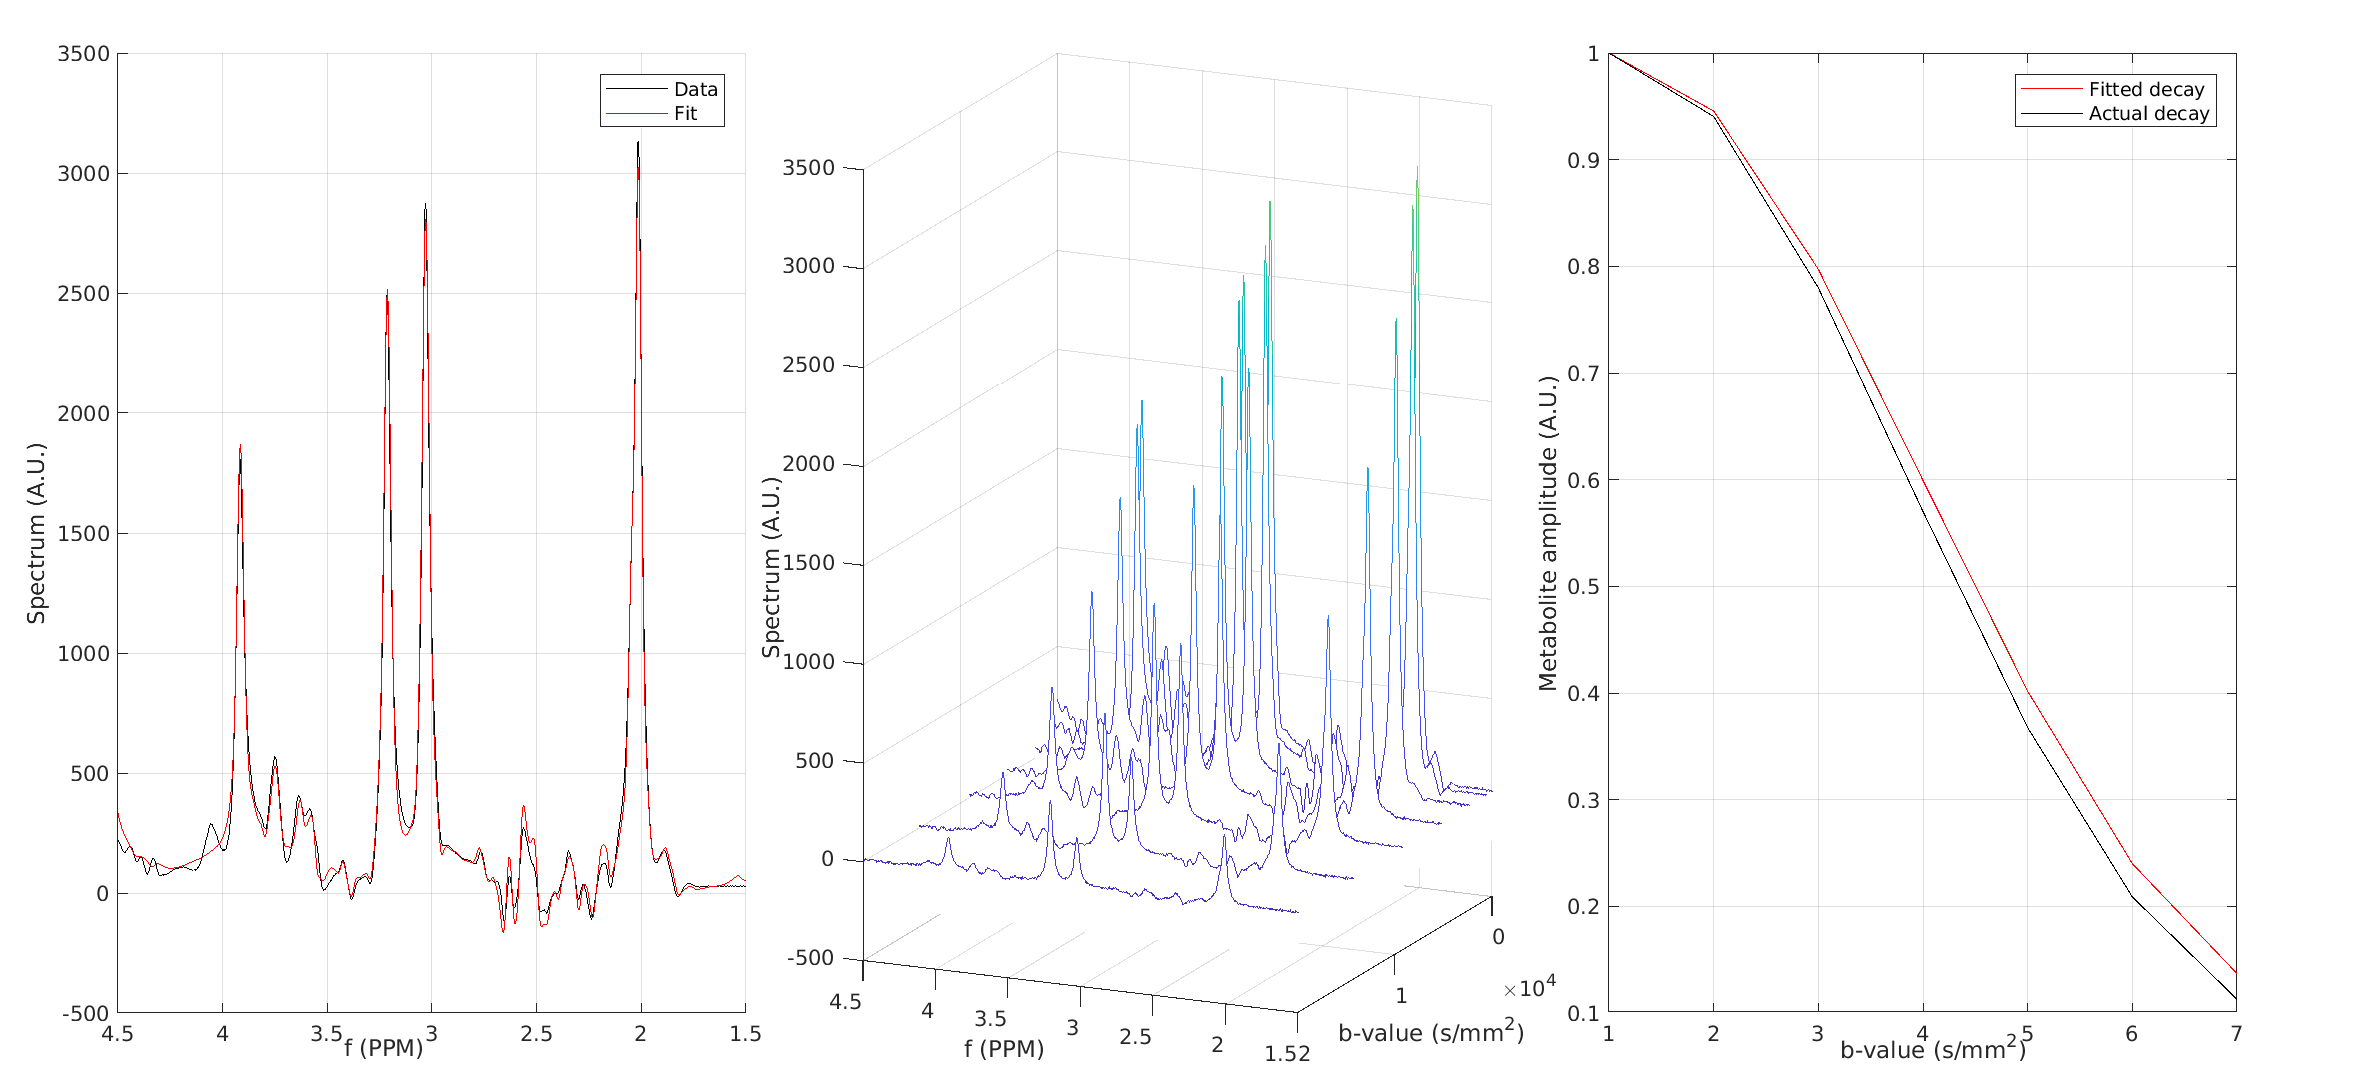
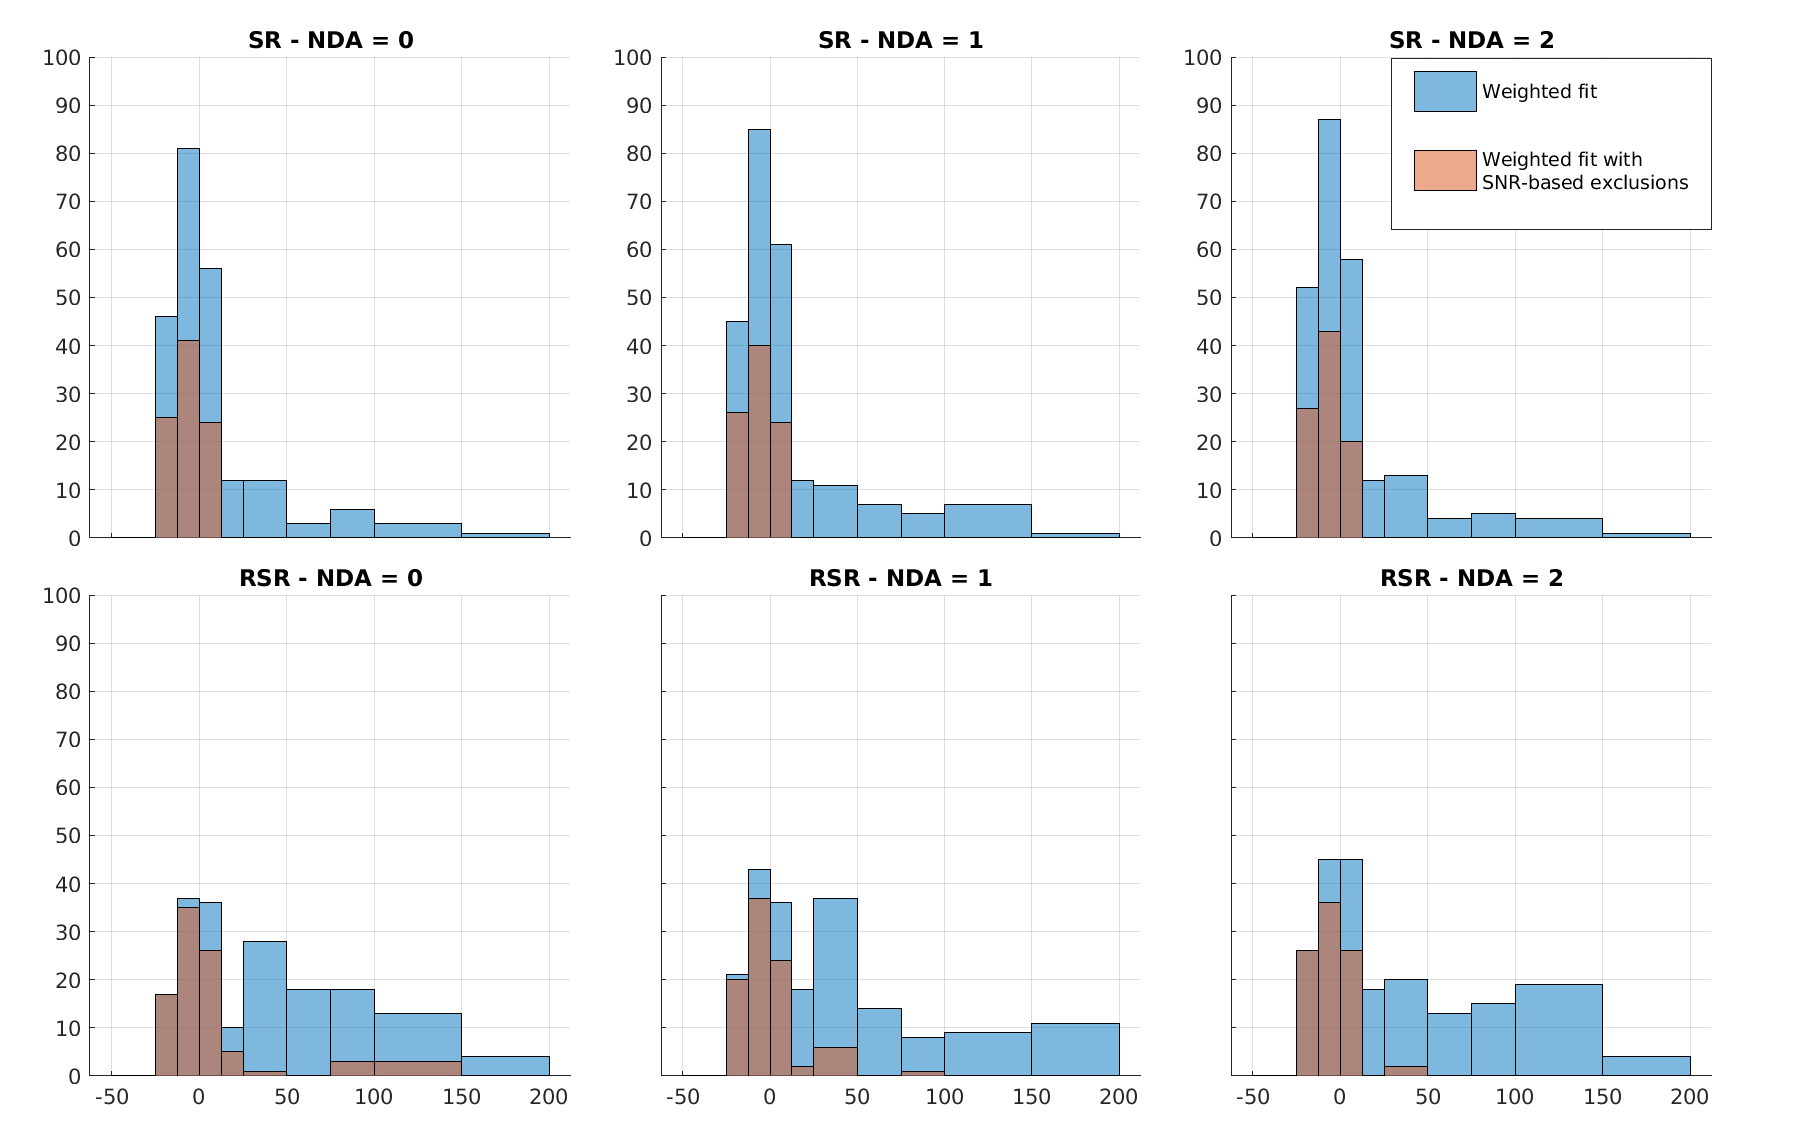
Fig.4: Histograms of the percentage deviation from known the ADC. Data are pooled from the fits of TNAA, TCho, and MyI, and diffusion fits with $$$R^2$$$<0.75 were excluded. The blue bars represent fits of all data, while orange bars are data fit after excluding points with SNR < 2. Here a negative value indicates an underestimation of the ADC, while a positive value indicates overestimation. All methods tended to overestimation, suggesting that higher b-values were disproportionately affected by incoherent averaging. However, filtering based on SNR remedies this to an extent.