2020
In vivo Cerebellum MRSI reconstruction by domain-transform manifold learning1Department of Radiology, A.A Martinos Center for Biomedical Imaging / MGH, Charlestown, MA, United States, 2Harvard Medical School, Boston, MA, United States, 3Department of Physics, Harvard University, Cambridge, MA, United States, 4Sir Peter Mansfield Imaging Centre, School of Physics and Astronomy, University of Nottingham, Nottingham, United Kingdom, 5Radiology, A.A Martinos Center for Biomedical Imaging / MGH, Charlestown, MA, United States, 6School of Health Sciences, Purdue University, West Lafayette, IN, United States, 7Weldon School of Biomedical Engineering, Purdue University, West Lafayette, IN, United States
Synopsis
The recent advances of machine learning in MRSI have mainly been focused on predicting metabolite concentrations and denoising the metabolite-only spectra. Here, we present a deep neural network based on the AUTOMAP formalism to reconstruct metabolic cycle FIDs into the spectral domain. A density matrix formalism was used to generate up/down fields of 1H FIDs of 27 metabolites. B0 inhomogeneity was also included in the simulations. Non water-suppressed up/down field FIDs were fed to the trained network and the proposed reconstruction strategy was validated on simulated FIDs at different noise levels and on an in vivo cerebellum dataset at 3T.
Introduction
Magnetic Resonance Spectroscopic Imaging (MRSI) is a powerful imaging tool for spatially probing the complex biomolecular content in living tissues. However, this technique has limited temporal/spatial resolution and SNR tradeoffs. The success of deep neural network-based MRS approaches have created new ways to improve those tradeoffs by learning complex functional mapping and non-linear features extraction from high dimensional data1-4. Recently a noise-robust image reconstruction approach based on a data-driven learning of the low-dimensional manifold representations of real-world data was described using a deep neural network (NN) architecture known as AUTOMAP5. Here we describe the use of a similar formalism (Figure 1) to learn the entire inverse function that maps the noisy metabolic cycle FID signals to the spectral domain. This approach was validated on simulated data containing different metabolites as well as on an in vivo cerebellum dataset acquired on a 3T clinical scanner.Materials and Methods
Training set: Based on a density matrix formalism6, 27 different metabolites FIDs were simulated using a semi-LASER pulse sequence with metabolic cycling with a TE of 32 ms (as described in Figure 1). The simulated FIDs also included varying linewidths (ranged from 6 Hz – 20 Hz) representing variation in magnetic field homogeneity. The simulated metabolites’ FIDs were then combined randomly, and water signal was added. To augment the training set, variations in metabolite- and water- peak amplitudes were included in the training set. Phase modulation and 20-50 dB of additive white gaussian noise were added to the final FID. To produce the corresponding spectra for training, each metabolic cycle FID was Fourier transformed with MATLAB’s native 1D FFT function. 204000 FIDs/spectra with metabolic cycling and 512 time points were generated.Architecture of NN: The NN was trained to learn an optimal feed-forward reconstruction of time domain of both metabolic cycles into the spectral domain. The real and the imaginary part of datasets were trained together. The network, described in Figure 1, was composed of 2 fully connected layers (input layer and 1 hidden layer) of dimension 2048×1 and 8192x1 respectively and activated by the hyperbolic tangent function. The 3rd layer was reshaped to 2048x1 for convolutional processing. Two convolutional layers, C1 and C2 convolved 128 filters of 3×3 with stride 1 followed by a rectifier nonlinearity. The final output layer deconvolves the C2 layer with 128 filters of 3×3 with stride 1. The output layer resulted into the reconstructed real and imaginary component of the spectra. For the training experiment, the hyperparameters were as follows: number of epochs = 200, mini batch size = 300 and the learning rate = 5e-6. The loss function and the L1 norm penalty applied on the convolutional layer during training were kept the same as described in the previous work5.
Data Acquisition & Reconstruction: The in vivo data were acquired using Siemens Prisma 3T MR system (Siemens, Germany) with 64-channel head array receive coil. The zoom Metabolite-cycling 2D-MRSI was acquired in the cerebellum using the same parameters in 4.5 minutes as described in ref 7. Briefly, before the semi-LASER localization, 2 asymmetric inversion RF pulses in alternating TRs were used for downfield/upfield measurements. The very-high in-plane resolution (2.5mm x 2.5 mm) with a thickness 10mm was achieved using reduced FOV =120 mm x 120 mm x 10 mm, semi-LASER localization = 100-90 mm x 50-40 mm x 10 mm, TR=1500 ms and TE = 32 ms. A 2D-density weighted concentric ring trajectory design was used for encoding7. Post processing MATLAB (MathWorks, Natick, MA, USA) was used for NUFFT reconstruction algorithms. After coil combination, the FIDs were fed to the trained network and the spectra of each voxel were compared to the conventional FFT reconstruction.
Data Analysis: The metabolite spectra were obtained via subtracting the upfield and downfield. The remaining water signal in the metabolite spectrum was removed using the Hankel-Lanczos singular value decomposition.
Results
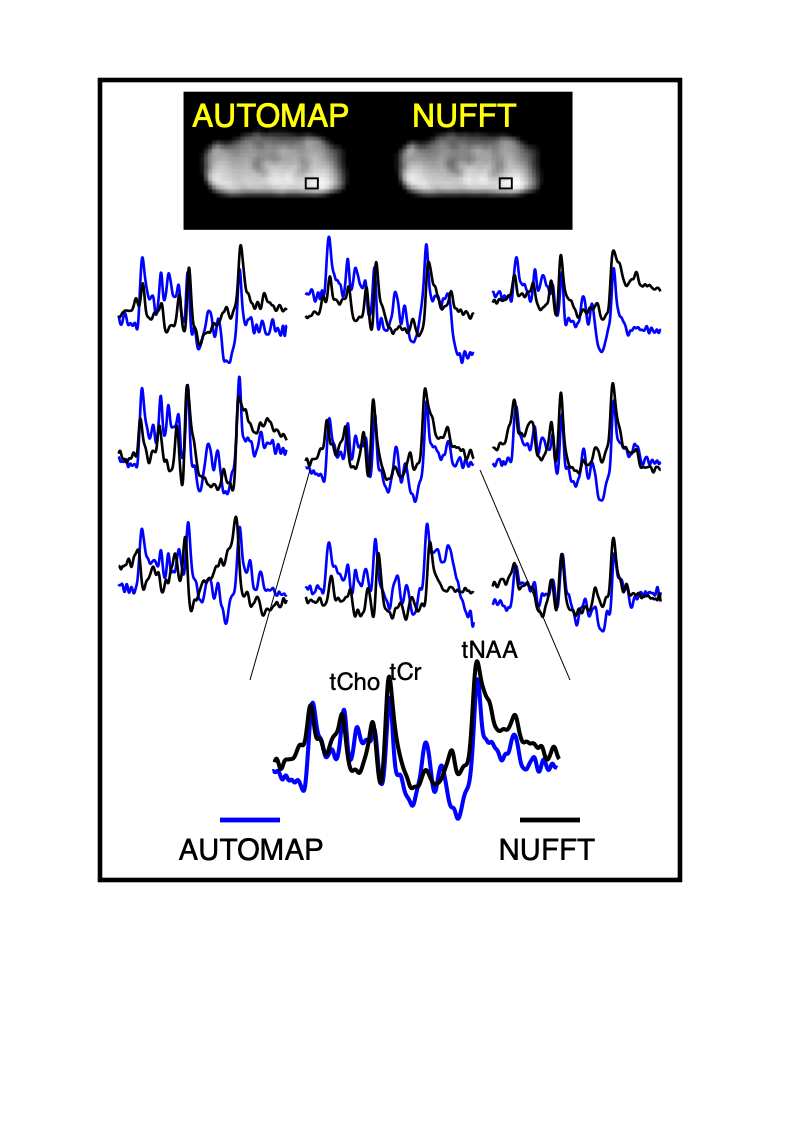
Figure 2 shows the noise robustness of the proposed method. A simulated FID containing 3 metabolites was generated and a range of white gaussian noise (25–50dB) was added and reconstructed with the trained network. Metabolite peaks (NAA, Choline and Creatine) were detectable even with 25dB of added white gaussian noise. This trained model was then used to reconstruct in vivo spectroscopic data of the cerebellum. The results are shown in Figure 3. The metabolite-only spectra reconstructed by AUTOMAP (in blue) align with that reconstruct with NUFFT (in black). The major metabolite peaks (NAA, Choline and Creatine) were correctly predicted by the trained neural network.Discussion and Conclusion
This work presents the preliminary results of MRSI reconstruction using a noise-robust deep learning framework. The learned network is able to extract the low dimensional features of the spectroscopy data. As future work, systems imperfections and more spectral features should be taken into account, in order to be more adaptive to experimental variations. Further network architecture optimizations need to be tested to validate the accuracy of the reconstruction.Acknowledgements
No acknowledgement found.References
1. N. Hatami, M. Sdika, and H. Ratiney, “Magnetic resonance spectroscopy quantification using deep learning,” 2018, arXiv:1806.07237. [Online].Available: https://arxiv.org/abs/1806.07237
2. S. P. Kyathanahally, A. Döringg, and R. Kreis, “Deep learning approaches for detection and removal of ghosting artifacts in MR spectroscopy,”Magn. Reson. Med., vol. 80, pp. 851–863, Sep. 2018
3. H. H. Lee and H. Kim, “Intact metabolite spectrum mining by deep learning in proton magnetic resonance spectroscopy of the brain,”Magn.Reson. Med., vol. 82, pp. 33–48, Jul. 2019.
4. F. Lam, Y. Li and X. Peng, "Constrained Magnetic Resonance Spectroscopic Imaging by Learning Nonlinear Low-Dimensional Models," in IEEE Transactions on Medical Imaging, vol. 39, no. 3, pp. 545-555, March 2020, doi: 10.1109/TMI.2019.2930586.
5. B. Zhu and J. Z. Liu and S. F. Cauley and B. R. Rosen and M. S. Rosen, “Image reconstruction by domain transform manifold learning”, Nature 555 487 EP - (2018)
6. Berrington A, Voets NL, Plaha P, Larkin SJ, Mccullagh J, Stacey R, Yildirim M, Schofield CJ, Jezzard P, Cadoux-Hudson T, Ansorge O, Emir UE. “Improved localisation for 2-hydroxyglutarate detection at 3T using long-TE semi-LASER. Tomography”. 2016 Jun;2(2):94-105. doi: 10.18383/j.tom.2016.00139. PMID: 27547821; PMCID: PMC4990123.
7. Emir, UE, Sood, J, Chiew, M, Thomas, MA, Lane, SP. “High‐resolution metabolic mapping of the cerebellum using 2D zoom magnetic resonance spectroscopic imaging”. Magn Reson Med. 2020; 00: 1– 10. https://doi-org.ezp-prod1.hul.harvard.edu/10.1002/mrm.28614
Figures