2017
Deep Learning Using Synthetic Data for Signal Denoising and Spectral Fitting in Deuterium Metabolic Imaging
Abidemi Adebayo1, Keshav Datta2, Ronald Watkins2, Shie-Chau Liu2, Ralph Hurd2, and Daniel Mark Spielman2
1Mechanical Engineering, Stanford University, Stanford, CA, United States, 2Radiology, Stanford University, Stanford, CA, United States
1Mechanical Engineering, Stanford University, Stanford, CA, United States, 2Radiology, Stanford University, Stanford, CA, United States
Synopsis
Deuterium metabolic imaging, a promising tool to probe in vivo glucose metabolism, is severely limited by SNR due to the low gyromagnetic ratio of 2H and the low concentration of metabolites. Recent advances in machine learning techniques to reduce noise is a promising option but obtaining training datasets with good SNR requires prohibitively long scan times. In this work we show that an autoencoder network trained using only synthetic data can reduce noise and provide a good spectral fit for in vivo 3T spectra obtained from human brain after ingestion of deuterated glucose.
Introduction
Recently, the feasibility of using conventional 2H MRSI of deuterated glucose to measure both glycolysis and oxidative phosphorylation has been successfully demonstrated with deuterium metabolic imaging1(DMI). However, low SNR and consequently long scan times pose major limitations for further exploration. With many successes in the application of machine learning to different fields, in this work, we seek to use deep learning (DL) to improve the SNR of 2H signal at 3T and consequently reduce the scan time. Using synthetic data generated from an analytical model for the metabolites, we show that an autoencoder architecture2 is able to significantly reduce noise from in vivo spectra, resulting in a good spectral fit.Methods
Synthetic data generation and deep learning modelA four-metabolite signal model given in Eq. 1, representing deuterated-water (HDO), glucose (Glc), glutamate (Glx) and lactate (Lac), the typical metabolites detected using 2H spectroscopy in the brain after glucose infusion, was used for simulating the complex signal from free-induction decay.
$$y(t) = (\sum_{i=1}^4A_i e^{-j2\pi f_{i}t}e^{-t/T_{2,i}})\frac{1}{\sigma \sqrt{2\pi}}e^{-\frac{t^{2}}{2\sigma^{2}}}+ n(t) \;\;\;\;\;\;\;\;\;\;\;\;\;\;\;\;\;\;\;\;\;\; [1] $$
With fixed relative frequencies of the metabolites (fHDO = 0 Hz, fGlc = 14 Hz, fGlx = 45 Hz, fLac = 64 Hz), the amplitudes, Ai, were varied randomly between 0 to 1, and the transverse relaxation times, T2,i, between 50 ms and 1000 ms, to generate a wide range of synthetic data for training the deep learning model. A random-width Gaussian, represented by the parameter σ, varied uniformly between 0.001 and 30, was used to model the peak broadening due to B0 variations, and a zero-mean Gaussian distribution, $$$n(t)\sim{N(0,\sigma_n^2)}$$$ was added as noise. After zero padding by a factor of 2, and fast-Fourier transformation, the real part of the spectrum was used for training an autoencoder network (Fig 1) using 60,000 samples (85% training, 10% validation, 5% testing). Inputs were normalized to unit norm and mean squared error was used as the loss function.
In vivo experiment and spectral fit
In vivo spectra were collected from the brain of a male volunteer after orally administering 2H-labeled glucose (60 grams of [6,6’-2H2]Glc, Cambridge Isotope Laboratories, Inc, dissolved in 500 mL drinking water) using a custom built transmit/receive birdcage head coil (275 mm diameter, and 275 mm length) in a clinical 3T PET/MR scanner (GE Medical Systems). After manually calibrating the transmitter and receiver gains using a deuterated water phantom, a non-selective hard pulse (width, 500 μs, flip angle, 900) was used for excitation, and free-induction-decay signal was collected starting 455 μs over a bandwidth of 1000 Hz using 256 points, with repetition time, TR = 350 ms. A line broadening of 1.5 Hz was applied, the time domain signal was zero padded by a factor of 4, and a fast-Fourier transform was performed to obtain the spectrum. Real part of this spectrum, after phase correction, was used as the input for the trained neural network for denoising and spectral fitting.
Results
The noise from the synthetic data for three different noise levels (Fig 2, left column), is reduced by the trained autoencoder network as seen in the fit between noiseless original and the recovered spectra (Fig 2, right column), and confirmed by the errors quantified in Table 1. Similar trend is seen for the noisy in vivo spectra, Fig 3, collected 15 min, 45 min., 75 min. and 105 min. post glucose administration.Discussion
The reconstruction of low-noise in vivo spectra from deep learning models trained using a completely synthetic dataset, is a key step towards improving the SNR and shortening the scan times in deuterium metabolic imaging, without the need to acquire in vivo datasets from long scans. The nine parameters included in the training (the relative amplitudes of the metabolites, the relaxation time constants, and the Gaussian for B0 inhomogeneity) seem to adequately model the noisy in vivo data. It was observed that inclusion of T2 as a training parameter learned from the synthetic dataset, significantly improved the model fit with the in vivo data.Conclusion
We show that an autoencoder network trained using only a synthetic dataset is able to substantially reduce noise from in vivo 2H spectra acquired from the human brain. The improved SNR provides opportunities to speed up deuterium metabolic imaging using deep learning models without the need to acquire in vivo data from long scans.Acknowledgements
NIH grant P41EB015891 and Richard M. Lucas Center for Imaging.References
- De Feyter HM, Behar KL, Corbin ZA, Fulbright RK, Brown PB, McIntyre S, Nixon TW, Rothman DL, de Graaf RA. Deuterium metabolic imaging (DMI) for MRI-based 3D mapping of metabolism in vivo. Sci Adv. 2018;4(8):eaat7314. Epub 2018/08/25. doi: 10.1126/sciadv.aat7314. PubMed PMID: 30140744; PMCID: PMC6105304.
- Gondara, Lovedeep (December 2016). "Medical Image Denoising Using Convolutional Denoising Autoencoders". 2016 IEEE 16th International Conference on Data Mining Workshops (ICDMW). Barcelona, Spain: IEEE: 241–246.
Figures
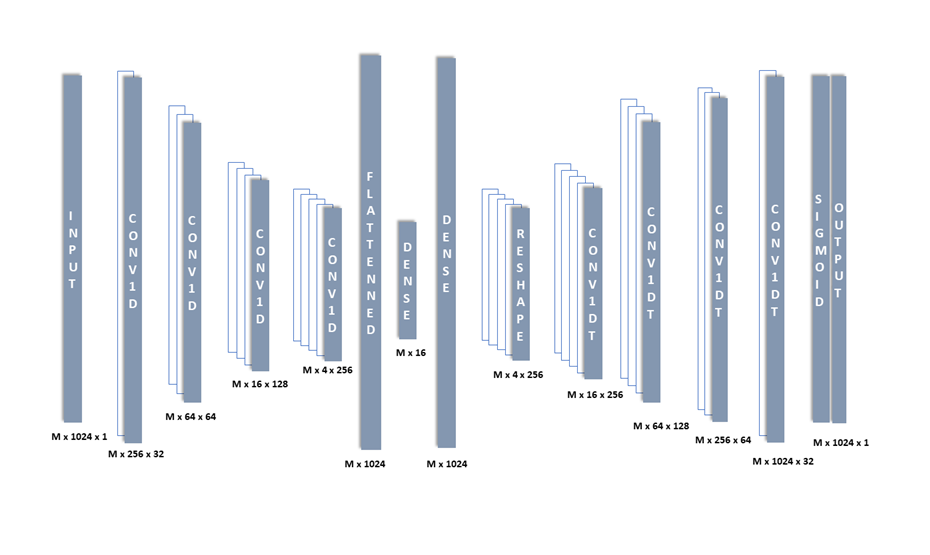
Figure 1 Autoencoder architecture used for denoising and fitting the spectrum.
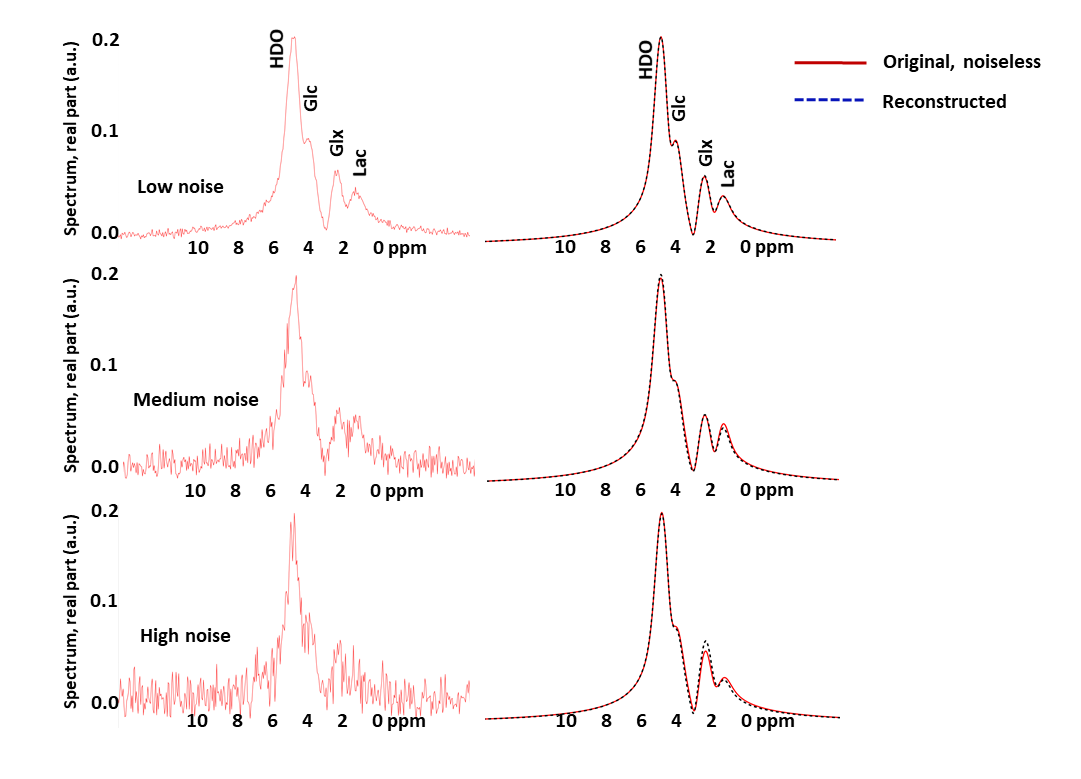
Figure 2 Simulated spectra
with low, medium and high noise levels, left column, and the reconstructed
spectra from the autoencoder network compared to the original noiseless
spectra, right column, demonstrate the effectiveness of noise reduction.
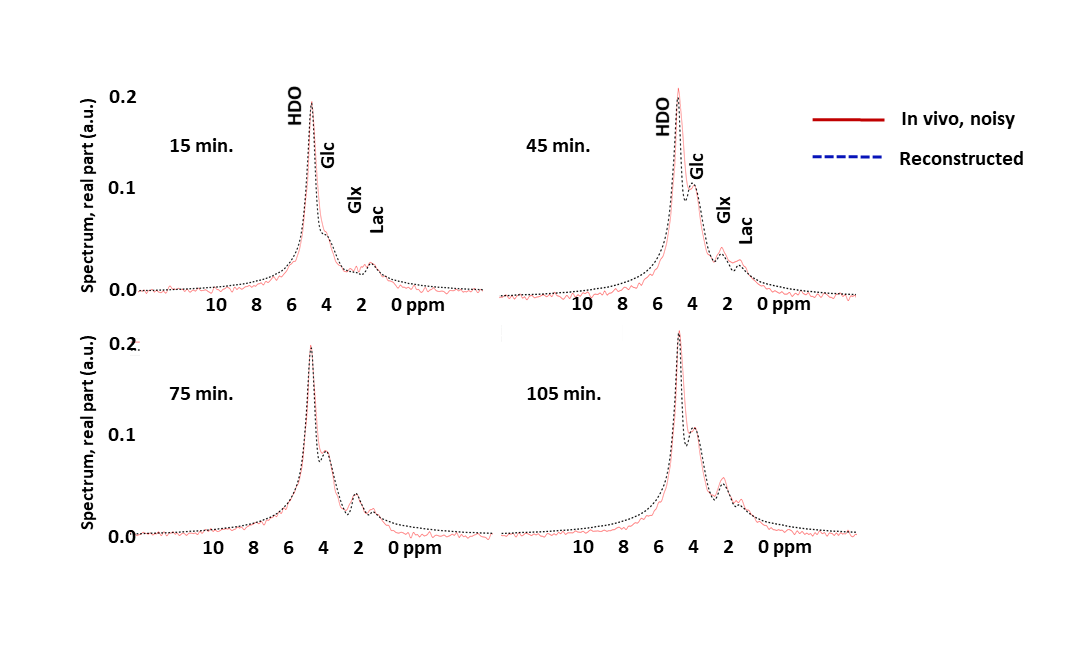
Figure 3 Reconstructed spectra from the neural network (dotted blue lines),
compared with the spectra from human brain obtained 15, 45, 75 and 105 minutes
post oral ingestion of deuterated glucose (solid red lines).
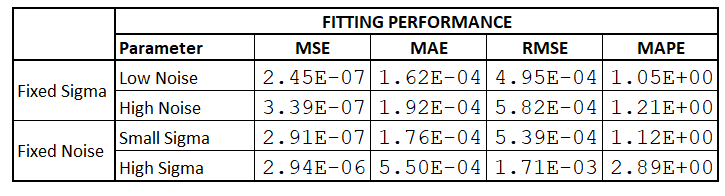
Table 1 Mean square error (MSE), mean absolute error (MAE), root mean squared
error (RMSE) and mean absolute percentage error (MAPE) for synthetic test data
set obtained by varying the noise for a fixed sigma (top rows) and vice versa
(bottom rows), demonstrate good fit of the reconstruction from the autoencoder
network.