2014
Bayesian deep learning-based 1H-MRS of the brain: Metabolite quantification with uncertainty estimation using Monte Carlo dropout1Department of Biomedical Sciences, Seoul National University, Seoul, Korea, Republic of, 2Department of Radiology, Seoul National University Hospital, Seoul, Korea, Republic of
Synopsis
Recently, deep learning showed its potential in the quantification of metabolites from 1H-MRS brain spectra. However, previously used standard convolutional neural networks (CNNs) do not provide measurement uncertainty. We investigated the Bayesian CNNs (BCNNs) with Monte Carlo dropout sampling for metabolite quantification with simultaneous uncertainty estimation. The high correlations between the ground truth errors and the BCNN-predicted uncertainty for the majority of the metabolites found in this study may support the potential application of the proposed method in deep learning-based 1H-MRS of the brain for metabolite quantification with simultaneous uncertainty estimation.
INTRODUCTION
The deep learning-based quantitative analysis of 1H-MRS brain spectra(DL-MRS) has been reported as a potential alternative to the nonlinear-least-squares-fitting(NLSF) approach.1-3 However, the previous studies used standard convolutional neural networks(CNNs) that do not provide uncertainty in the quantitative outcome,4-5 which is an important prerequisite for the clinical application of DL-MRS. In the case of the NLSF approach, the Cramér-Rao-lower-bounds(CRLB) have long been used as a measure of fitting precision.6Instead of a single set of optimized, deterministic weights in the standard CNNs, Bayesian convolutional neural networks(BCNNs) can be described in terms of the probability distribution of weights.5,7,8 The distribution of weights results in the distribution of network outputs and thus provides information about the uncertainty in the outputs.
We investigated the BCNN with Monte Carlo dropout(MCDO) sampling4,5,8 as a means of simultaneously estimating metabolite content and uncertainty therein at 3.0T. Using simulated spectra, a BCNN was trained to predict a metabolite-only spectrum from a typical human brain spectrum.3 Both metabolite content and corresponding uncertainty are estimated from MCDO sampled spectra. The performance of the proposed method was tested first on the simulated spectra and further on the modified in vivo spectra.
METHODS
Simulated brain spectra: Spectra were simulated as previously described.3 A total of 100,000 spectra were simulated and randomly assigned into a training(N=80,000), a validation(N=10,000), and a test(N=10,000) sets.Modified in vivo spectra: The unmodified, original spectra were collected previously from the left frontal lobe(2×2×2cm3) of 5 healthy volunteers(30±3years) (PRESS9, TR/TE=2000/30ms, SW=2kHz, NSA=64, and 2048 data points).3 For each spectrum, the SNR was lowered and the linewidth was broadened simultaneously and gradually to generate 10 modified spectra with different SNR and linewidth combinations. Thus, 50 additional spectra were obtained from the 5 original data.
BCNN: A BCNN was designed based on a ResNet10 and Bayesian-optimized12 in Matlab(Figure.1). A dropout layer that was rendered to operate at test time as well was placed after every activation layer. The heteroscedastic noise variance(σt2 in Figure.1) of input data was learned also in the training phase.8 The number of MCDO sampling(T) of 50 was determined that minimized the mean-absolute-percent-error(MAPE) in the quantification of 17 metabolites.
Prediction of metabolite content and corresponding uncertainty: Each individual metabolite content was estimated from the predictive mean spectrum(Figure.1) by multiple regression using the metabolite basis set as previously described.3 For the estimation of the corresponding uncertainty, first, a two-standard deviation (2×SD) spectrum(2σ in Figure.1) was obtained from the total uncertainty spectrum(σ2 = σ2alea(aleatoric uncertainty) + σ2epis(epistemic uncertainty) in Figure.1). Then, the uncertainty was estimated from the 2SD spectrum also by multiple regression, in which case the metabolite basis set was used in absolute mode in accordance with the 2SD spectrum. Finally, the uncertainty was converted into the percentage with respect to the metabolite content(%uncertainty) for each metabolite.
Evaluation of the proposed method: The BCNN was evaluated first on the simulated test set and then on the modified in vivo spectra, for which the metabolite content and uncertainty from the proposed method were compared with the metabolite content and CRLB from the LCModel.11
RESULTS
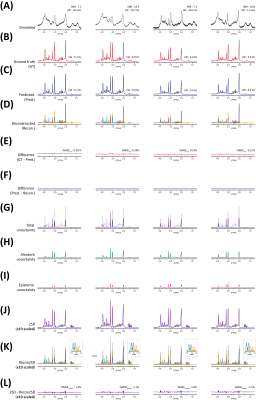
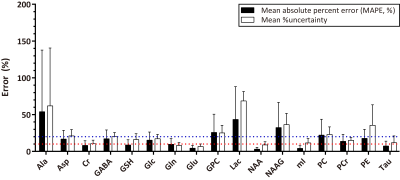
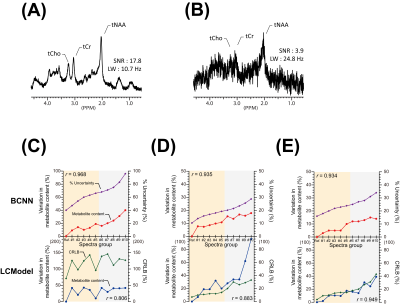
The representative simulated brain spectra in the test set, BCNN-predicted spectra, and the total uncertainty are shown in Figure.2(A), (C) and (G), respectively. The BCNN-predicted spectra and the total uncertainty are almost fully accounted for by the linear combination of the metabolite bases after multiple regression as demonstrated in the residual spectra((F)and(L)). The mean ground truth(GT) errors in the BCNN-predicted metabolite content(MAPE) are shown in Figure.3 in comparison with the mean BCNN-predicted errors(%uncertainty) over the 10,000 test spectra. The MAPE of Cr, GSH, Gln, Glu, NAA, mI, and Tau are ≤ 10%. For the majority of the metabolites, %uncertainty is comparable with MAPE. Table.1 summarizes the correlations between the GT error and BCNN-predicted %uncertainty for the individual metabolites on the test set(r=0.83±0.06; p<0.001 for all metabolites). Figure.4 shows the representative unmodified in vivo spectrum (A) and the spectrum with the worst spectral quality among the modified spectra therefrom(B). The mean variation in the BCNN-predicted metabolite content and the mean %uncertainty over the 5 subjects are shown for GABA (C), Glx (D), and tNAA (E) as a function of spectral quality. The results from LCModel are also shown. Overall, the variations in metabolite content appear smaller with the proposed method. Overall, the correlations between the variation in metabolite content and %uncertainty from the proposed method tend to be comparable with, or higher than, those between the variation in metabolite content and CRLB from LCModel(r=0.95±0.02 vs. 0.88±0.06 (p<0.003) for all metabolites).DISCUSSION
The finding that MAPE of Cr, GSH, Gln, Glu, NAA, mI, and Tau on the simulated test spectra were ≤ 10% is encouraging. However, the quantification of Ala, GPC, Lac, NAAG, and PC still requires far more technical improvement as found also in the previous study.3 Overall, the high correlations between the GT errors and BCNN-predicted uncertainty shown in Figure.3 and Table.1 support the potential application of the proposed method in DL-MRS with simultaneous uncertainty estimation.CONCLUSION
The proposed method may be used for metabolite quantification with simultaneous uncertainty estimation in DL-MRS.Acknowledgements
This work was supported by the National Research Foundation of Korea (NRF) grant funded by the Ministry of Education, Science and Technology (2018M3A7B4071235) and by the Korea government (MSIT) (2019R1A2C1002433).References
1. Hatami N, Sdika M, Ratiney H. Magnetic resonance spectroscopy quantification using deep learning. arXiv. 2018;1806.07237v1.
2. Gurbani SS, Sheriff S, Maudsley AA, Shim H, Cooper LAD. Incorporation of a spectral model in a convolutional neural network for accelerated spectral fitting. Magn Reson Med. 2019;81: 3346-3357.
3. Lee HH, Kim H. Intact metabolite spectrum mining by deep learning in proton magnetic resonance spectroscopy of the brain. Magn Reson Med. 2019;82:33-48.
4. Gal Y, Ghahramani Z. Dropout as a bayesian approximation: Representing model uncertainty in deep learning. arXiv. 2015;1506.02142v6.
5. Gal Y, Ghahramani Z. Bayesian convolutional neural networks with Bernoulli approximate variational inference. arXiv. 2015;1506.02158v6.
6. Wilson M., Andronesi O, Barker P, et al. Methodological consensus on clinical proton MRS of the brain: Review and recommendations. Magn Reson Med. 2019;82:527-550.
7. Gal Y. Uncertainty in deep learning. University of Cambridge. 2016;1:3.
8. Kendall A, Gal Y. What uncertainties do we need in bayesian deep learning for computer vision?. arXiv. 2017;1703.04977v2.
9. Bottomley PA. Spatial localization in NMR spectroscopy in vivo. Ann. N. Y. Acad. 1987;508:333-348.
10. He K, Zhang X, Ren S, Sun J. Deep residual learning for image recognition. arXiv. 2015;1512.03385v1
11. Provencher SW. Estimation of metabolite concentrations from localized in vivo proton NMR spectra. Magn Reson Med. 1993;30:672–679.
12. Lee HH, Kim H. Deep learning‐based target metabolite isolation and big data‐driven measurement uncertainty estimation in proton magnetic resonance spectroscopy of the brain. Magn Reson Med. 2020;84:1689-1706.
13. Kreis R. The trouble with quality filtering based on relative Cramér-Rao lower bounds. Magn Reson Med. 2016;75:15–8.
14. Pope WB, Prins RM, Albert Thomas M, et al. Non-invasive detection of 2-hydroxyglutarate and other metabolites in IDH1 mutant glioma patients using magnetic resonance spectroscopy. J Neurooncol. 2012;107:197–205.
Figures


