2008
Automatic phase order correction in challenging MR spectra1Centre for the Developing Brain, School of Biomedical Engineering and Imaging Sciences, King's College London, London, United Kingdom, 2Biomedical Engineering Department, School of Biomedical Engineering and Imaging Sciences, King's College London, London, United Kingdom
Synopsis
The aim of this work is to develop an automatic zero and first order phase order correction and apply it to challenging spectra, using an MRS LASER sequence at 3T
BACKGROUND:
Magnetic resonance spectroscopy (MRS) provides a noninvasive measurement of metabolism. Routine clinical adoption of MRS is hindered by robustness and reproducibility issues, including spectral overlap and interference from residual water, lipids and macromolecules1. Therefore, proper baseline correction (or modelling) is key to achieve accurate and reproducible metabolic quantification2. In addition, the MRS baseline can be distorted in the presence of uncorrected phase errors, which can then translate into large effects in quantification results3. Various fitting MRS software (such as TARQUIN4) provide automatic zero order phase correction functionality during the preprocessing stage, but uncorrected first order phase errors can still cause baseline distortions and therefore metabolic quantification errors.AIM:
To develop an automatic zero and first order phase order correction pipeline and apply it to challenging spectra, comparing its performance with the automatic phase correction from an established MRS software (TARQUIN).METHODS:
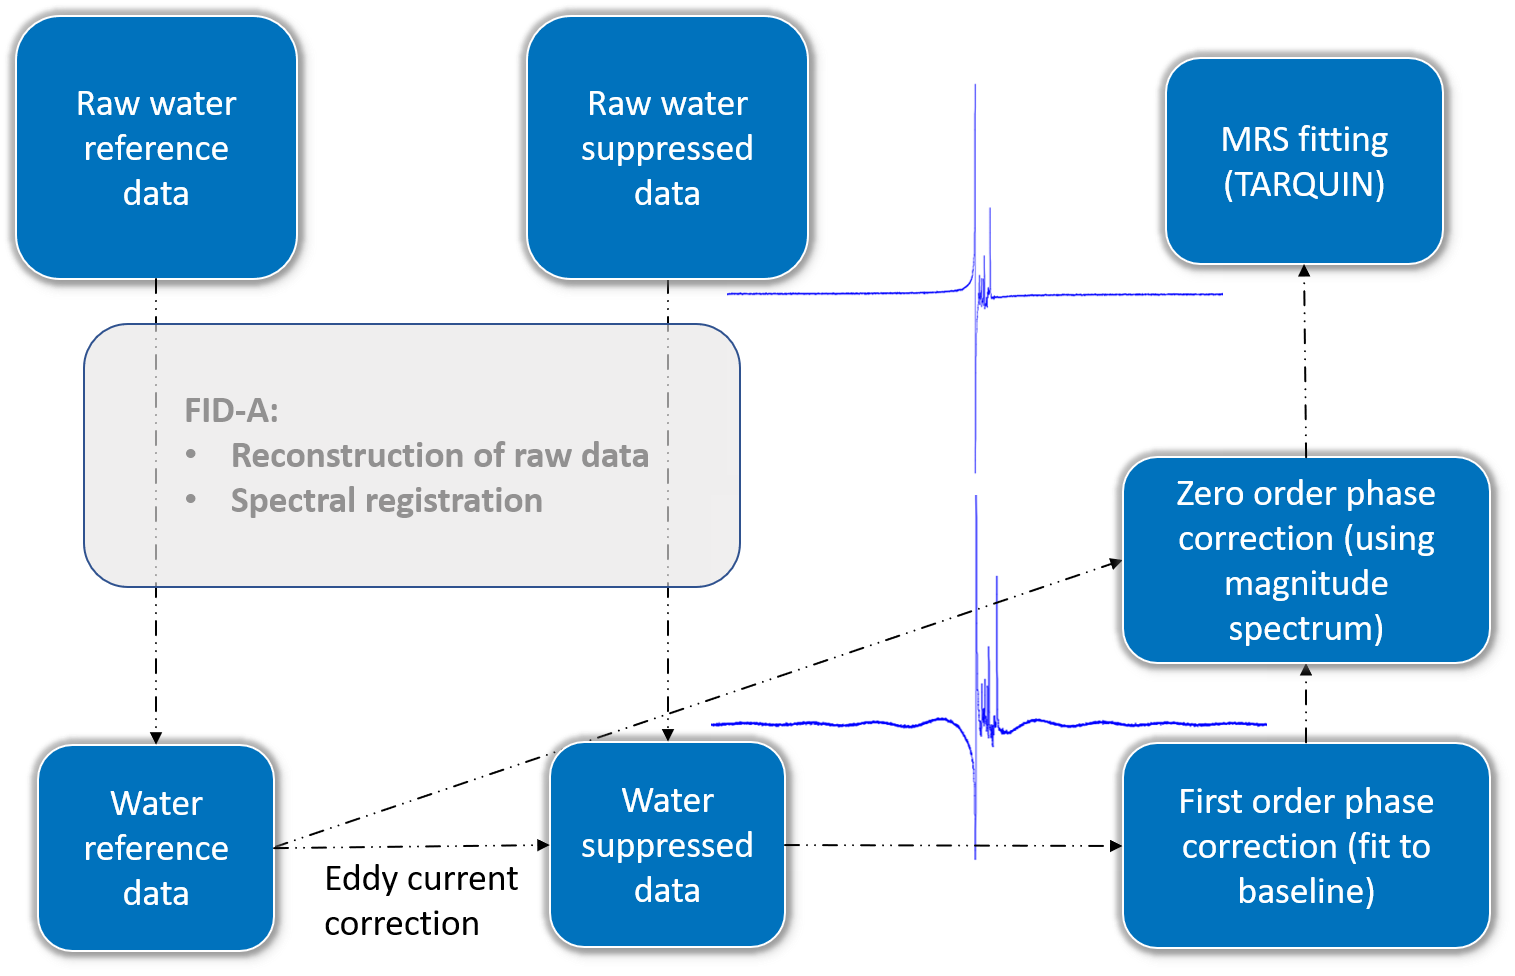
Data N=11 MRS datasets from healthy control subjects. Spectra were acquired using a LASER MRS sequence (C2P5, TE = 72 ms, TR = 3 s, 512 acquisitions, 16348 points, BW = 16k Hz (readout duration of 1 s), VAPOR water suppression, 26 min scanning time) on a Siemens Verio 3 T (32-channel head coil), from a voxel centered in the posterior cingulate cortex 20x20x20 mm3. A spectrum without water suppression was also acquired from the same voxel as reference and for subsequent eddy current correction ECC (NA = 16).MRS processing and phase correction MRS data were pre-processed in Matlab. Raw data reconstruction and spectral registration was performed using FID-A6. Next, water suppressed data was corrected for eddy currents7. As an initial first step for phase correction, N points in the FID were shifted until a relatively flat baseline was achieved in the frequency domain, to correct for any first order phase offsets. This process was automated by fitting zero order polynomials to the different resulting baselines (excluding all the peaks in the 0-6ppm region) and choosing the N that minimised the residual. Once the baseline was flat, an automatic zero order phase correction was implemented, by finding the constant phase offset that minimised the differences between the magnitude spectrum and the real spectrum, in the area containing the metabolic peaks (1.7-4ppm, water peak is excluded). Only zero order phase correction was required for the unsuppressed water spectrum.
Fitting After pre-processing, all spectra were fitted using TARQUIN, with the preprocessing steps deactivated. As comparison, the spectra were preprocessed and fitted using default TARQUIN parameters immediately following the spectral registration step.
RESULTS:
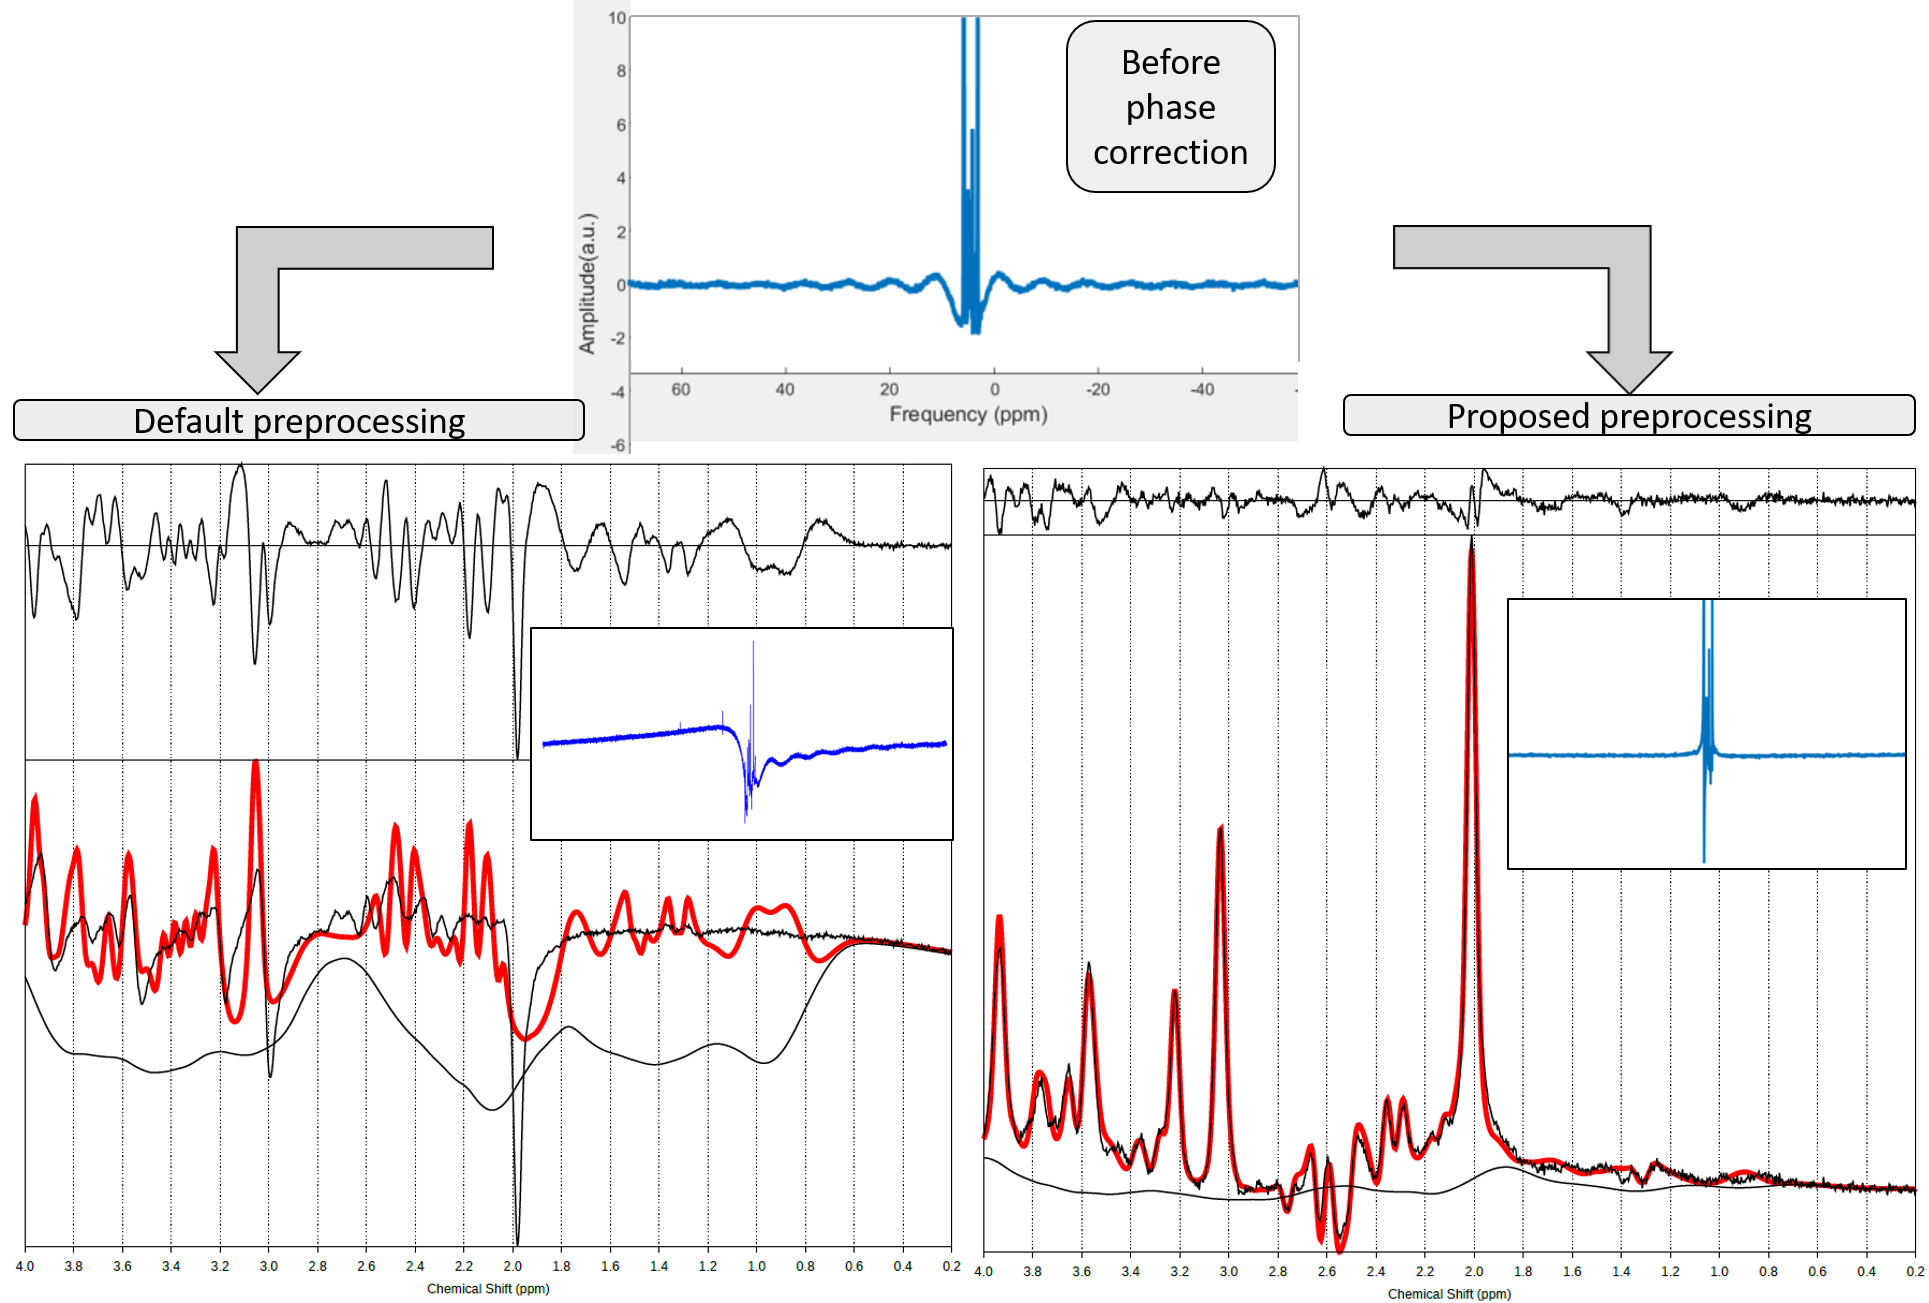
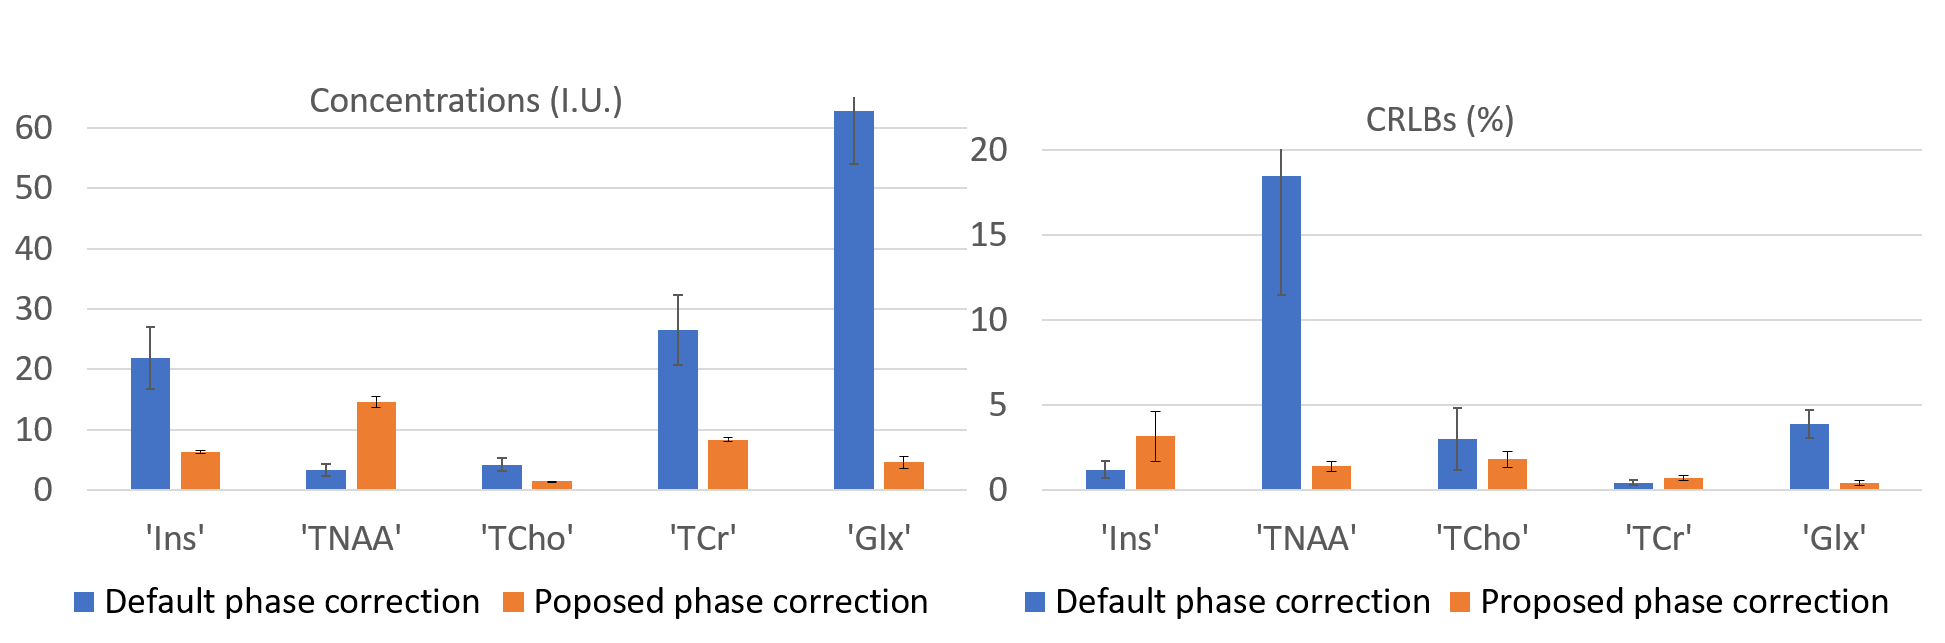
Figure 1 illustrates the preprocessing pipeline, implemented in Matlab. The automatic phase correction code is available in Github8. Figure 2 shows a representative example of the proposed phase correction approach performance compared to default preprocessing (TARQUIN). Figure 3 shows the quantified average metabolic levels using the default phase correction approach (blue) and the proposed method (orange). Estimated concentrations were significantly changed for all metabolites displayed (p<0.05), and CRLBs were significantly lower for tNAA and Glx (p<0.05), with no significant changes in other metabolites.DISCUSSION:
Appropriate phasing is necessary when dealing with the real part of the MRS signal, to get the spectrum in its absorption mode. The linear first order phasing present in this dataset caused a “rippling” effect in the baseline, which was more noticeable due to the large bandwidth of the spectra and, if uncorrected, resulted in large, structured residuals and baseline artifacts.CONCLUSION:
The proposed phase correction automatically calculated the number of points that the MRS spectra needed to be shifted to achieve a flat baseline and correct any first order phase offsets, prior to zero order phase correction and fitting. The resulting MRS quantification more closely matched reported metabolic normative values9.Acknowledgements
No acknowledgement found.References
1. Marjanska M, Terpstra M. Influence of fitting approaches in LCModel on MRS quantification focusing on age‐specific macromolecules and the spline baseline. NMR in Biomed. 2019; e4197.
2. Wilson M. Adaptive baseline fitting for 1HMR spectroscopy analysis. MRM. 2020; 85(1):13-29.
3. Near J, Edden R et al. Frequency and phase drift correction of magnetic resonance spectroscopy data by spectral registration in the time domain. MRM. 2015; 73(1):44-50.
4. Wilson M, Reynolds G, Kauppinen RA et al. A constrained least-squares approach to the automated quantitation of in vivo 1H magnetic resonance spectroscopy data. MRM. 2011; 65(1):1-12
5. CMRR Spectroscopy Package. https://www.cmrr.umn.edu/spectro/. Accessed December 16, 2020.
6. Simpson R, Devenyi GA, Jezzard P et al. Advanced processing and simulation of MRS data using the FID appliance (FID-A)-An open source, MATLAB-based toolkit. MRM. 2017; 77(1):23-33
7. Klose U. In vivo proton spectroscopy in presence of eddy currents. MRM. 1990; 14(1):26-30
8. Github. https://github.com/MariaICL/Automatic-MRS-phase-correction
9. de Graaf RA, In Vivo NMR Spectroscopy: Principles and Techniques, Second Edition. 2013
Figures