2006
Reproducibility of High-Resolution 1H-MRSI at 7T Using SPICE1Cleveland Clinic Foundation, CLEVELAND, OH, United States, 2University of Illinois, Urbana, IL, United States
Synopsis
Subspace-based rapid high resolution MRSI technique SPICE (SPectroscopic Imaging by exploiting spatiospectral CorrElation) was implemented on Siemens Magnetom 7T scanner. Reproducibility of SPICE at 7T with respect to metabolite measures was evaluated for phantom as well as in vivo scans with 3×3×3 mm3 spatial resolution. A phantom and a healthy subject were scanned twice during the same session, with the healthy subject being scanned on two different days. Strong scan-to-scan metabolite concentration correlations were observed in both phantom and in vivo scans. Good reproducibility was also demonstrated from Bland Altman analysis.
INTRODUCTION
Magnetic resonance spectroscopic imaging (MRSI) is a powerful imaging technique, but its clinical utility has been limited by low signal-to-noise ratio (SNR) and poor spatial resolution. Recently a subspace-based method called SPICE (SPectroscopic Imaging by exploiting spatiospectral CorrElation), has been proposed for rapid high-resolution 3D MRSI, producing encouraging results at 3T.1,2,3,4 We have implemented SPICE on a 7T platform, leveraging the increased sensitivity and SNR associated with ultrahigh field like 7T5-7 to further enhance the capability of SPICE for rapid high-resolution 3D MRSI without water suppression. Since 7T requires higher sampling bandwidth to avoid spectral aliasing, it could present a problem for SPICE to acquire spatiospectral encodings in EPSI trajectories; large B0/B1 inhomogeneity and B0 drift could also be a problem for accelerated MRSI with sparse sampling of (k, t)-space. In addition since reproducibility of MRSI with respect to metabolite measures remains a matter of concern,8-11 this study investigated reproducibility of SPICE-based MRSI at 7T with respect to metabolite measures. Reproducibility of phantom as well as in vivo scans was evaluated.METHODS
Phantom and in vivo scans were performed on Siemens Magnetom 7T scanner with a 32-receive single transmit head coil. A GE Braino phantom (GE Medical Systems, Milwaukee, WI, USA) was scanned twice during the same session, while 1 healthy subject was scanned under an institutional review board approved protocol on 2 different days with each session consisting of 2 SPICE scans. The parameters for SPICE acquisitions were as follows: FOV=240×240×72 mm3, TR/TE=160/1.6 ms, bandwidth=200 kHz, echo space=1.04 ms, matrix size=78×78×24 (corresponding to a nominal resolution of 3×3×3 mm3) for metabolite signals and 78×216×72 (corresponding to a nominal resolution of 1×3×1 mm3) for water signals, total scan time: 7 min 46 s. The water suppression pulses used in traditional MRSI methods were removed in the SPICE sequence; thus both metabolite signals and water signals were simultaneously acquired. The spatiospectral distributions of water and metabolites were reconstructed using a union-of-subspaces model, incorporating both spatial and spectral priors.1-3,12 B0 and B1 inhomogeneities were corrected using the high-resolution B0 field map and B1 weighting map estimated from the companion water signals. Metabolite concentrations were estimated by spectral quantification using an improved LC model based algorithm.12 To analyze reproducibility of the MRSI results, metabolite maps from different scans and sessions were registered by affine transform using the SPM toolbox.13,14 Both scan-rescan metabolite concentration maps and localized spectra from specific ROIs were compared. A correlation analysis and Bland-Altman analysis were also performed to evaluate the test-retest reproducibility quantitatively.RESULTS AND DISCUSSION
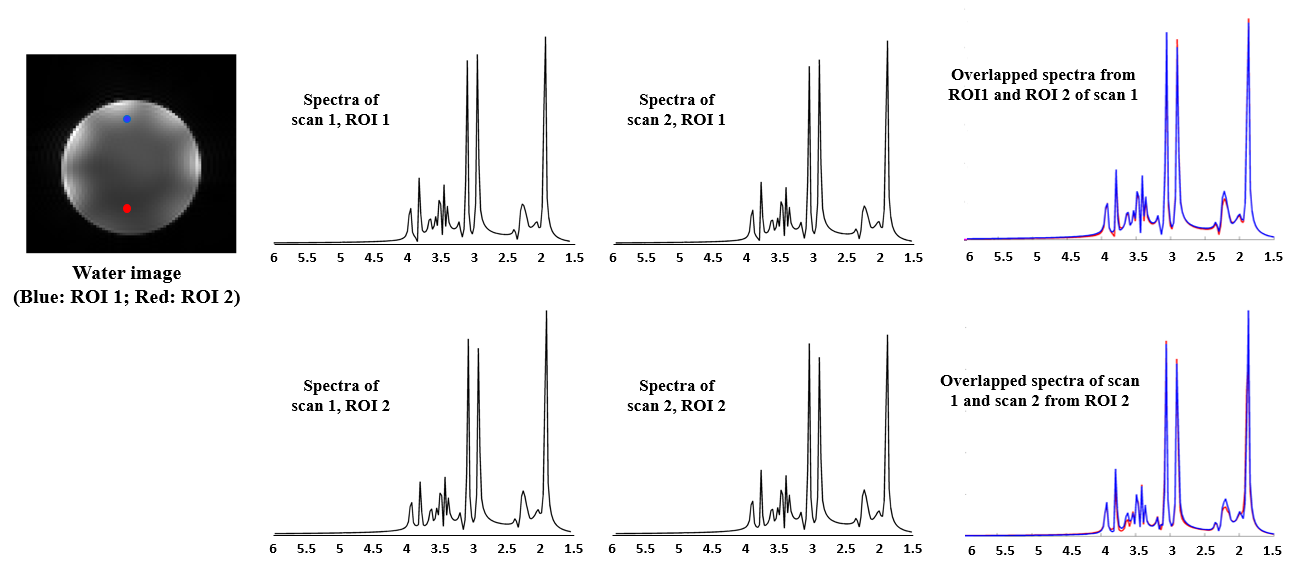
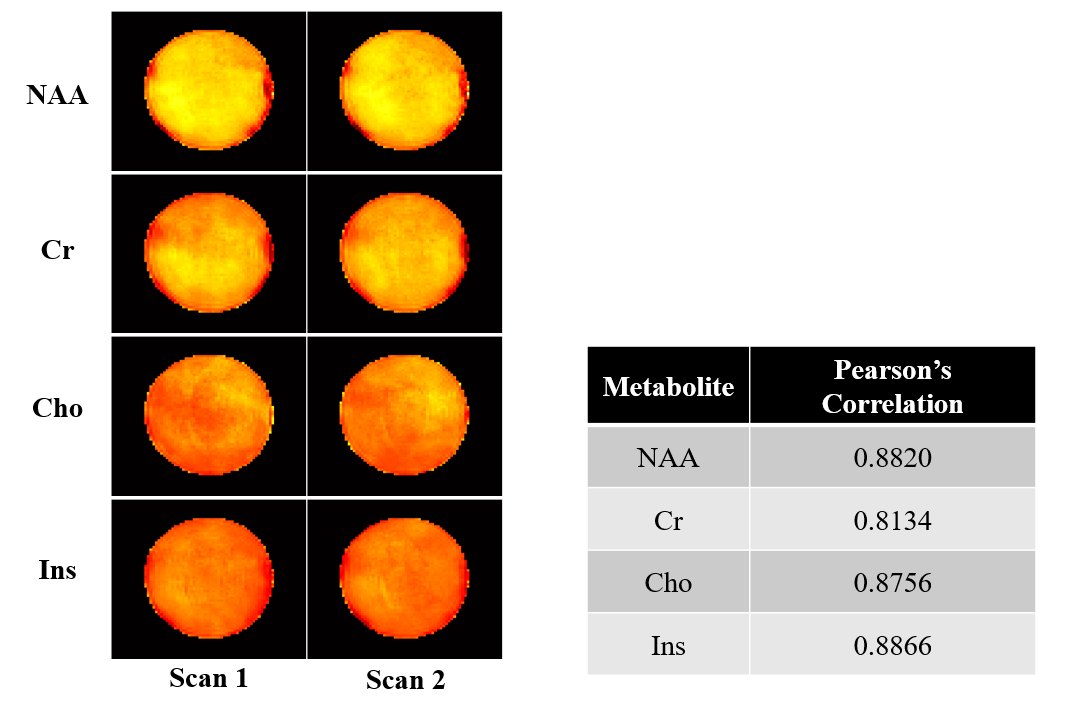
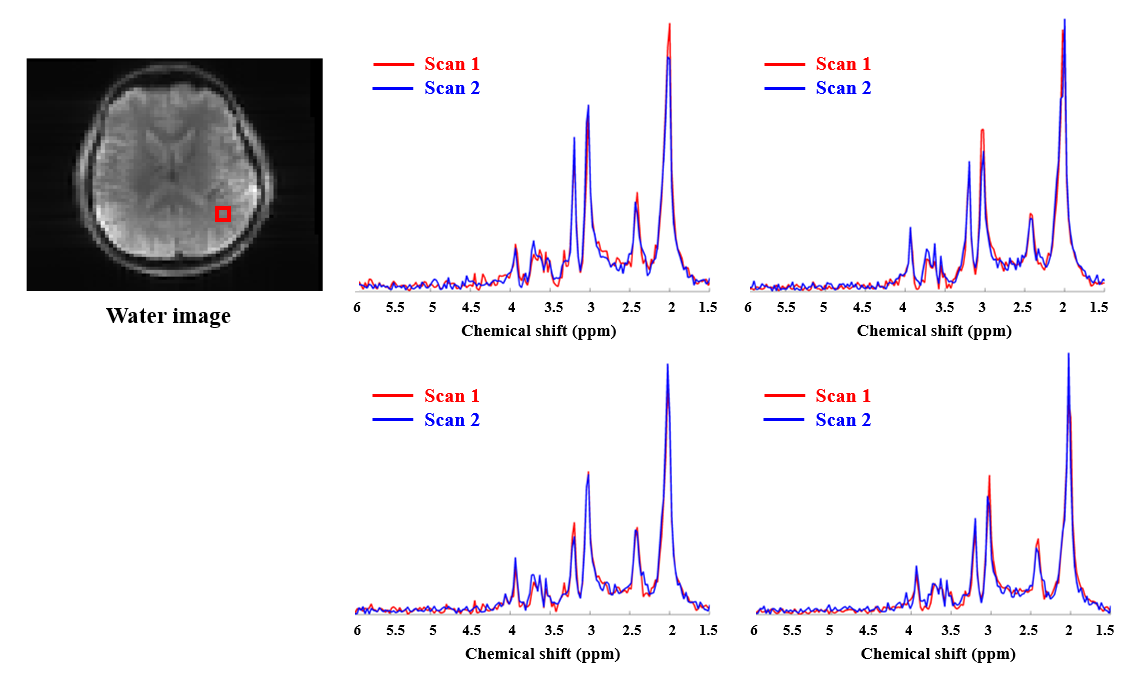
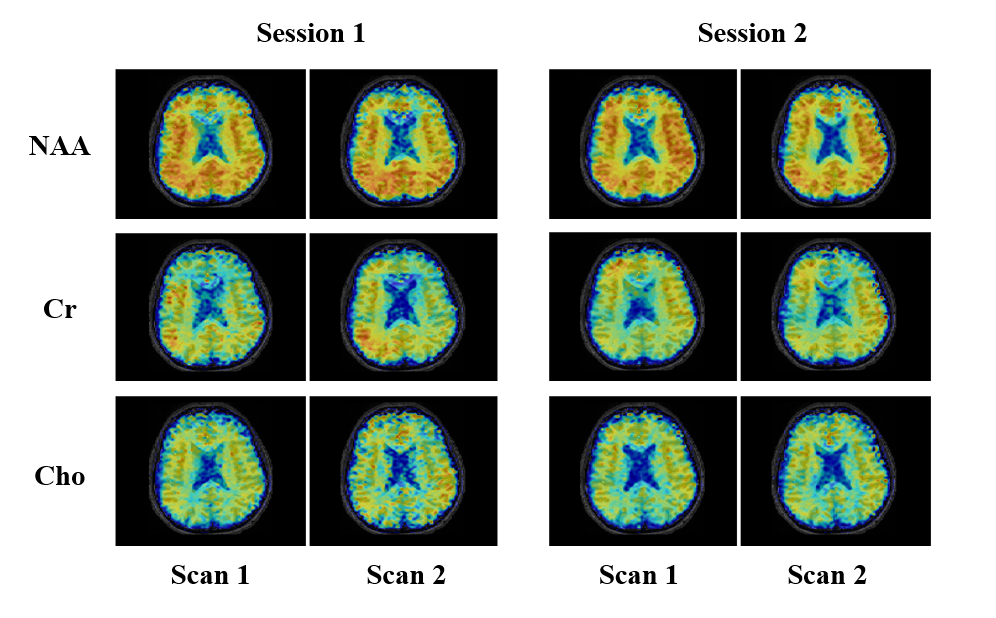
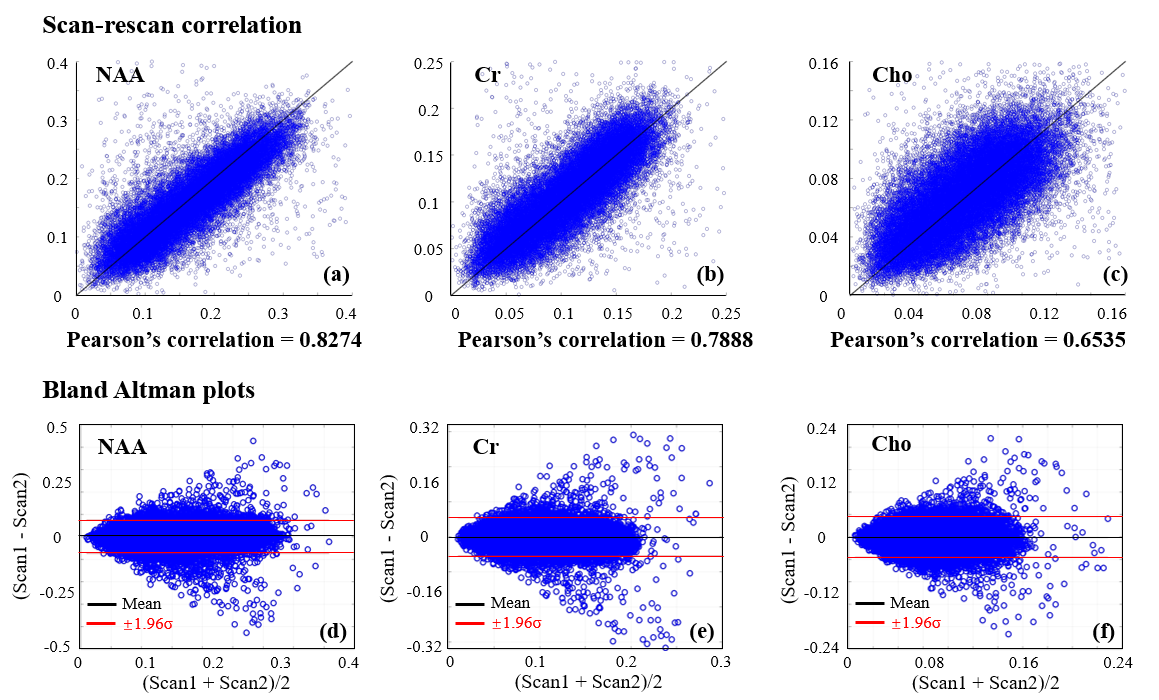
Phantom scan-rescan spectra from two different ROIs (3.0×3.0×3.0 mm3) in the phantom are shown in Fig. 1. The spectra from the same ROI show good consistency between repeated scans; the spectra from different ROIs with different B0 and B1 field also show good consistency. Scan-rescan metabolite maps of N-acetyl aspartate (NAA), creatine (Cr), choline (Cho) and myo-inositol (Ins) and associated Pearson’s correlation coefficients are shown in Fig. 2. Strong scan-rescan correlations are observed for metabolite concentrations. Overlapping in vivo scan-rescan metabolite spectra from a single session were displayed in Fig. 3, showing good qualitative reproducibility. Scan-rescan metabolite maps from 2 different sessions, as shown in Fig. 4, also exhibit qualitative reproducibility. Quantitative analysis of in vivo scan-rescan reproducibility can be seen in Fig. 5. Significant voxelwise scan-rescan correlation for NAA, Cr and Cho are demonstrated in Fig. 5(a), (b) and (c) respectively. The Bland Altman plots also demonstrate reproducibility of 1H SPICE at 7T (only 4.45%, 3.36% and 3.73% points lie outside the ±1.96σ limits in Fig. 5(a), (b) and (c) respectively).CONCLUSION
Rapid (<10 min) high resolution (3×3×3 mm3) non-water suppressed 1H SPICE is feasible at 7T, producing reproducible results from both phantom and healthy subjects.Acknowledgements
This work was supported, in part, by the National Institutes of Health.References
1. Lam F, Liang ZP. A subspace approach to high-resolution spectroscopic imaging. Magn Reson Med. 2014;71(4):1349-1357.
2. Lam F, Ma C, Clifford B, Johnson CL, Liang ZP. High-resolution (1) H-MRSI of the brain using SPICE: Data acquisition and image reconstruction. Magn Reson Med. 2016;76(4):1059-1070.
3. Guo R, Zhao Y, Li Y, et al. Simultaneous QSM and metabolic imaging of the brain using SPICE: Further improvements in data acquisition and processing. Magn Reson Med. 2021;85(2):970-977.
4. Li Y, Wang T, Zhang T, et al. Fast high-resolution metabolic imaging of acute stroke with 3D magnetic resonance spectroscopy. Brain. 2020;143(11):3225-3233.
5. Mekle R, Mlynarik V, Gambarota G, Hergt M, Krueger G, Gruetter R. MR spectroscopy of the human brain with enhanced signal intensity at ultrashort echo times on a clinical platform at 3T and 7T. Magn Reson Med. 2009;61(6):1279-1285.
6. Otazo R, Mueller B, Ugurbil K, Wald L, Posse S. Signal-to-noise ratio and spectral linewidth improvements between 1.5 and 7 Tesla in proton echo-planar spectroscopic imaging. Magn Reson Med. 2006;56(6):1200-1210.
7. Tkac I, Oz G, Adriany G, Ugurbil K, Gruetter R. In vivo 1H NMR spectroscopy of the human brain at high magnetic fields: metabolite quantification at 4T vs. 7T. Magn Reson Med. 2009;62(4):868-879.
8. Langer DL, Rakaric P, Kirilova A, Jaffray DA, Damyanovich AZ. Assessment of metabolite quantitation reproducibility in serial 3D-(1)H-MR spectroscopic imaging of human brain using stereotactic repositioning. Magn Reson Med. 2007;58(4):666-673.
9. Ratai EM, Hancu I, Blezek DJ, Turk KW, Halpern E, Gonzalez RG. Automatic repositioning of MRSI voxels in longitudinal studies: impact on reproducibility of metabolite concentration measurements. J Magn Reson Imaging. 2008;27(5):1188-1193.
10. Gu M, Kim DH, Mayer D, Sullivan EV, Pfefferbaum A, Spielman DM. Reproducibility study of whole-brain 1H spectroscopic imaging with automated quantification. Magn Reson Med. 2008;60(3):542-547.
11. Maudsley AA, Domenig C, Sheriff S. Reproducibility of serial whole-brain MR spectroscopic imaging. NMR Biomed. 2010;23(3):251-256.
12. Li Y, Lam F, Clifford B, Liang ZP. A Subspace Approach to Spectral Quantification for MR Spectroscopic Imaging. IEEE Trans Biomed Eng. 2017;64(10):2486-2489.
13. Friston KJ, Ashburner J, Frith CD, Poline JB, Heather JD, Frackowiak RS. Spatial registration and normalization of images. Human Brain Mapping. 1995;3:165-189.
14. Friston KJ, Holmes AP, Worsley KJ, Poline JB, Frith CD, Frackowiak RS. Statistical parametric maps in functional imaging: A general linear approach. Human Brain Mapping. 1994;2:189-210.
Figures