2005
Reproducibility and Coverage of Human Whole-brain 1H FID MRSI at 9.4 T after Processing Pipeline Optimization1MRZ, MPI for Biological Cybernetics, Tuebingen, Germany, 2IMPRS for Cognitive and Systems Neuroscience, Tuebingen, Germany, 3Advanced Imaging Research Center, University of Texas Southwestern Medical Center, Dallas, TX, United States
Synopsis
Whole-brain data were acquired using a non-accelerated, non-lipid-suppressed and ultra-short echo time 1H FID-MRSI 2D multi-slice sequence at 9.4 T on human subjects. Data was reconstructed, retrospectively lipid suppressed and fitted including a relaxation corrected macromolecular basis spectrum. Metabolite concentration maps showing expected concentration differences between gray and white matter could be achieved with 89-97% coverage of the whole brain for tCr, tCho, NAA, Glu, and mI. A stack of 32 mm thickness covering the central part of the cerebrum yields anatomically correct maps for Gln, Tau, GABA, NAAG, and GSH. The data acquisition and reconstruction lead to reproducible results.
Introduction
Whole-brain metabolite mapping using 1H MRSI provides a valuable tool for the evaluation of metabolite concentrations across different regions in the human brain. Thus, 1H MRSI can be used to examine different brain diseases like brain cancer1,2 or multiple sclerosis3 to name just a few. So far, most whole-brain 1H MRSI studies have been performed at 3T4,5. Nevertheless, higher field strengths benefit significantly from better SNR and higher spectral resolution as Motyka et al.6 showed by comparing simulated whole-brain 1H MRSI data for different field strengths between 1.5 T and 9.4 T. The handful of current whole-brain 1H MRSI publications at ultra-high field strengths used acceleration techniques7–10. In the current work, the whole-brain 1H MRSI data have been fully sampled to serve as a ground truth for brain coverage and reproducibility of whole-brain 1H MRSI.Methods
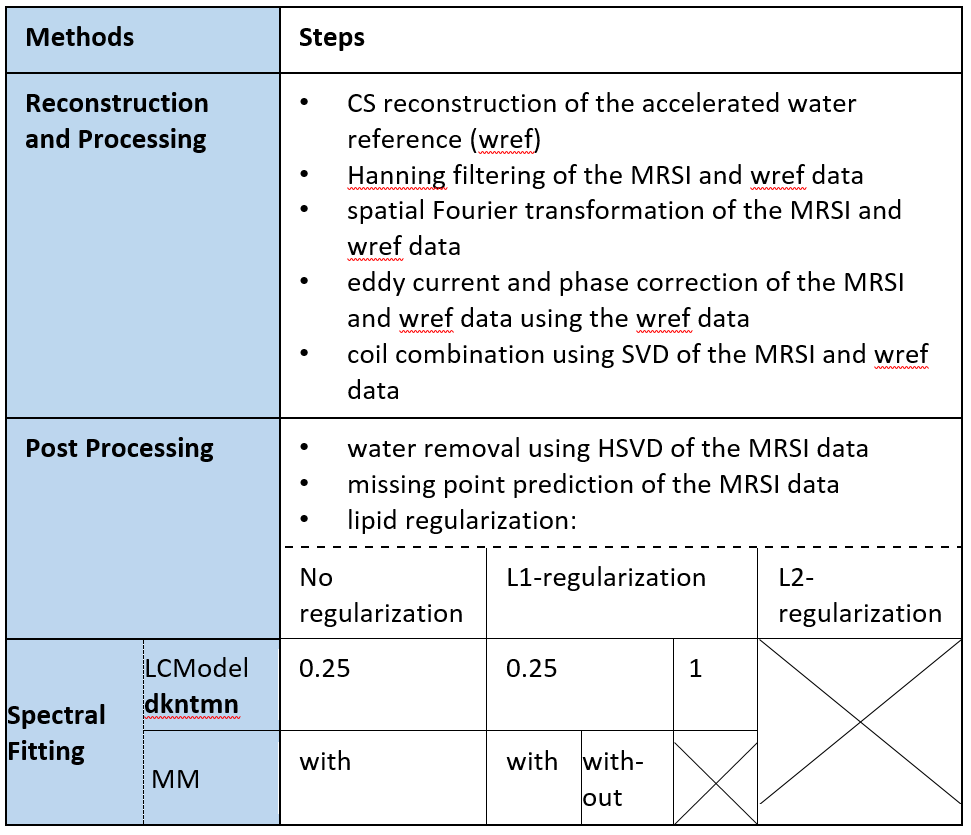
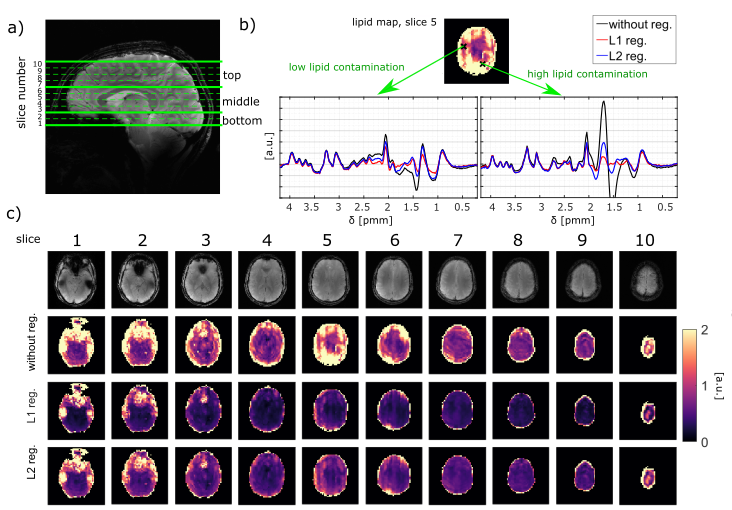
The data was acquired using a 9.4 T Magnetom whole-body MR scanner (Siemens Healthineers, Erlangen, Germany) with an 18Tx32Rx coil11. Five volunteers were scanned two times after written informed consent according to the local ethics board regulations. For each volunteer ten slices were acquired covering a total FOV of 220x220x80 mm3. The slices were grouped into three blocks as shown in Figure 2. The blocks were B0 shimmed separately. The 1H MRSI data had an in-plane resolution of 48x48 with an elliptically k-space sampling, TR = 300 ms, TE* = 1.5 ms, flip angle = 48°, spectral width = 8000 Hz, and an acquisition time of 128 ms. A water-reference MRSI data set of each slice was acquired using a compressed sensing scheme with an acceleration factor of R ~ 18. Additionally, a 2D FLASH scout image was measured to reconstruct the water signal using the SENSE x-t sparse compressed sensing (CS) reconstruction of the water reference12,13.The data was processed as shown in Table 1. Before spectral fitting of the data, a retrospective L1- or L2-lipid suppression adapted from Bilgic’s code14 was included due to strong lipid artifacts in some slices. Additionally, a simulated relaxation corrected macromolecular basis spectrum was included in the LCModel fit with a spline baseline flexibility corresponding to a dkntm value of 0.25.
Results
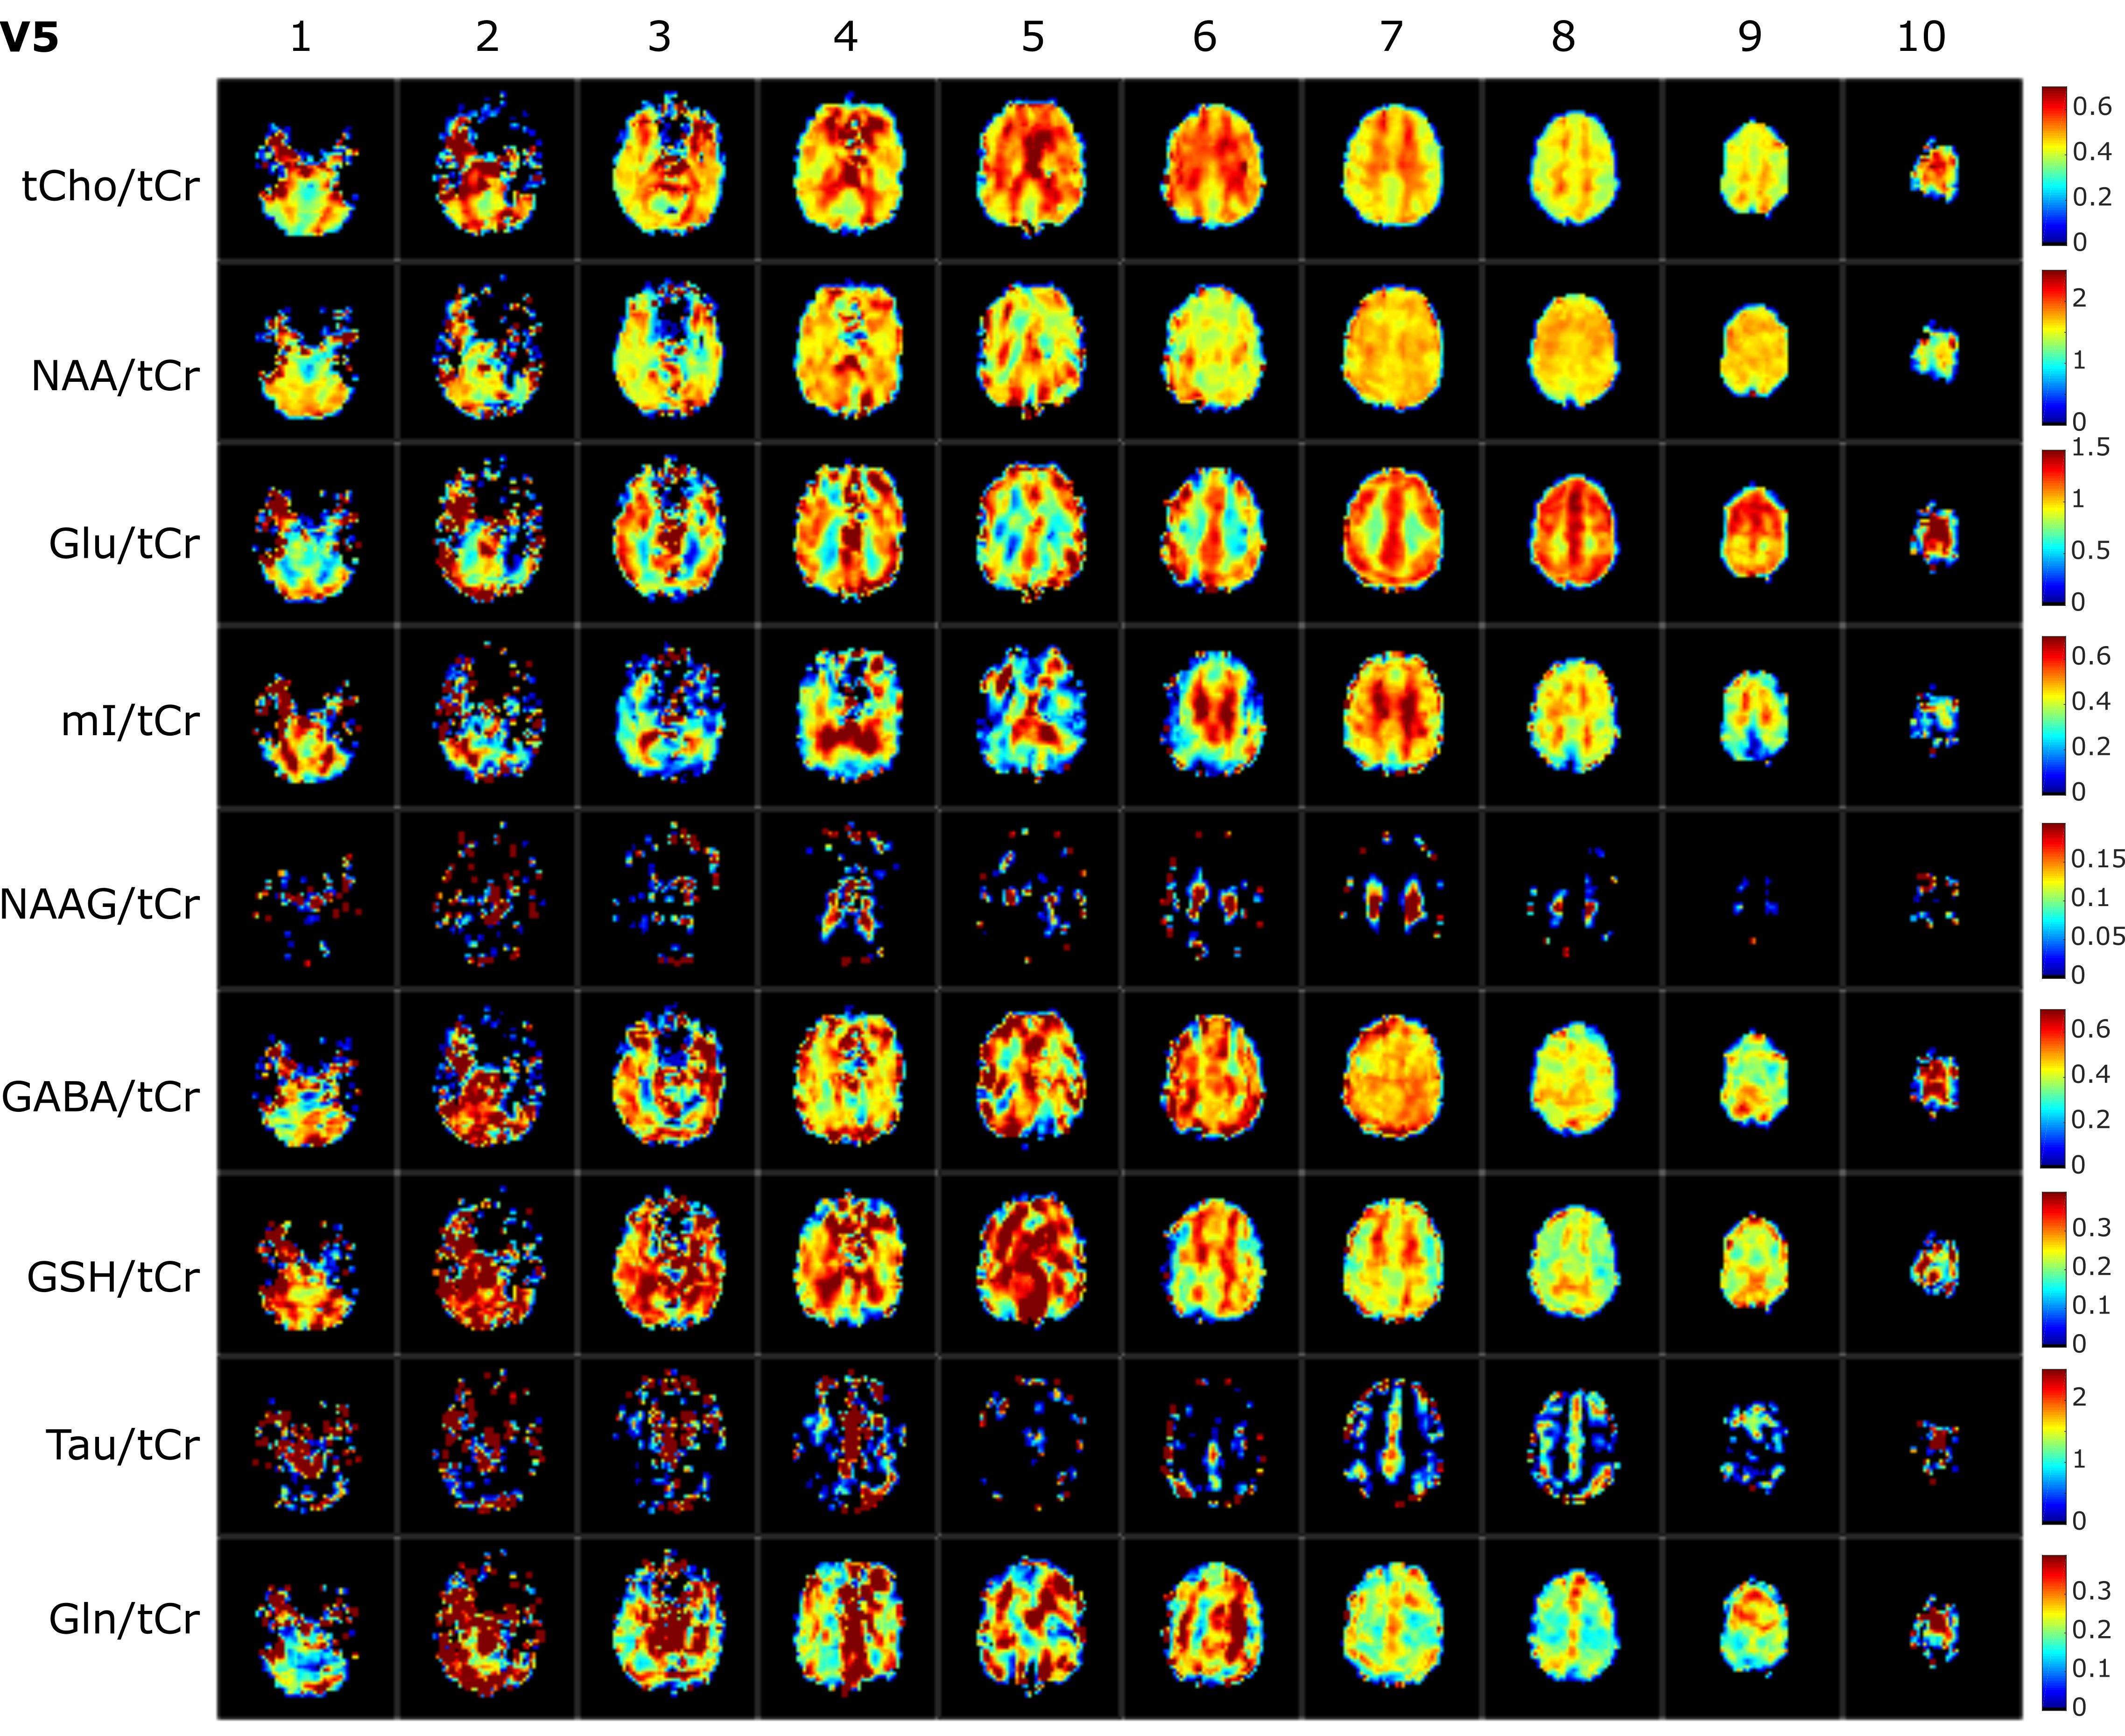
L1- and L2-regularization provided effective suppression of lipid-artifacts, see Figure 2. Both methods led to similar results. However, the L2-regularization – although less computationally expensive – strongly depends on the choice of the regularization parameter which is different in different slices and volunteers. Hence, L1-regularization with a regularization parameter of 10-3 was found to serve as the optimal balance between data consistency and regularization, and thus, was used for all slices and volunteers.In Figure 3 metabolite maps for all slices and /tCr ratio maps for nine brain metabolites are shown. The best results were obtained in the upper slices (slice 6-9) and demonstrate anatomically expected concentration differences between gray and white matter for 10 metabolites (tCr, tCho, NAA, Glu, mI, NAAG, GABA, GSH, Tau, Gln). In the lower brain slices 3-5 reasonable quality concentration maps could be obtained only for the first five metabolites.
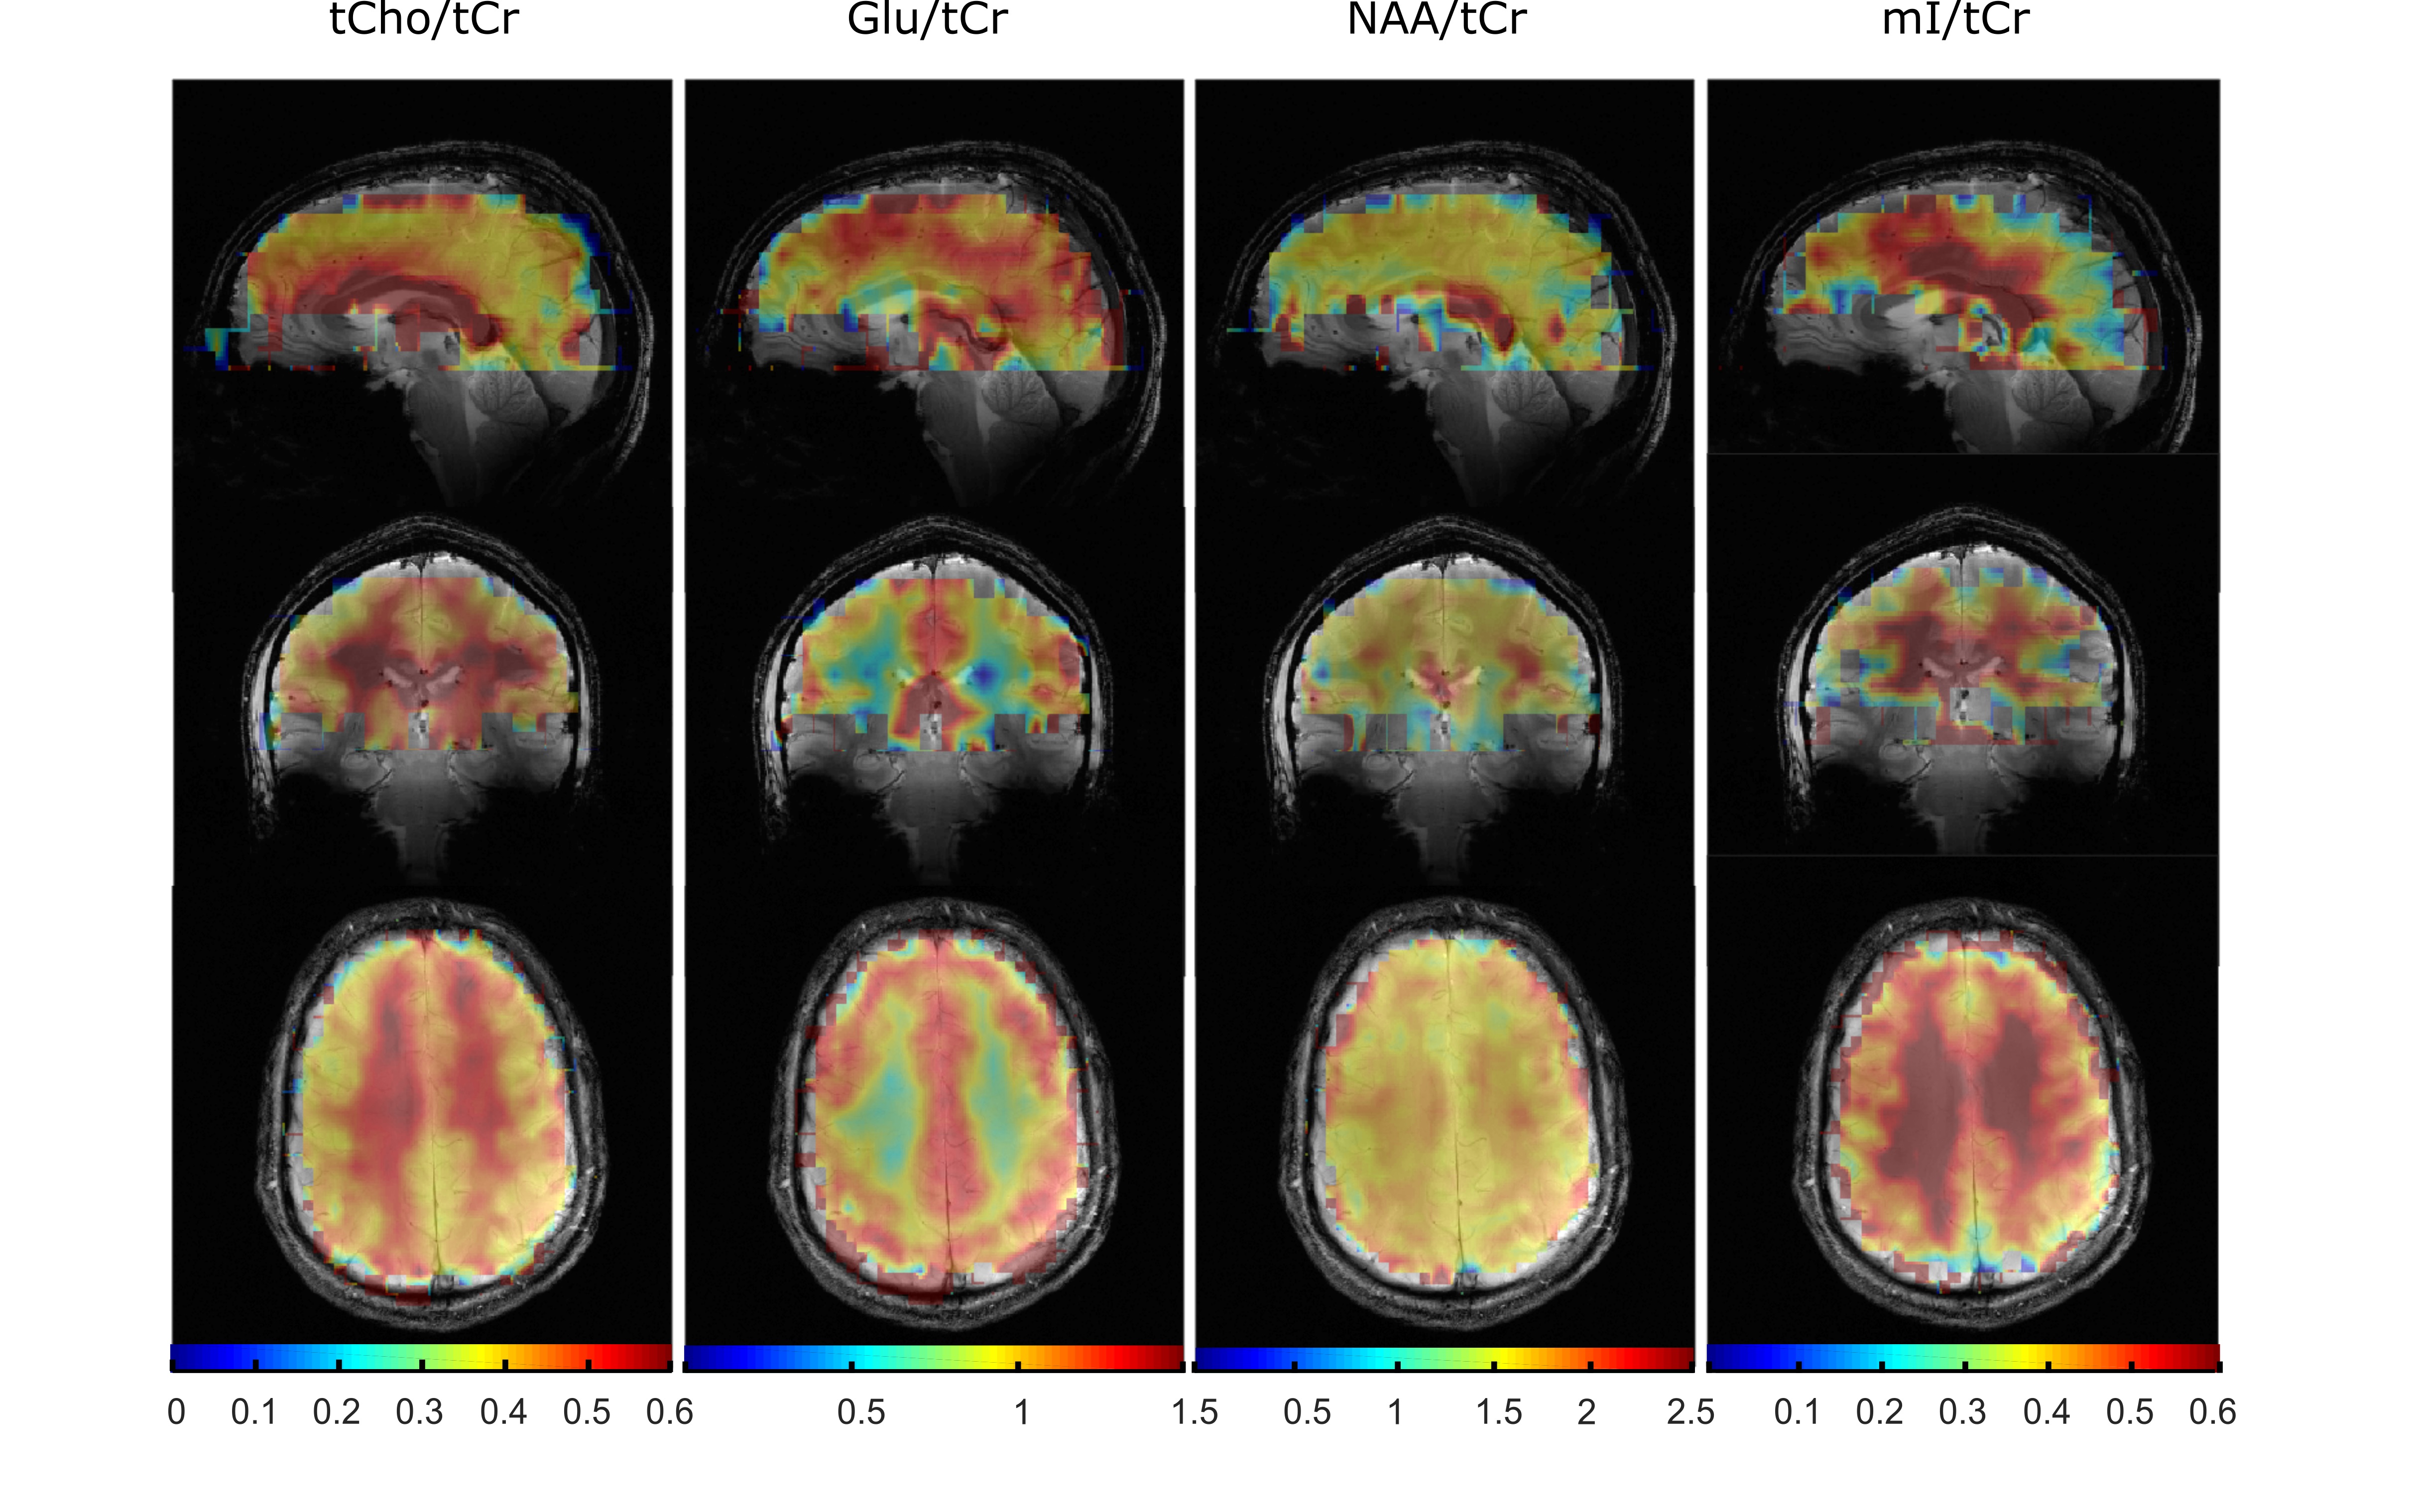
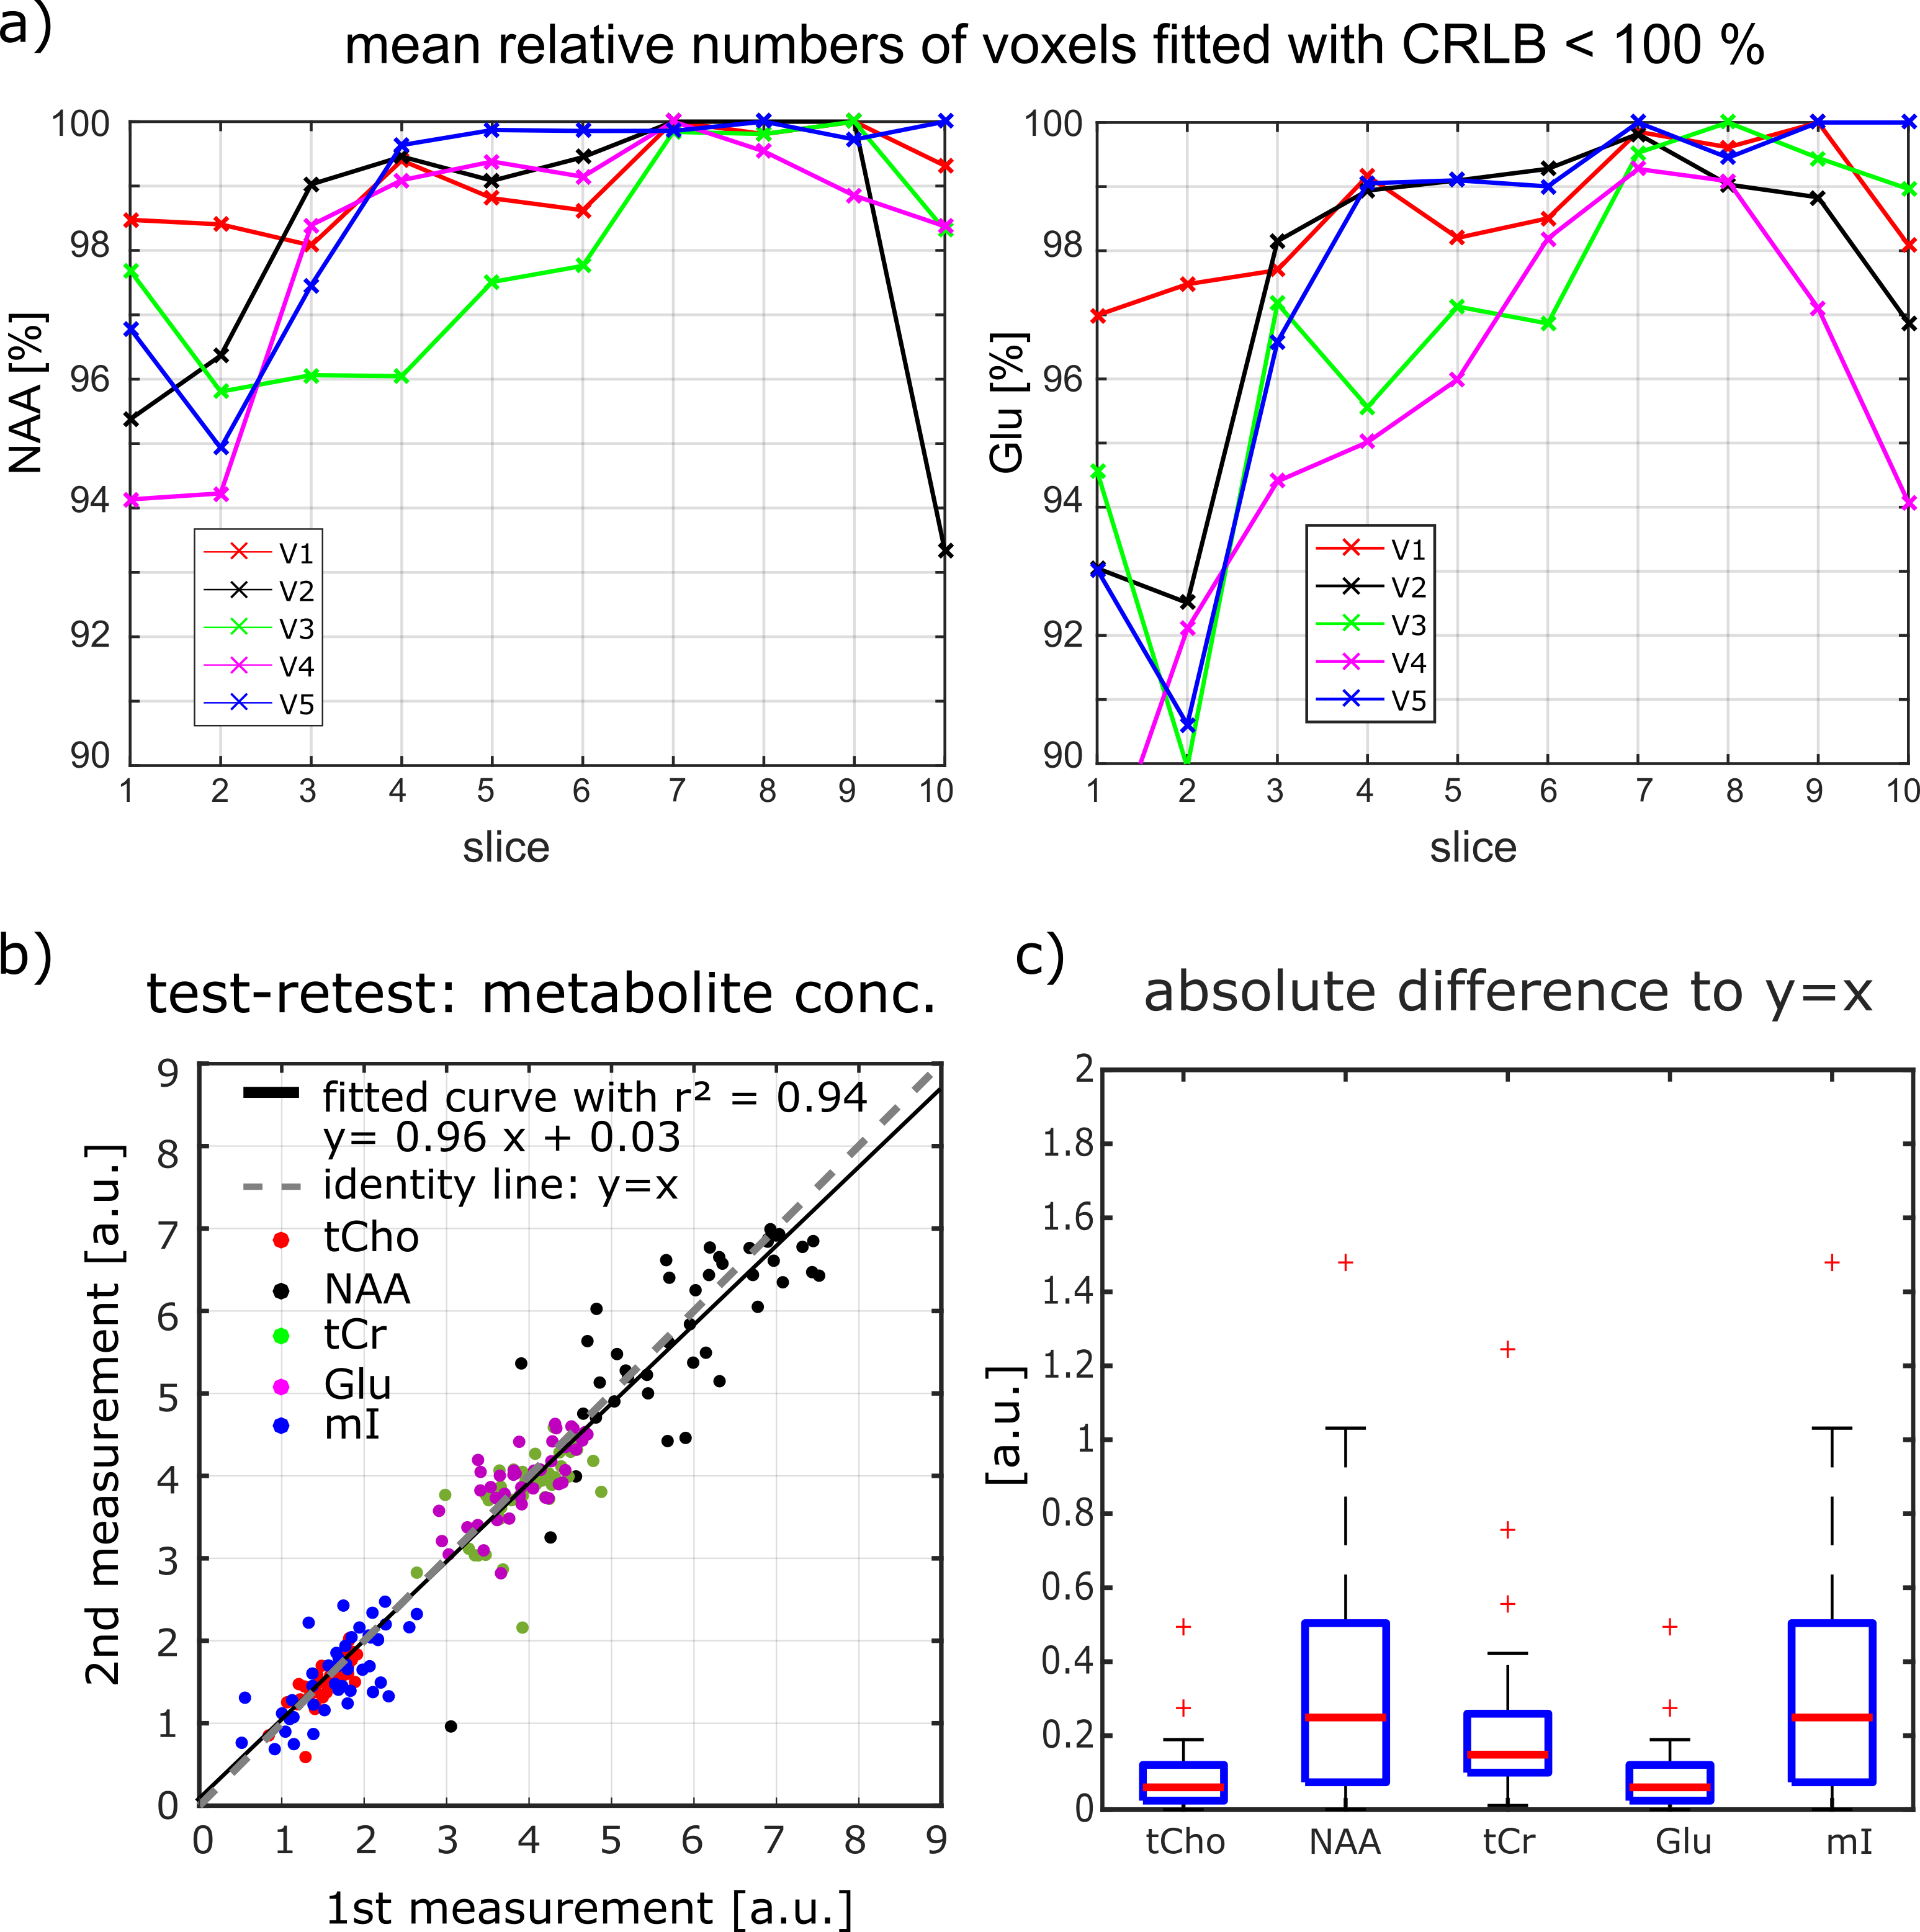
Additionally, 3D concentration maps (Figure 4) visualize the brain coverage achieved in this study for NAA/tCr, tCho/tCr, Glu/tCr and mI/tCr which correspond to anatomically expected concentration differences between gray and white matter. Furthermore, spectral fitting results were analyzed using the mean percentage of brain voxels fitted with a Cramér-Rao lower bound < 100 % for each slice for two selected metabolites, see Figure 5a. A test-retest analysis of mean metabolite concentration of each slice was used to prove the reproducibility of the metabolite concentrations between two measurements of the same volunteer in separate sessions as it is seen in Figure 5b+c.
Discussion
The L1-regularization effectively reduces the lipid contamination. The optimized processing pipeline led to high quality concentration maps for five major metabolites (tCr, NAA, tCho, Glu, mI) with 89 to 97 % coverage of the voxels with nonzero concentration. The reduced information content in the bottom and the top slices can explained by insufficient B0 shimming caused by the nasal sinus. The top slice covered only a small part of the brain and thus, was contaminated by the surrounding scull lipids.The regression line of the test-retest plot shows a curve slope close to 1 which indicates a high reproducibility of the data between two measurements of the same volunteer in separate sessions.
Nonetheless, the time required to acquire 10 fully sampled slices is very long. Motion artifacts can spoil the data. Further acceleration will be needed to make whole brain 1H MRSI at ultra-high field more appropriate for clinical studies. The data presented herein will serve as input for future analyses on the impact of different acceleration methods on the data quality.
Conclusion
In this study, fully sampled multi-slice 1H FID MRSI brain data at 9.4T was acquired with a total volume of of 220x220x80 mm. Data processing, post-processing and LCModel fitting was optimized including a L1-regularization for retrospective lipid removal. Inter- and intrasubject comparisons confirmed the high reproducibility of resulting metabolite maps if the same data acquisition and reconstruction pipeline is used. The metabolite concentration maps show good correspondence to anatomical structure for the major part of the cerebrum for several metabolites.Acknowledgements
Funding by SYNAPLAST (Grant No. 679927 to T.Z., A.M.W., and A.H.) and Cancer Prevention and Research Institute of Texas (CPRIT) (Grant No. RR180056 to A.H.) is gratefully acknowledged.References
1. Roy B, Gupta RK, Maudsley AA, et al. Utility of multiparametric 3-T MRI for glioma characterization. Neuroradiology. 2013. doi:10.1007/s00234-013-1145-x
2. Maudsley AA, Gupta RK, Stoyanova R, et al. Mapping of glycine distributions in gliomas. Am J Neuroradiol. 2014. doi:10.3174/ajnr.A3845
3. Al-Iedani O, Lechner-Scott J, Ribbons K, Ramadan S. Fast magnetic resonance spectroscopic imaging techniques in human brain- applications in multiple sclerosis. J Biomed Sci. 2017. doi:10.1186/s12929-017-0323-2
4. Ding XQ, Maudsley AA, Sabati M, Sheriff S, Dellani PR, Lanfermann H. Reproducibility and reliability of short-TE whole-brain MR spectroscopic imaging of human brain at 3T. Magn Reson Med. 2015. doi:10.1002/mrm.25208
5. Maudsley AA, Domenig C, Govind V, et al. Mapping of brain metabolite distributions by volumetric proton MR spectroscopic imaging (MRSI). Magn Reson Med. 2009. doi:10.1002/mrm.21875
6. Motyka S, Moser P, Hingerl L, et al. The influence of spatial resolution on the spectral quality and quantification accuracy of whole-brain MRSI at 1.5T, 3T, 7T, and 9.4T. Magn Reson Med. 2019. doi:10.1002/mrm.27746
7. Moser P, Bogner W, Hingerl L, et al. Non-Cartesian GRAPPA and coil combination using interleaved calibration data – application to concentric-ring MRSI of the human brain at 7T. Magn Reson Med. 2019. doi:10.1002/mrm.27822
8. Hingerl L, Strasser B, Moser P, et al. Towards Full-Brain {FID}-{MRSI} At 7T With 3D Concentric Circle Readout Trajectories. Proc Jt Annu Meet ISMRM-ESMRMB, Paris, Fr. 2018.
9. Nassirpour S, Chang P, Henning A. Whole Brain High Resolution Metabolite Mapping Using 1H {FID} {MRSI} with Slice-wise B0 Shim Updating at 9.4T. Proc Jt Annu Meet ISMRM-ESMRMB, Paris, Fr. 2018.
10. Klauser A, Strasser B, Thapa B, Lazeyras F, Andronesi O. Achieving High-Resolution Whole-Brain Slab 1H-MRSI with Compressed-Sensing and Low-Rank Reconstruction at 7 Tesla. bioRxiv. 2020. doi:10.1101/2020.05.13.092668
11. Avdievich NI, Giapitzakis IA, Bause J, Shajan G, Scheffler K, Henning A. Double-row 18-loop transceive–32-loop receive tight-fit array provides for whole-brain coverage, high transmit performance, and SNR improvement near the brain center at 9.4T. Magn Reson Med. 2019. doi:10.1002/mrm.27602
12. Chang P, Nassirpour S, Henning A. Highly Accelerated (R=14) Water Reference Acquisition for High Resolution 1H MRSI using Compressed Sensing. In: Joint Annual Meeting ISMRM-ESMRMB 2018. ; 2018.
13. Nassirpour S, Chang P, Avdievitch N, Henning A. Compressed sensing for high-resolution nonlipid suppressed 1H FID MRSI of the human brain at 9.4T. Magn Reson Med. 2018. doi:10.1002/mrm.27225
14. Bilgic B, Chatnuntawech I, Fan AP, et al. Fast image reconstruction with L2-regularization. J Magn Reson Imaging. 2014;40(1):181-191. doi:10.1002/jmri.24365
Figures