2003
ORYX-MRSI: A data analysis software for multi-slice 1H-MRSI1Biomedical Engineering Institution, Bogazici University, Istanbul, Turkey
Synopsis
Oryx-MRSI is a fully automated software for a comprehensive analysis of multi-slice proton magnetic resonance spectroscopic imaging (1H-MRSI) data. Oryx-MRSI functionality includes chemical shift correction, segmentation, registration, cerebrospinal fluid (CSF) fraction corrected metabolite map generation, registration of metabolite maps onto MNI152 brain atlas, and ROI analysis for metabolite concentration and ratio estimation at brain parcellations defined by resting state fMRI.
Introduction
Proton magnetic resonance spectroscopic imaging (1H-MRSI enables a detailed evaluation of brain metabolism in multiple voxels. Although there are some available programs 1-5 for post-processing and analysis of MR spectroscopic data, there isn’t a comprehensive 1H-MRSI data analysis software that has a pipeline including chemical shift correction, segmentation, metabolite maps generation while taking into account full width at half maximum (FWHM), signal to noise ratio (SNR) and Cramer-Rao lower bounds (CRLB), cerebrospinal fluid (CSF) fraction correction, registration into MNI152 brain atlas, and region of interest (ROI) analysis at multiple brain regions. The aim of this work is to create a fully automated software, named Oryx-MRSI, which has a comprehensive data analysis pipeline for multi-slice 1H-MRSIwith a user-friendly graphical user interface.Methods
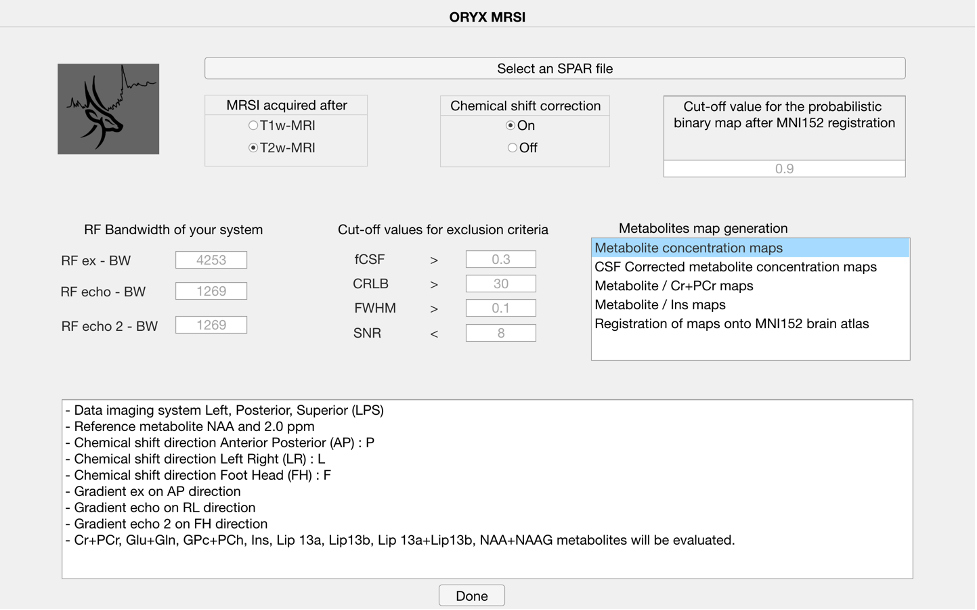
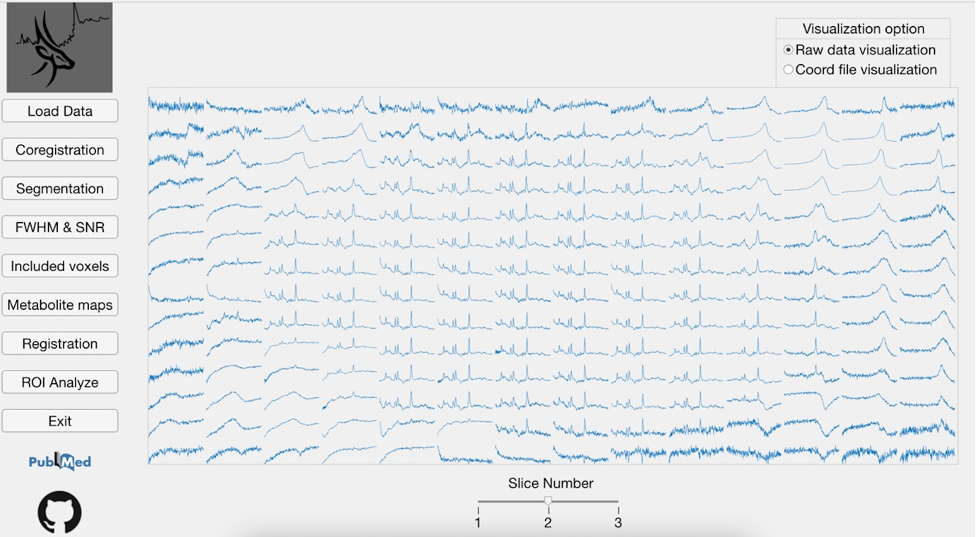
Oryx-MRSI was programmed in MATLAB 2020a (The Mathworks Inc., Natick, MA). The software asks for some parameters before the data analysis, including RF bandwidth of the system for chemical shift correction, cut-off values for voxel exclusion criteria based on FWHM, SNR and CRLB, and cut-off value for the probabilistic binary map after the registration onto MNI152 brain atlas (Figure 1). Oryx-MRSI has eight different modules.1. Load Data – This module reads the raw 1H-MRSI data, LCModel .table output files, and a skull stripped T1-weighted or T2-weighted MRI, and allows for a visualization of the spectra (Figure 2).
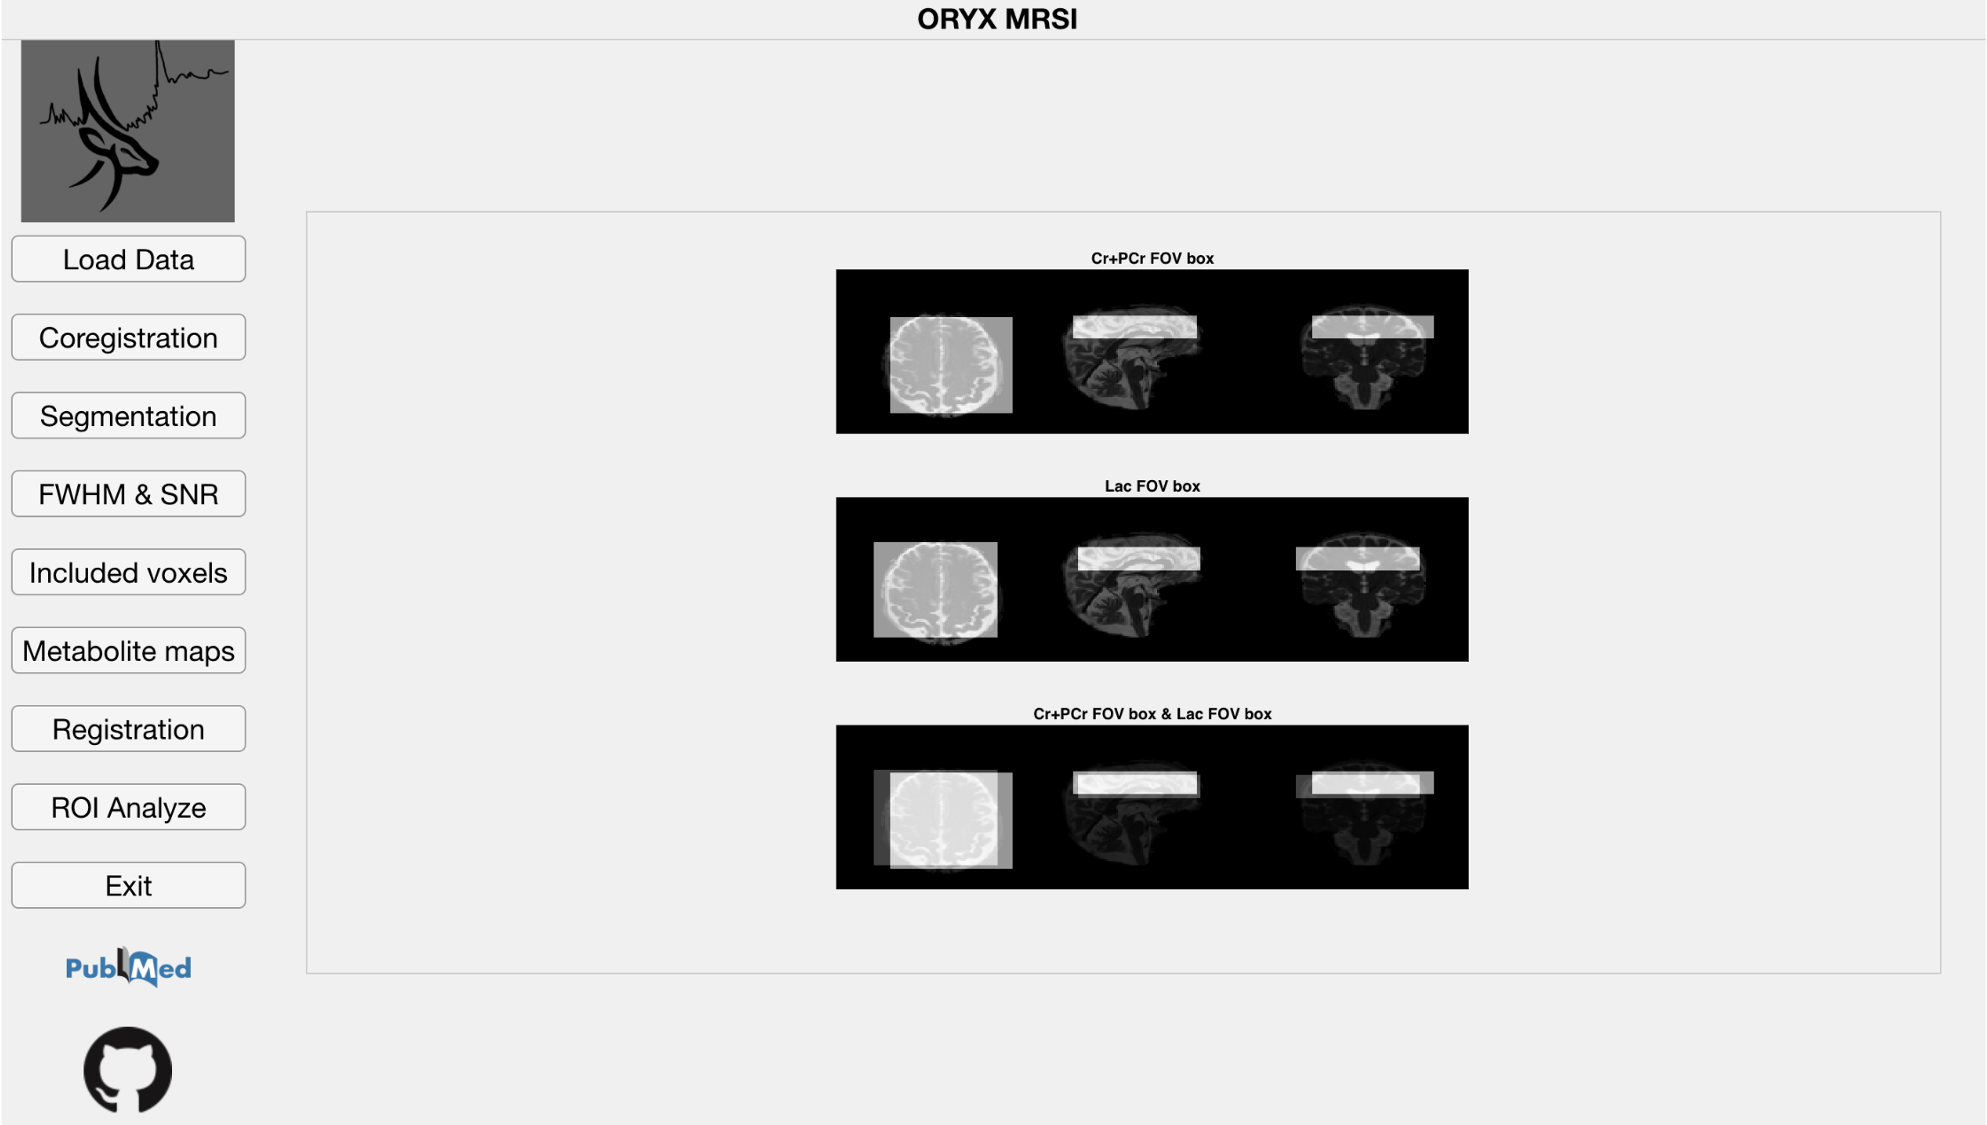
2. Co-registration – If chemical shift correction is ON, then the chemical shift misregistration amount is calculated for each metabolite using the NAA frequency as the reference 6 and RF pulse bandwidths for each direction provided on the Main Page (Figure 1). Then, a metabolic map is shifted into its respective location considering the MR image space data order. Afterwards, the field of view (FOV), the PRESS box, and each voxel within the FOV are co-registered onto anatomical MR image for each metabolite map followed by the visualization of the shifted metabolite maps (Figure 3).
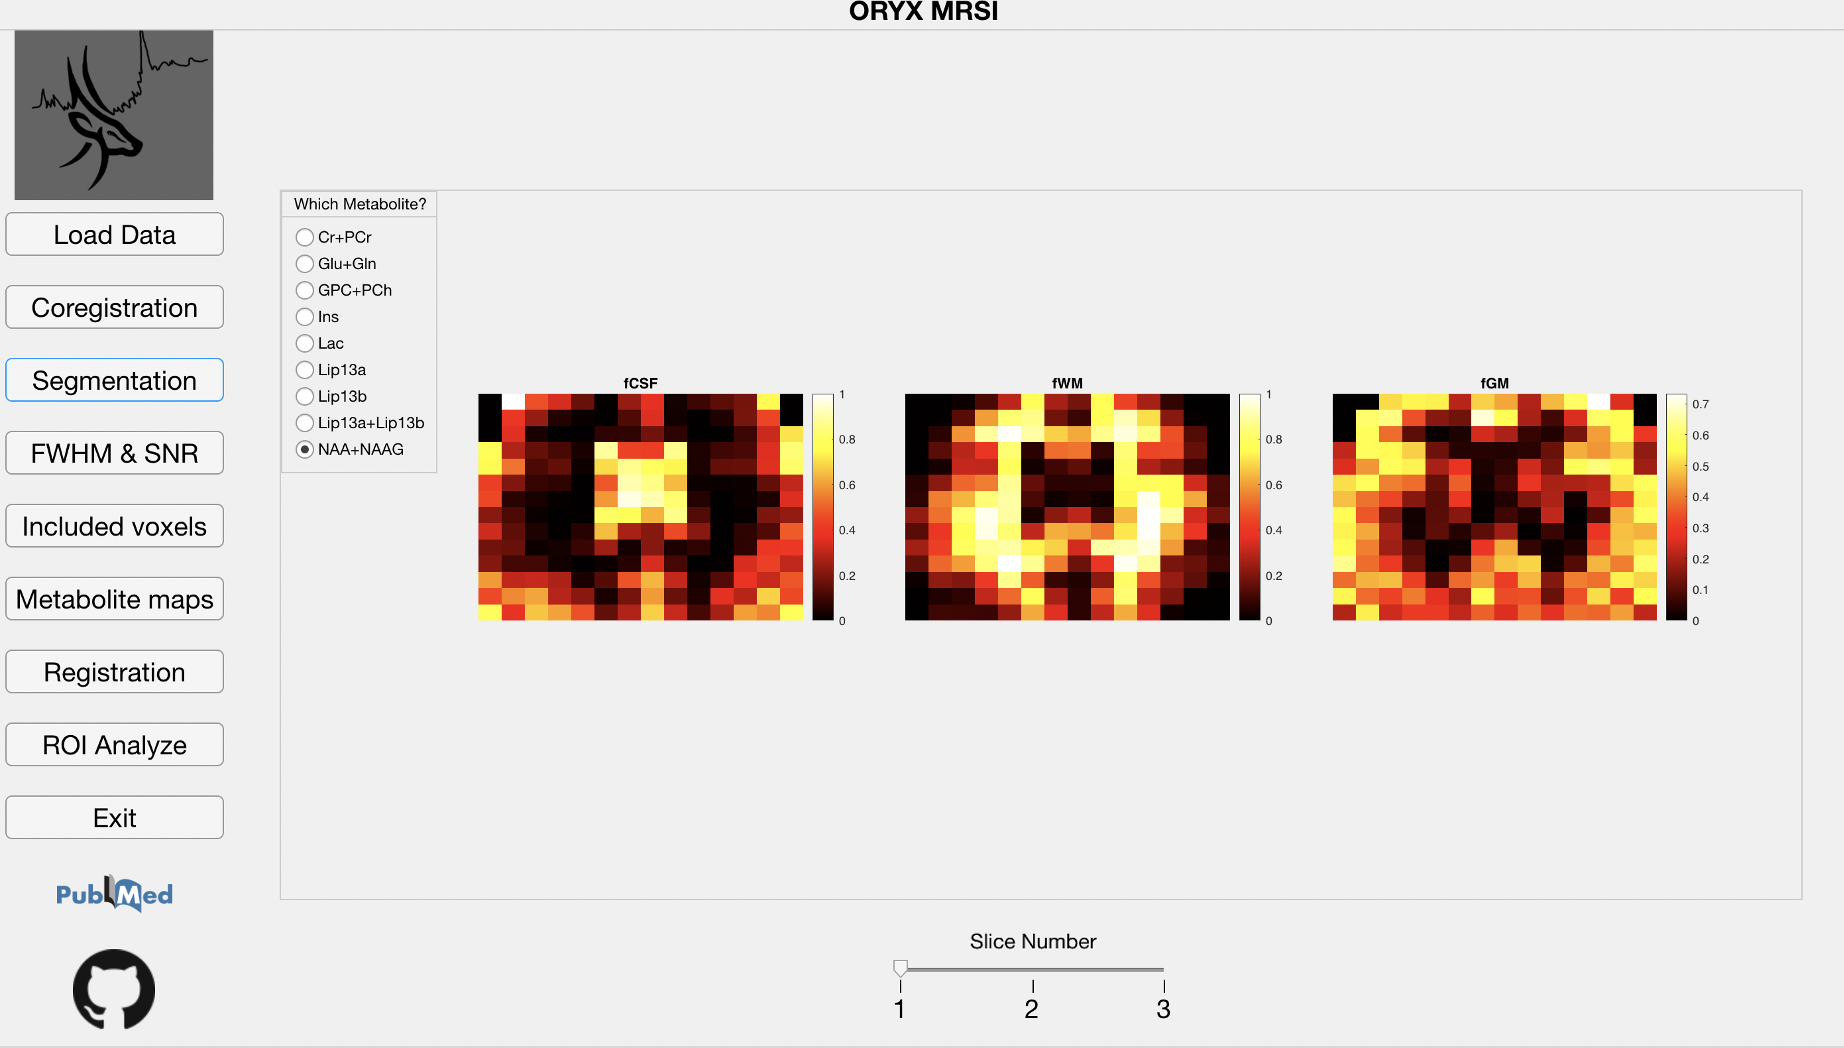
3. Segmentation – After white matter (WM), gray matter (GM), and cerebrospinal fluid (CSF) are segmented from a T1-weighted MRI using SPM12 (https://www. fil.ion.ucl.ac.uk/spm/), the module calculates the WM, GM and CSF fractions (fWM, fGM, and fCSF) in each voxel for every metabolite, which vary due to chemical shift misregistration. This module uses some functions from FID-A 7, Gannet 8 and Osprey [3]. Figure 4 shows the fCSF, fWM and fGM maps for a selected metabolite (NAA+NAAG) at one slice.
4. FWHM&SNR – This module reads LCModel .table files to get FWHM and SNR values of each voxel to create and visualize multivoxel FWHM and SNR maps.
5. Included voxels – This module displays voxels included in the 1H-MRSI data analysis for each metabolite after the FWHM, SNR, CRLB, and fCSF exclusion criteria defined on the Main Page are applied.
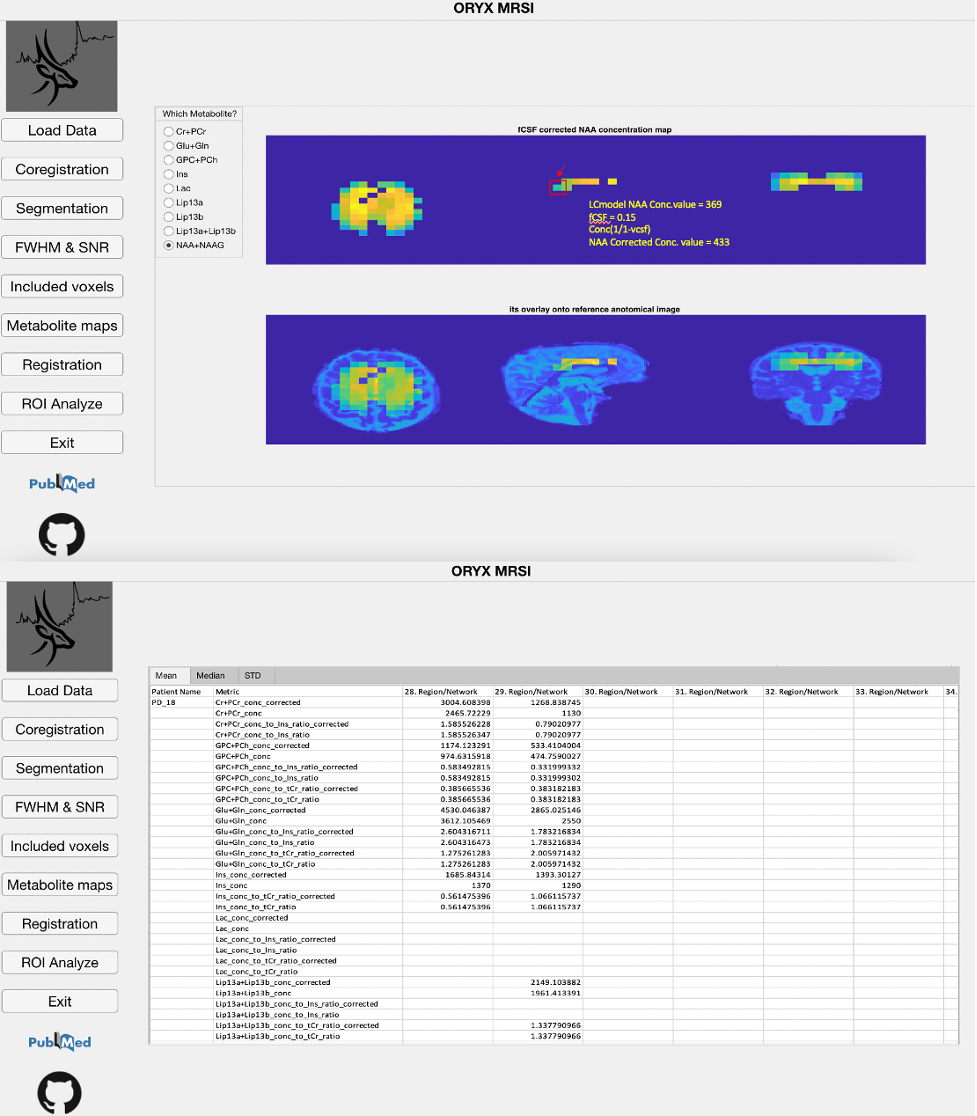
6. Metabolite map - The LCModel .table files are parsed using a text reader and each metabolite result is positioned into a 3D grid in accordance with the MR image space data to create several maps, which are the concentration, CSFcorrected concentration (C=C0*(1/(1-fCSF))), and concentration or CSF corrected concentration to Ins and Cr+PCr ratio maps (Figure 5a). Currently, these maps are created for nine different metabolites, which are Cr+PCr, Glu+Gln, GPC+PCh, Ins, Lac, Lip13a, Lip13b, Lip13a+Lip13b.
7. Registration- This modules registers the reference anatomical MRI onto MNI152 brain atlas using FMRIB’s Linear Image Registration Tool (FSL FLIRT) 9 to obtain a transformation matrix. Then, this transformation matrix is used to register the PRESS box and all the concentration or ratio maps that were previously co-registered to the anatomical MRI onto the MNI152 brain atlas 10. The user provides a cutoff value for the probabilistic maps, (Main Page, Fig. 1), which are produced as a result of registration, and all the pixels that exceed this threshold are included in the data analysis.
8. ROI Analysis - The metabolic maps are currently evaluated at 400 brain parcellations defined on 17 resting state functional MRI (rs-fMRI) networks 11 to define a mean, median and standard deviation value of the concentration map of interest at these brain regions (Figure 5b). A result is produced for a parcellation if only more than 30% of its pixels are included within the metabolite map of interest.
Results
A representative CSF corrected NAA+NAAG metabolite map along with its overlay onto a T2w MRI data, and ROI analysis results of an example dataset are shown in Figure 5.Discussion
Oryx-MRSI is a fully automated and user-friendly multi-slice 1H-MRSI data analysis software, which includes several new functionality, including chemical shift correction, CSF corrected metabolite map generation, registration of metabolite maps onto MNI152 brain atlas, and ROI analysis at brain parcellations defined by resting state fMRI. The Oryx-MRSI will soon be publicly available at https://github.com/sevimcengiz/Oryx-MRSI, and it will be continuously updated to include new modules, support for different MR vendors, and possible integration with earlier MRS data analysis tools, like Osprey.Acknowledgements
This project was funded by TUBITAK 115S219.References
1. Clarke WT, Stagg CJ, Jbabdi S. FSL-MRS: An end-to-end spectroscopy analysis package.Magn Reson Med, 2020.
2. Graveron-Demilly D. Quantification in magnetic resonance spectroscopy based on semi-parametric approaches. MAGMA, 2014;27(2):113-30.
3. Oeltzschner G, et al. Osprey: Open-source processing, reconstruction & estimation of magnetic resonance spectroscopy data. J Neurosci Methods, 2020:343:108827.
4. Provencher SW. Estimation of metabolite concentrations from localized in vivo proton NMR spectra.Magn Reson Med, 1993; 30(6):672-9.
5. Wilson M, et al. A constrained least-squares approach to the automated quantitation of in vivo (1)H magnetic resonance spectroscopy data. Magn Reson Med, 2011;65(1):1-12.
6. Ozturk-Isik E, et al. Unaliasing lipid contamination for MR spectroscopic imaging of gliomas at 3T using sensitivity encoding (SENSE). Magn Reson Med, 2006;55(5):1164-9.
7. Simpson R, et al. Advanced processing and simulation of MRS data using the FID appliance (FID-A)-An open source, MATLAB-based toolkit. Magn Reson Med, 2017;77(1):23-33.
8. Edden RA, et al. Gannet: A batch-processing tool for the quantitative analysis of gamma-aminobutyric acid-edited MR spectroscopy spectra. J Magn Reson Imaging, 2014;40(6):1445-52.
9. Jenkinson M, Smith S. A global optimisation method for robust affine registration of brain images.Med Image Anal, 2001;5(2):143-56.
10. Mazziotta JC, et al. A probabilistic atlas of the human brain: theory and rationale for its development. The International Consortium for Brain Mapping (ICBM). Neuroimage, 1995;2(2):89-101.
11. Schaefer A, et al. Local-Global Parcellation of the Human Cerebral Cortex from Intrinsic Functional Connectivity MRI. Cereb Cortex, 2018;28(9):3095-3114.
Figures