2001
Magnetic Resonance Imaging and Spectroscopy in Late-Onset GM2-Gangliosidosis1Athinoula A. Martinos Center for Biomedical Imaging, Department of Radiology, Massachusetts General Hospital and Harvard Medical School, Charlestown, MA, United States, 2Movement Disorders Division and Ataxia Center, Department of Neurology, Massachusetts General Hospital and Harvard Medical School, Boston, MA, United States, 3Center for Rare Neurological Diseases, Department of Neurology, Massachusetts General Hospital and Harvard Medical School, Boston, MA, United States, 4Harvard-Massachusetts Institute of Technology Health Sciences & Technology, Cambridge, MA, United States, 5Leukodystrophy Clinic, Department of Neurology, Massachusetts General Hospital and Harvard Medical School, Boston, MA, United States
Synopsis
Late-onset GM2-Gangliosidoses (LOGG) are rare lysosomal storage disorders with slowly progressing neurological symptoms that encompass late-onset Tay-Sachs disease (LOTS) and Sandhoff disease (LOSD). We performed sMRI-MRS to discern how cerebellar aberrations may relate to underlying metabolic abnormalities, and their relationships to clinical presentations. Results revealed that structural and metabolic differences between LOTS patients and controls were more prominent than the collective group of LOGG patients vs. controls. Significant clinical associations with imaging-markers also differed when LOTS patients were analyzed separately versus in conjunction with LOSD patients. While LOSD could not be accurately assessed, it appeared to be distinct from LOTS.
Introduction
Late-onset GM2-Gangliosidoses (LOGG) are rare lysosomal storage disorders that encompass late-onset Tay-Sachs disease (LOTS) and Sandhoff disease (LOSD).1 LOGG presents with slowly progressive neurological symptoms including ataxia, weakness, cognitive dysfunction, and neuropsychiatric symptoms.2 Structural magnetic resonance imaging (sMRI) of the brain in LOGG, especially LOTS, has demonstrated cerebellar atrophy,2-4 but it has yet to be quantified and inconsistently predicts clinical dysfunction.2 Proton magnetic resonance spectroscopy (1H-MRS) reports5-8 of LOGG patients are sparse but have shown lower levels of N-acetylaspartate and choline and higher levels of myo-inositol in the cerebellum. Utilizing sMRI and single-voxel MRS, we endeavored to better understand how quantified neuroanatomical aberrations may relate to underlying metabolic abnormalities in the cerebellum and their distinct relationships to clinical presentations. Our secondary aim was to elucidate the heterogenous nature of LOGG by accounting for potential differences in LOTS and LOSD.Methods
Participants: study population included 10 patients with genetically confirmed LOGG (7 LOTS, 3 LOSD) who underwent a neurological assessment and 7 age-matched controls (Table 1). Disease severity was assessed with the LOTS Severity Scale,9 the Brief Ataxia Rating Scale (BARS),10 the Friedreich Ataxia Rating Scale (FARS),11 the Scale for the Assessment and Rating of Ataxia (SARA),12 the Epworth Sleepiness Scale,13 and the Cerebellar Cognitive Affective Syndrome Scale (CCAS).14sMRI-1H-MRS: performed on a 3T Magnetom Tim Trio Siemens scanner using a 32-channel receive coil. A 3D T1-weighted MPRAGE image was acquired with the following parameters: TR=2530ms, inversion time=1200ms, TE=1.64ms, flip angle=7o, FOV=256×256 mm2, number of slices=176, voxel size=1×1×1 mm3. A 1H-MRS volume of interest was placed in the cerebellar vermis (2×2×2 cm3).
Data-processing: each MPRAGE image was processed with “recon-all” in FreeSurfer v7.1.0.15 Segmented volumes were normalized by total intracranial volume. MR spectra were processed and fitted with LCModel v6.3. Metabolites included N-acetylaspartate (NAA), choline (Cho), myo-inositol (mI), creatine (Cr) and glutamate-glutamine (Glx). Results were corrected for partial-volume effects and reported reference to water. ANCOVAs were conducted in MATLAB to compare structural and spectroscopy measures in these groups, controlled for age: i) all patients (10) vs. all controls (7) and ii) LOTS patients (7) vs. controls (7). Comparing LOTS (7) vs. LOSD (3) was of interest, but the LOSD sample size was too small despite visual neuroanatomical differences. For clinical correlations, partial correlations were performed in R-Studio with age as a regressor of no interest since LOSD patients were older. The FDR method was used across analyses to correct for multiple comparisons (p<0.05).
Results
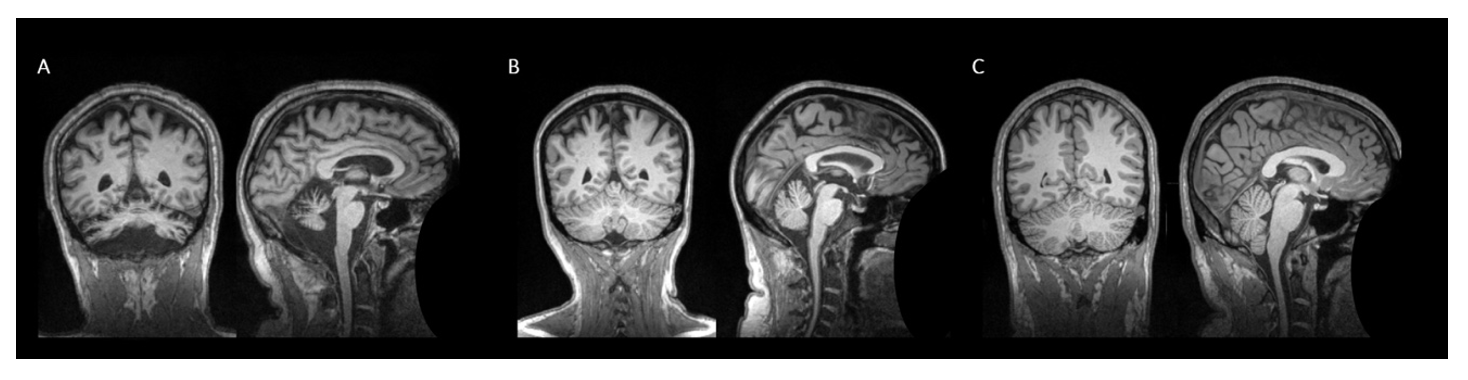
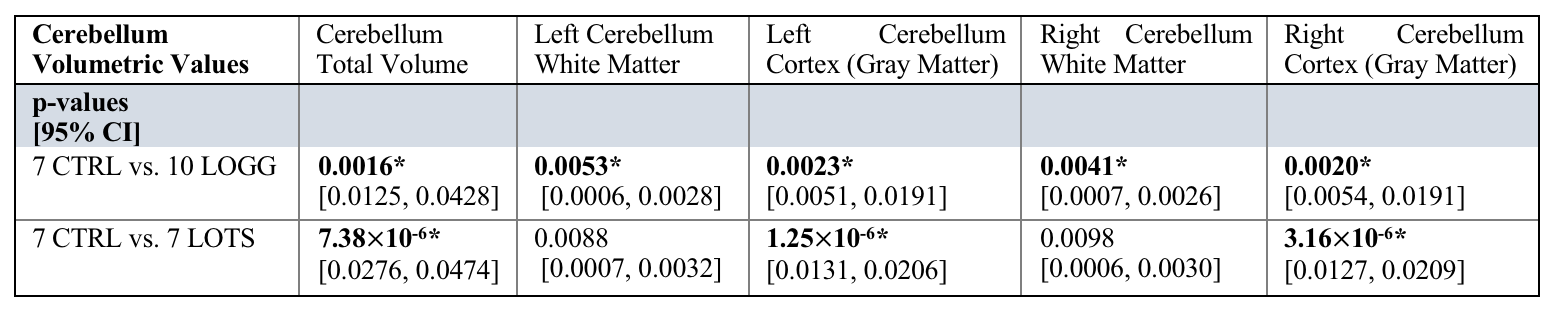
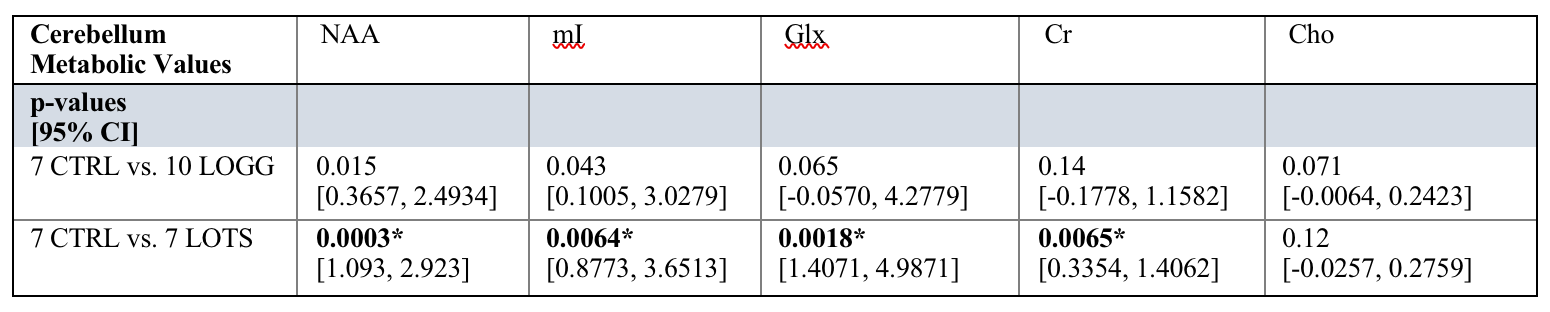
No participants were discarded from the sMRI or MRS analyses based on image quality. Structural analyses revealed significant atrophy of the cerebellum (Figure 1) in the LOGG cohort (n=10, LOTS + LOSD) (p=0.0016), which was primarily driven by LOTS patients (n=7) (p=7.38×10⁻⁶) (Table 2). With MRS, NAA was lower (p=0.015) and mI higher (p=0.043) in LOGG patients, but significantly driven by LOTS patients (p=0.00029 and p=0.0064, respectively) (Table 3). LOTS patients also drove creatine (p=0.0065) and Glx (p=0.0018) decreases. There was a significant correlation between SARA and total cerebellar volume amongst LOGG patients (R= -0.72, p=0.028), which was stronger amongst just the LOTS cohort (R=-0.91, p=0.011). In only LOTS, total cerebellar volume also significantly correlated with the FARS (R= -0.91, p=0.012) and BARS (R= -0.82, p=0.047) ataxia scales. NAA in the cerebellum of LOGG patients negatively correlated with the FARS (R= -0.75, p=0.020), BARS (R= -0.74, p=0.022) and SARA (R= -0.85, p=0.0036). Cerebellar mI showed an association with SARA amongst the LOGG cohort (R=0.70, p=0.036), which remained trending after FDR correction. When assessing only LOTS patients, only NAA was significantly associated with SARA (R= -0.82 p=0.048).Discussion
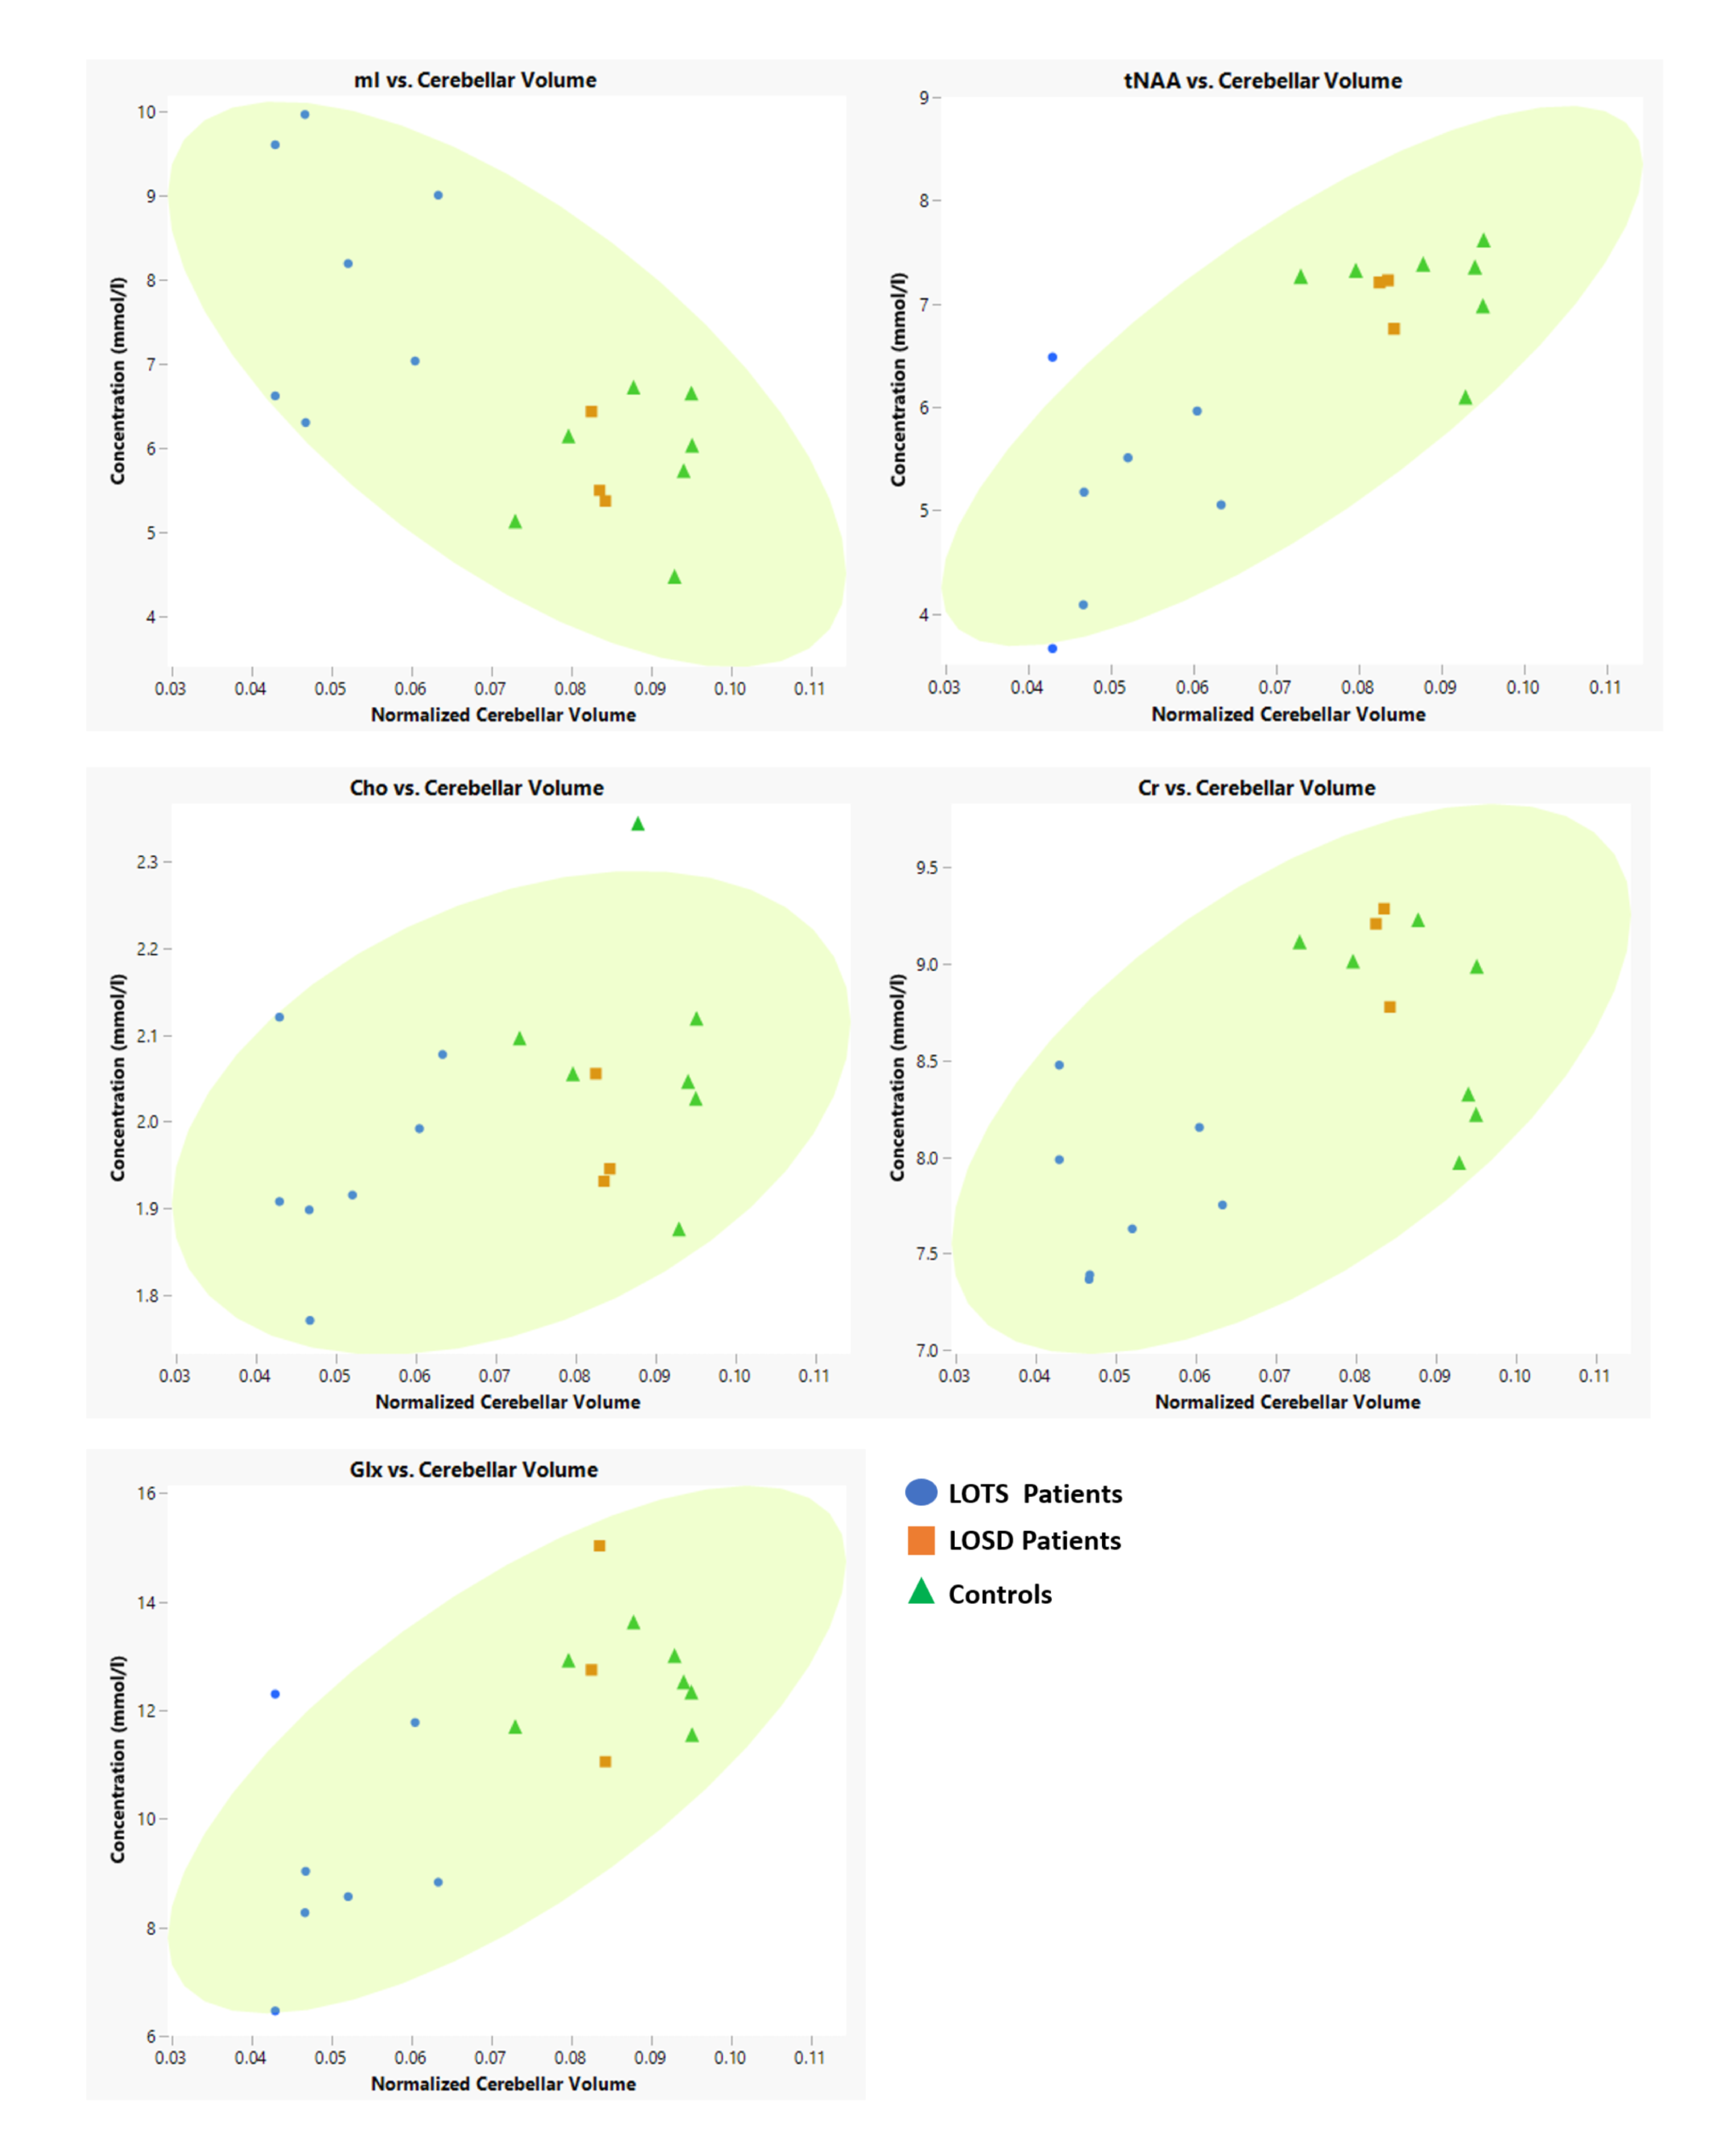
We identified several cerebellar metabolic abnormalities amongst structural aberrations in LOGG. Quantifying cerebellar atrophy in LOGG may lead to improvements in assessing disease severity, progression, and pharmacological efficacy. The LOSD patients in this study did not have evidence of the cerebellar phenotype16 which may explain the clear separation between LOTS and LOSD patients across findings (Figure 2). Decreased NAA and elevated mI in the cerebellum of LOGG compared to controls was driven solely and significantly by the LOTS cohort. Therefore, not only is cerebellar atrophy occurring, but decreased NAA suggests that LOTS patients also experienced impaired neuronal function and/or decreased neuronal density in the cerebellum. Other metabolic findings may reflect altered energy metabolism, neuronal loss, and/or neuroinflammation in LOTS. While between-group results were more noticeable in the sMRI analyses for LOGG, the metabolite NAA more strongly correlated to SARA scores (which focuses mainly on gait and posture). Metabolic findings more broadly encompassed clinical ataxic functioning for LOGG through its additional significant associations to the FARS (which also includes neuromuscular features) and BARS (which also includes eye movements). Meanwhile, structural findings may indicate that cerebellar atrophy more appropriately reflects ataxic symptoms in LOTS, rather than LOSD due to significant associations to all three assessments.Conclusion
Overall, these clinical ataxic deficits seem to be driven by a combination of neuroinflammation (mI), neuronal injury/loss (NAA), and volumetric atrophy in the cerebellum. Future studies should proceed with delineating the LOGG population and incorporating sMRI and MRS in tandem to appropriately depict the individual heterogenous presentations of LOTS and LOSD and more accurately define underlying neuroimaging characteristics.Acknowledgements
This study was supported by the National Tay-Sachs & Allied Diseases Association Inc., the NIH-NIBIB National Institute of Biomedical Imaging and Bioengineering (grant no. R00EB016689 and R01EB027779), and Sanofi US Services Inc. We also thank the Laboratory for Computational Neuroscience at the Athinoula A. Martinos Center for Biomedical Imaging for contributing helpful discussions that related to FreeSurfer version 7.10.
References
1. Gravel, R. A. et al. The GM2 Gangliosidoses. in The Online Metabolic and Molecular Bases of Inherited Diseases (eds. Valle, D. et al.) 3827–3876 (McGraw-Hill, 2014).
2. Masingue, M. et al. Natural History of Adult Patients with GM2 Gangliosidosis. Ann. Neurol. 87, 609–617 (2020).
3. Hund, E.; Grau, A.; Fogel, W.; Forsting, M.; Cantz, M.; Kustermann-Kuhn, B.; Harzer, K.; Navon, R.; Goebel, HH.; Meinck, H.-M. Progressive cerebella ataxia, proximal neurogenic weakness and ocular motor disturbances: hexosaminidase A deficiency with late clinical onset in four siblings. J. Neurol. Sci. 145, 25–31 (1997).
4. Jahnová, H. et al. Amyotrophy, cerebellar impairment and psychiatric disease are the main symptoms in a cohort of 14 Czech patients with the late-onset form of Tay–Sachs disease. J. Neurol. 266, 1953–1959 (2019).
5. Jamrozik, Z. et al. Late onset GM2 gangliosidosis mimicking spinal muscular atrophy. Gene 527, 679–682 (2013).
6. Gagoski, B. A. & Eichler, F. S. Regional Neuroaxonal Injury Detected by 1H 3 Tesla Spectroscopic Imaging in Late-Onset Tay-Sachs.
7. Pretegiani, E. et al. Pendular nystagmus, palatal tremor and progressive ataxia in GM2-gangliosidosis. Eur. J. Neurol. 22, 67–69 (2015).
8. Inglese, M. et al. MR imaging and proton spectroscopy of neuronal injury in late-onset GM2 gangliosidosis. Am. J. Neuroradiol. 26, 2037–2042 (2005).
9. Elstein, D. et al. Neurocognitive testing in late-onset Tay-Sachs disease: A pilot study. J. Inherit. Metab. Dis. 31, 518–523 (2008).
10. Schmahmann, J. D., Gardner, R., MacMore, J. & Vangel, M. G. Development of a brief ataxia rating scale (BARS) based on a modified form of the ICARS. Mov. Disord. 24, 1820–1828 (2009).
11. Subramony, S. H. et al. Measuring Friedreich ataxia: Interrater reliability of a neurologic rating scale. Neurology 64, 1261–1262 (2005).
12. Schmitz-Hübsch, T. et al. Scale for the assessment and rating of ataxia. Neurology 66, 1717–1720 (2006).
13. Johns, M. W. A new method for measuring daytime sleepiness: The Epworth sleepiness scale. Sleep 14, 540–545 (1991).
14. Schmahmann, J. D. & Sherman, J. C. The cerebellar cognitive affective syndrome. Brain 121, 561–579 (1998).
15. Fischl, B. et al. Whole Brain Segmentation: Automated Labeling of Neuroanatomical Structures in the Human Brain. Neuron 33, 341–355 (2002).
16. Stephen, C. D. et al. Quantitative oculomotor and nonmotor assessments in late-onset GM2 gangliosidosis. Neurology 94, 705–717 (2020).
Figures
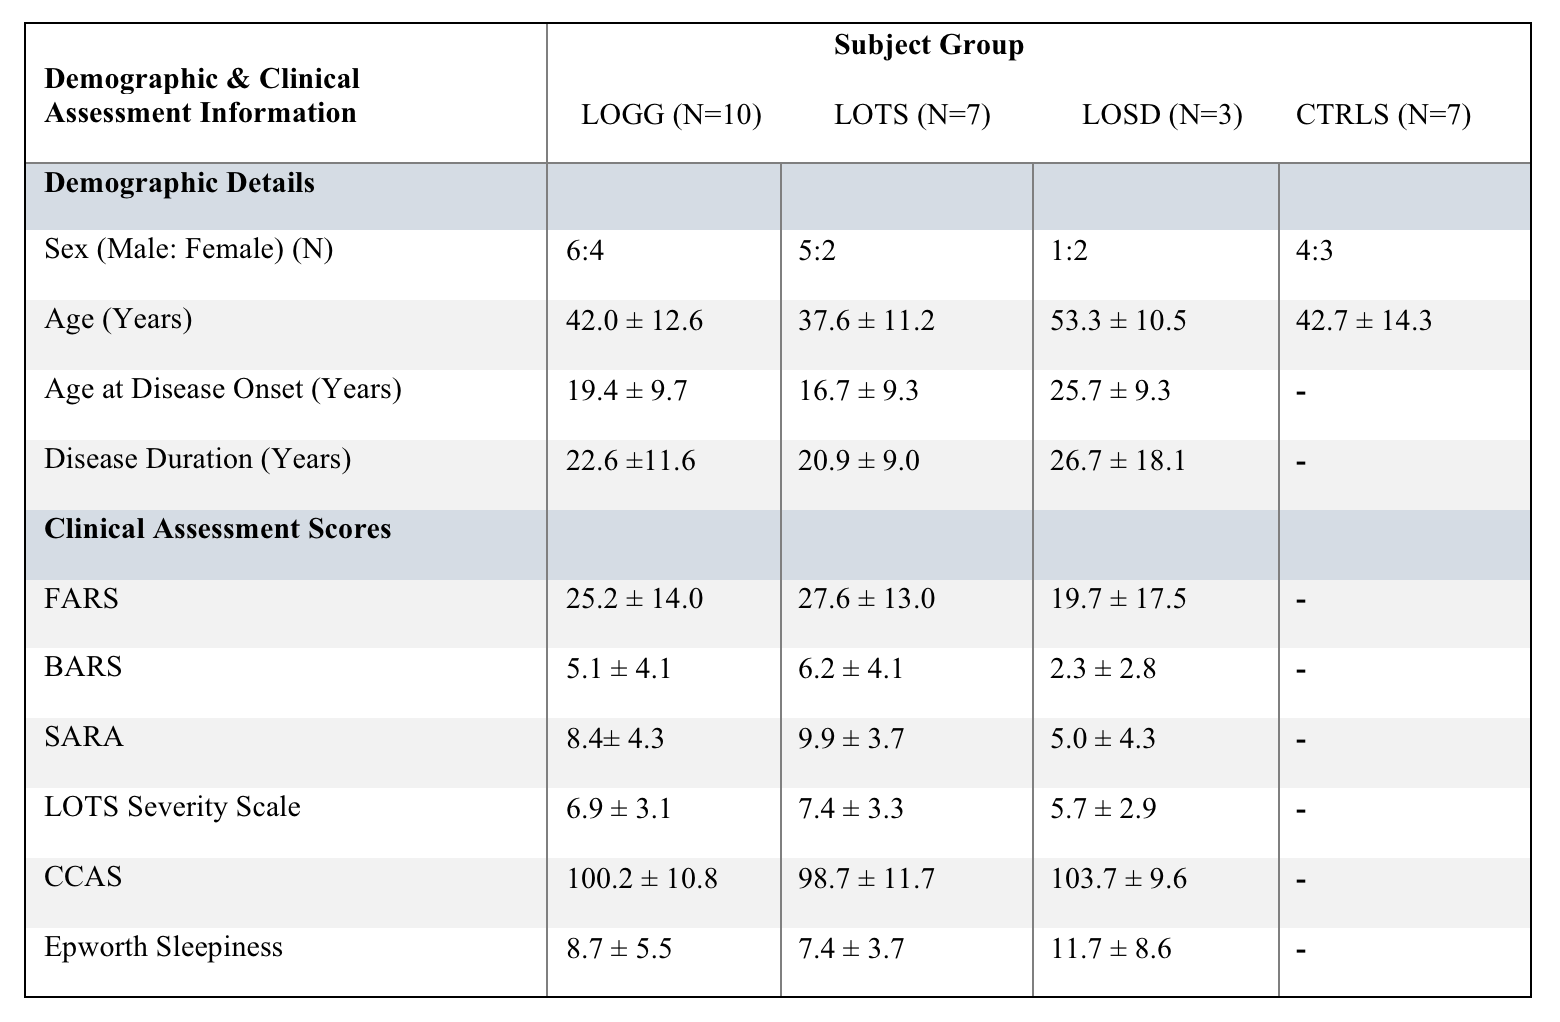
Table 1: Participant demographics and clinical assessment scores reported as mean ± standard deviation.