1998
SNR-Enhancing Reconstruction for Multi-TE MRSI Using a Learned Nonlinear Low-dimensional Model1Department of Bioengineering, University of Illinois Urbana-Champaign, Urbana, IL, United States, 2Beckman Institute for Advanced Science and Technology, University of Illinois Urbana-Champaign, Urbana, IL, United States
Synopsis
We report a new method for SNR-enhancing reconstruction of multi-TE MRSI data. Specifically, we designed a deep complex convolutional autoencoder (DCCAE) to learn a nonlinear low-dimensional model of the high-dimensional multi-TE spectra which allowed for effective separation of molecular signals and noise. A constrained reconstruction formulation is used to incorporate the learned model for denoising spatial-temporal reconstruction. The performance of the learned model and the proposed reconstruction method have been evaluated using both simulation and experimental multi-TE $$$^1$$$H-MRSI data. Results obtained demonstrate superior denoising performance achieved by the proposed method over alternative spatial-spectrally constrained denoising strategies.
Introduction
Multi-TE MRSI offers improved molecular detection and quantification by encoding the J-coupling effects of metabolites using varying TEs. It also allows for the determination of relaxation parameters of different molecules that can serve as additional disease biomarkers$$$^{1-2}$$$. However, the additional TE dimension further limits the spatial resolution and SNR tradeoffs within practical imaging time, and data acquired at longer TEs suffer additional SNR loss, making quantitative analysis more difficult. While many methods have been proposed to improve the SNR for single-TE MRSI$$$^{3-12}$$$, including various transforms along the temporal/spectral domain$$$^{3-4}$$$, spatial-spectral constrained reconstruction$$$^{5-6}$$$, and low-rank filtering$$$^{7-9}$$$, limited efforts have been spent on multi-TE MRSI denoising. Low-dimensional subspaces exploiting the linear predictability and partial separability of MRSI data can be used to denoise individual TEs in the multi-TE data. But these strategies will not fully exploit the inherent correlations across TEs for maximized noise reduction and signal preservation$$$^{10-12}$$$. We present here a novel method to improve the SNR of multi-TE MRSI using a learned low-dimensional model. Specifically, we proposed to use a deep complex convolutional autoencoder (DCCAE) $$$^{13}$$$ to learn a nonlinear low-dimensional model of the multi-TE spectra with improved representation efficiency than existing linear low-dimensional models (subspaces), and a regularized reconstruction formulation to incorporate the learned model for SNR-enhancing reconstruction. The effectiveness of the proposed method has been evaluated using simulated and experimental data, demonstrating superior denoising performance over alternative methods.Proposed Method
Learning a low-dimensional representation for multi-TE MRSILearned nonlinear models that exploit the inherent signal structures of MRSI data have been proposed recently for improved MRSI reconstruction and signal separation$$$^{14-15}$$$. We extend such an approach to multi-TE data here. Specifically, multi-TE 1H-MRSI signals can generally be modeled as:
$$s(t,T_E)=\sum_{m=1}^{M}c_me^{i\alpha_m}e^{-T_E/T_{2,m}}e(t,\boldsymbol{\theta}_m)\phi_m(t,T_E)+\sum_{n=1}^{N}b_ne^{i\alpha_n}e^{-T_E/T_{2,n}}M_n(t,\boldsymbol{\beta}_{n,T_E}) \quad [1]$$
where the first term models the metabolites signal and the second term the macromolecules, respectively; $$$c_m$$$ denotes the concentration, $$$\alpha_m$$$ the phases, $$$\phi_m\left(t,T_E\right)$$$ the TE-dependent metabolite basis and $$$e\left(t,\boldsymbol{\theta}_m\right)$$$ captures remaining spectral variation for the $$$m$$$-th molecule parameterized by $$$\boldsymbol{\theta}_m$$$ (e.g., $$$T_2^\ast$$$ and $$$\delta f$$$). For the macromolecules, $$$b_n$$$, $$$\alpha_n$$$, and $$$M_n\left(t,\boldsymbol{\beta}_{n,T_E}\right)$$$ represent the concentration, phases, and spectral priors (e.g., lineshapes and frequencies) for the $$$n$$$-th macromolecule peak. Eq. [1] implies that the multi-TE signals should reside in a nonlinear low-dimensional manifold. We proposed here a DCCAE to extract this low-dimensional representation from the high-dimensional multi-TE spectra (Fig.1). More specifically, this network has several new features compared to prior work: (1) Convolutional layer was used for automatic feature extraction and to exploit the correlation across TEs by treating individual TEs as different input channels of the network; (2) Fully connected layers were coupled with the convolutional layer to further extract the low-dimensional features; (3) Instead of processing real and imaginary parts of the data separately as most existing methods, we used complex-valued units and activation functions to handle the complex MRSI data directly. Figure 1 illustrates the proposed network structure and training strategy. To train the proposed network, training data was generated using Eq. [1] with $$$\phi_m\left(t,T_E\right)$$$ from quantum-mechanical simulations (can be adapted to any sequence), and other parameters (e.g., $$$c_m$$$, $$$\alpha_m$$$, $$$T_{2,m}$$$, $$$\boldsymbol{\theta}_m$$$, $$$b_n$$$, $$$\alpha_n$$$, $$$T_{2,n}$$$, and $$$\boldsymbol{\beta}_{n,T_E}$$$ ) randomly sampled from distributions constructed using literature and experimental values$$$^{15-18}$$$. Training was performed using a PyTorch implementation using the Adam optimizer and MSE loss.
Denoising Multi-TE 1H-MRSI data using the learned model
With the learned model, we perform denoising multi-TE MRSI reconstruction by solving:
$$\hat{\mathbf{X}}\ =\arg\min_{\mathbf{X}}\|\mathbf{d}-\mathcal{A}(\mathbf{X})\|^2_2+\lambda_1\|\mathcal{N}(\mathbf{X})-\mathbf{X}\|^2_F+\lambda_2R(\mathbf{X}) \quad [2]$$
where $$$\mathbf{d}$$$ contains the noisy data, $$$\textbf{X}$$$ denotes the multi-TE spatiotemporal function, $$$\mathcal{A}$$$ is the forward encoding operator with a k-space sampling pattern, and $$$\mathcal{N}$$$ denotes the trained network capturing the low-dimensional representation of $$$\textbf{X}$$$. The first regularization term (with $$$\lambda_1$$$) enforces the learned model on the data (to effectively separate noise and signals of interest), and $$$R(.)$$$ imposes any additional spatial-spectral constraints (e.g., a weighted-$$$\ell_2$$$ or $$$\ell_1$$$ penalty). An ADMM algorithm was used to solve this problem$$$^{14}$$$.
We have evaluated the proposed method using both numerical simulations and experimental data, results from which are highlighted below.
Results
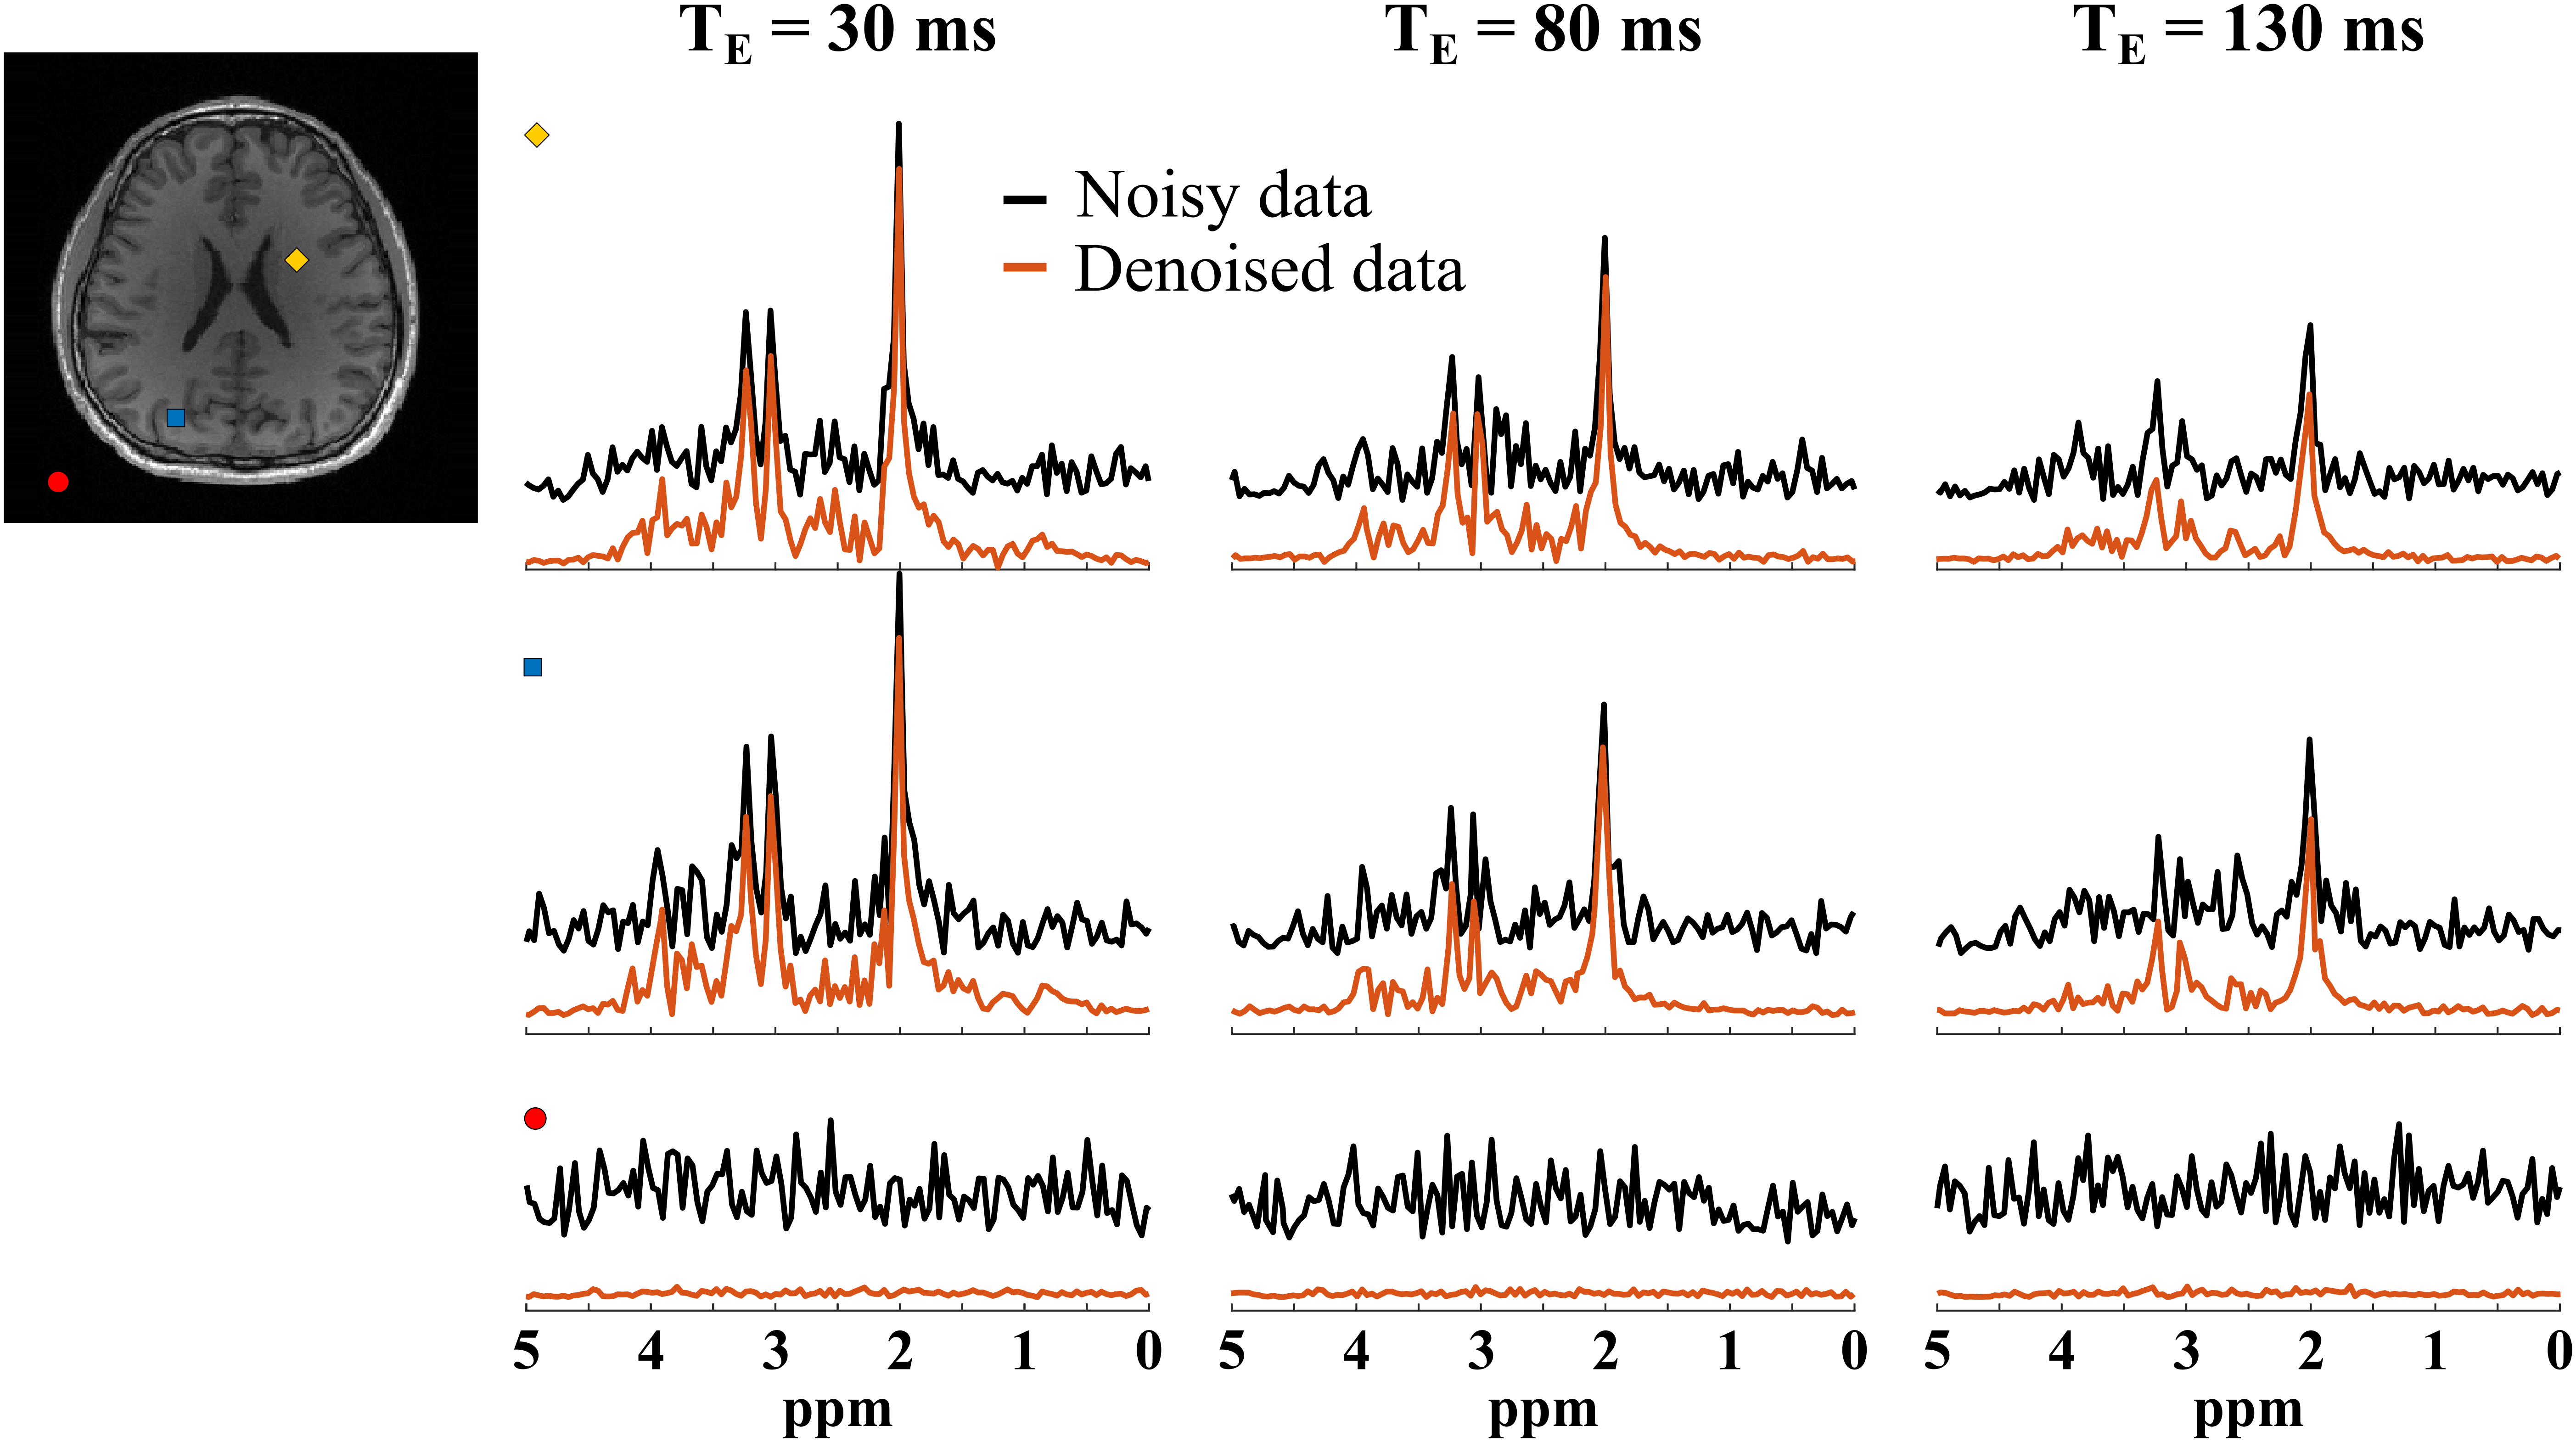
Figure 2 compares the representation accuracy of the proposed learned model with low-dimensional linear subspace (low-rank) models (for both the cases of TE-dependent subspaces and a TE-combined subspace) in a 3-TE simulation. As can be seen, the proposed method yielded higher accuracy than both linear subspace approximations across different model orders. We then evaluate the learned model for denoising a numerical phantom. The phantom was simulated with spatially varying metabolite and macromolecule spectra with different concentrations, $$$T_2$$$’s, lineshapes, frequency shifts, and a lesion-like feature. As shown in Fig. 3, the proposed method clearly outperforms the methods using either learned subspace constraints (by projecting onto the subspaces) or spatial regularization, both qualitatively and quantitatively.Figures 4 and 5 show the results from a representative set of in vivo data (healthy volunteer, 3T) to demonstrate the utility of the proposed method in practical experiments with the following acquisition parameters: FOV = $$$220 \times 220 \times 64$$$ mm$$$^2$$$, matrix size = $$$32 \times 32 \times 8$$$, spectral bandwidth = 1250 Hz and 320 echo pairs. Substantial SNR improvement was achieved by the proposed method, as illustrated by both metabolite maps (Fig. 4) and spatially resolved spectra (Fig. 5).
Acknowledgements
No acknowledgement found.References
[1] de Graaf RA. In Vivo NMR Spectroscopy: Principles and Techniques. John Wiley and Sons, 2019.
[2] Kirov II, Tal A. Potential clinical impact of multi parametric quantitative MR spectroscopy in neurological disorders: A review and analysis. Magn Reason Med 2020; 83: 22-44.
[3] Cancino-De-Greiff HF, Ramos-Garcia R, and Lorenzo‐Ginori JV. Signal de-noising in magnetic resonance spectroscopy using wavelet transforms. Concepts Magn Reson Part A Bridg Educ Res, 2002; 14: 388-401.
[4] Ahmed OA. New denoising scheme for magnetic resonance spectroscopy signals. IEEE Trans Med Imaging, 2005; 24: 809-816.
[5] Haldar JP, Hernando D, Song SK, et al. Anatomically constrained reconstruction from noisy data. Magn Reson Med, 2008; 59: 810-818.
[6] Nguyen HM, Haldar JP, Do MN, et al. Denoising of MR spectroscopic imaging data with spatial-spectral regularization. IEEE-ISBI 2010, p. 720-723.
[7] Nguyen HM, Peng X, Do MN, et al. Denoising MR spectroscopic imaging data with low-rank approximations. IEEE Trans Biomed Eng, 2012; 60: 78-89.
[8] Liu Y, Ma C, Clifford BA, et al. Improved low-rank filtering of magnetic resonance spectroscopic imaging data corrupted by noise and B0 field inhomogeneity. IEEE Trans Biomed Eng, 2016; 63: 841-849.
[9] Chen Y, Li Y and Xu Z, Improved low-rank filtering of MR spectroscopic imaging data with pre-learnt subspace and spatial constraints. IEEE Trans Biomed Eng, 2019; 67: 2381-2388.
[10] Ma C, Lam F, Liu QG, et al. Accelerated high-resolution multidimensional 1H-MRSI using low-rank tensors. In Proc of ISMRM, 2016; p. 379.
[11] Tang L, Zhao Y, Li Y, et al. Accelerated J‐resolved 1H‐MRSI with limited and sparse sampling of (k, t1, t2) ‐space. Magn Reson in Med, 2019; 85: 30-41.
[12] Qu X, Huang Y, Lu H, et al. Accelerated nuclear magnetic resonance spectroscopy with deep learning. Angew Chem Int Ed, 2020; 59, 10297-10300.
[13] Trabelsi C, Bilaniuk O, Zhang Y, et al. Deep complex networks. ICLR 2018.
[14] Lam F, Li Y and Peng X. Constrained magnetic resonance spectroscopic imaging by learning nonlinear low-dimensional models. IEEE Trans Med Imaging, 2020; 39: 545-555.
[15] Li Y, Wang Z and Lam F. Separation of metabolite and macromolecule signals for 1H-MRSI using learned nonlinear models. IEEE-ISBI 2020, p. 1-4.
[16] Lee HH, and Kim H. Intact metabolite spectrum mining by deep learning in proton magnetic resonance spectroscopy of the brain. Magn Reson Med, 2019; 82: 33-48.
[17] Wyss PO, Bianchini C, Scheidegger M, Giapitzakis, et al. In vivo estimation of transverse relaxation time constant (T2) of 17 human brain metabolites at 3T. Magn Reson Med, 2018; 80: 452-461.
[18] Landheer K, Gajdošík, M, Treacy M, et al. Concentration and effective T2 relaxation times of macromolecules at 3T. Magn Reson Med, 2020; In press.
Figures