1997
Unsupervised anomaly detection using generative adversarial networks in 1H-MRS of the brain1Department of Biomedical Sciences, Seoul National University, Seoul, Korea, Republic of, 2Division of Applied RI, Korea Institute of Radiological & Medical Science, Seoul, Korea, Republic of, 3Department of Medical Sciences, Seoul National University, Seoul, Korea, Republic of, 4Department of Radiology, Seoul National University Hospital, Seoul, Korea, Republic of
Synopsis
The applicability of generative adversarial networks (GANs) capable of unsupervised anomaly detection (AnoGAN) was investigated in the management of quality of 1H-MRS human brain spectra. The AnoGAN showed potential in the detection of the spectra with poor SNR or abnormal NAA levels. Despite the fact that those spectra contaminated with ghost, residual water or lipid have never been involved in the training or optimization of the AnoGAN, they were successfully filtered out depending on the intensity of the artifacts. Our unsupervised learning-based approach could be an option in the spectral quality management in addition to the previous supervised learning-based approaches.
Introduction
The potential applicability of deep learning in 1H-MRS(I) has been well demonstrated for quality management1,2 as well as quantification3-7. For supervised deep learning-based binary classification of spectral quality1,2, the training sets for the two classes need to be prepared with precise labels and a sufficient amount of examples, and in comparable amounts for optimal training1,8. Given the broad ranges of spectral abnormalities3, therefore, the binary classification of spectral quality in a supervised manner could become challenging as one extends the regime of abnormal spectra. We investigated the potential applicability of generative adversarial networks (GANs9) capable of unsupervised anomaly detection (AnoGAN10) in the management of quality of human brain spectra at 3.0T. The AnoGAN was trained in an unsupervised manner solely on simulated normal brain spectra and used for filtering out abnormal spectra with diverse abnormalities including abnormal SNR, linewidth and metabolite concentrations and spectral artifacts such as ghost, residual water, and lipid.Methods
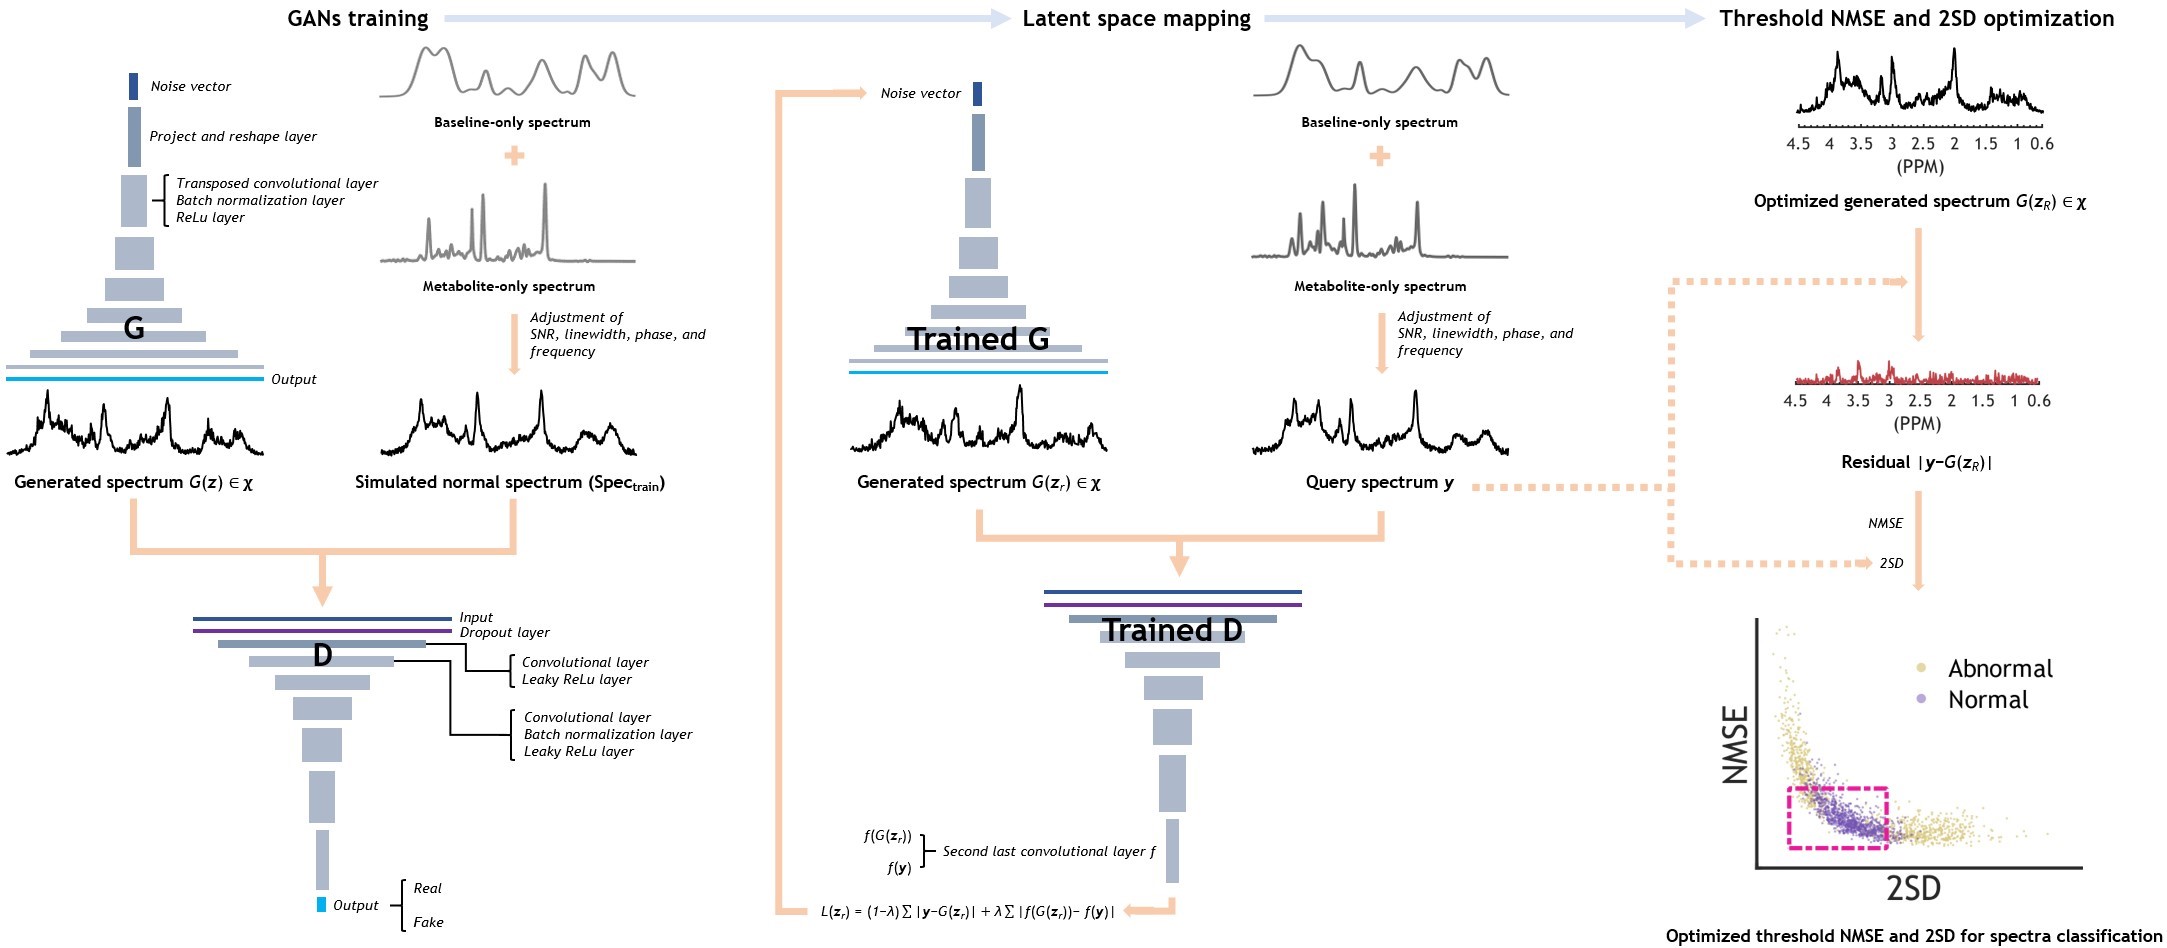
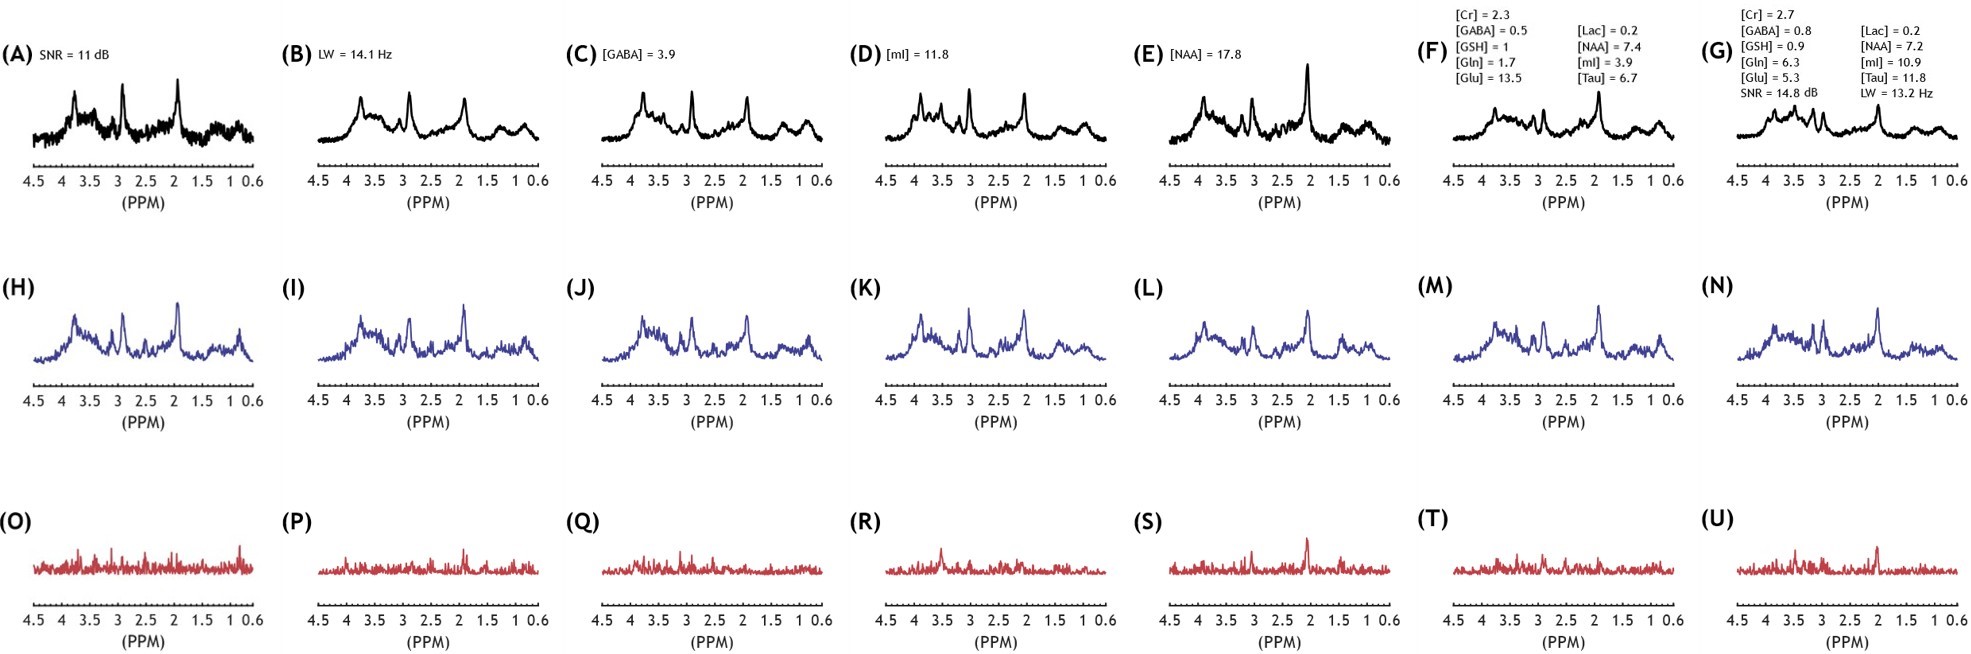
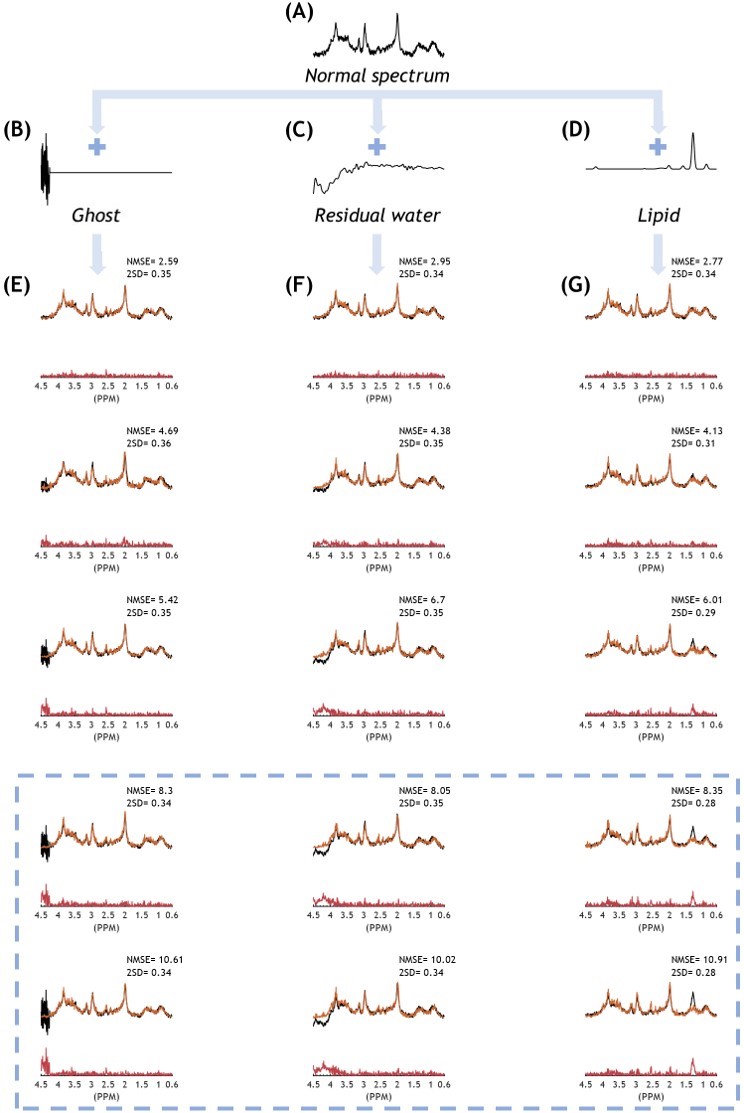
Brain Spectra Simulation: The brain spectra were simulated using 17 metabolite basis spectra obtained in phantom and spectral baselines modeled with 9 resonance groups6,11-16. Normal brain spectra were simulated for training (Spectrain, N = 100,000) by randomly varying the relative metabolite concentrations and baseline resonances, SNR, and linewidth within the predefined normal ranges. In addition, 2,000 normal spectra (Specnorm) were simulated and used as a validation and a test sets (N = 1000 for each set). For abnormal spectra, various groups of spectra were simulated, which were abnormal due to: (A) low SNR (Specano.SNR), (B) broad linewidth (Specano.LW), (C-F) high and low concentrations of (C) GABA (Specano.GABA), (D) mI (Specano.mI), (E) NAA (Specano.NAA), (F) 9 metabolites of Cr, GABA, Gln, Glu, GSH, Lac, mI, NAA, and Tau (Specano.multimeta), and (G) low SNR, broad linewidth, and high and low concentrations of the 9 metabolites (Specano.all). For each of these 7 abnormal spectra groups (A) through (G), 1000 spectra were simulated and used as a test set. For Specano.all, additional 1000 spectra were simulated and used as a validation set. Finally, abnormal spectra contaminated with (H) ghost, (I) residual water, or (J) lipid were simulated (N = 1000, 500, and 1000, respectively).AnoGAN: We employed an AnoGAN, which is capable of detecting unseen abnormalities in each of the input data based on a reference data obtained from AnoGAN by latent space mapping10 (Fig.1). The AnoGAN was designed and trained solely on Spectrain using Matlab deep learning toolbox.
Anomaly Detection: Assuming that a given query spectrum is abnormal, the AnoGAN tries to generate a spectrum that is as close to the query spectrum as possible, but is still belonging to normal spectra, because the AnoGAN was trained solely on normal spectra. Therefore, as the deviation of the query spectrum from the normal regime is large, so is the difference between the query and the AnoGAN-generated spectra. The actual binary classification of a query spectrum into either normal or abnormal is achieved quantitatively based on the normalized mean squared error (NMSE) between the query and the AnoGAN-generated spectra and the 2 x standard deviation (2SD) of the noise measured from the query spectrum (Fig.1). The optimal threshold values of the NMSE and 2SD that differentiate best between normal and abnormal spectra were predetermined from the validation sets of Specnorm and Specano.all, and then used for the test sets of Specnorm and all abnormal spectra groups for the evaluation of the performance of the AnoGAN. The abnormality of the query spectrum is directly visualized by the residual spectrum between the query and the AnoGAN-generated spectra10 (Fig.1).
Results
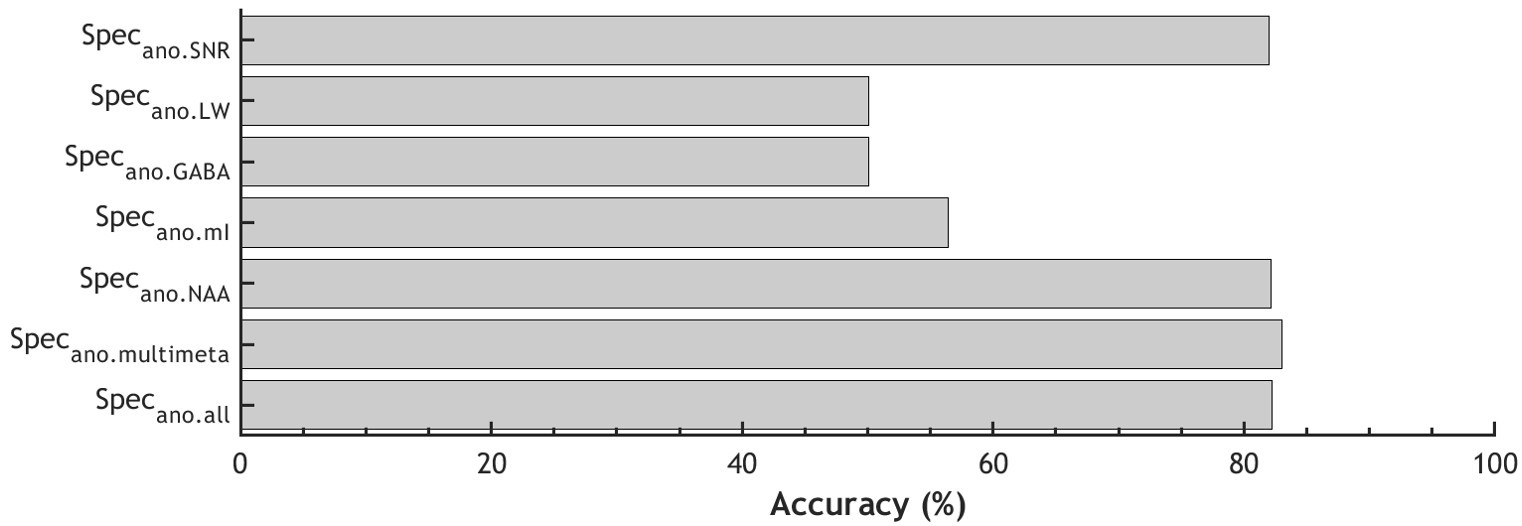
Fig.2A-G shows the representative query spectra to the AnoGAN for the abnormal spectra groups. The corresponding AnoGAN-generated spectra (Fig.2H-N) and residual spectra (Fig.2O-U) are also shown. Fig.3 shows the accuracy of differentiating between normal and abnormal spectra in the test sets of Specnorm and the 7 abnormal spectra groups. The classification accuracy was over 80% for Specano.SNR, Specano.NAA, Specano.multimeta, and Specano.all. In Fig.4, despite the fact that they have never been involved in the training or optimization of the AnoGAN, those spectra contaminated with ghost, residual water or lipid can be correctly classified as abnormal regardless of the types of the artifacts, depending solely on their intensity (Fig.4).Discussion
The proposed method was not sensitive enough to precisely detect abnormal linewidth and abnormal levels of a single metabolite such as GABA and mI. Nonetheless, the observation that it can detect Specano.SNR, Specano.NAA, Specano.multimeta, and Specano.all with more than 80% accuracy supports its potential applicability in the spectral quality management. The advantage of our unsupervised learning approach may be seen best in the detection of the spectra contaminated with artifacts. In the case of supervised learning, the artifact detection may require far more thorough preparation of the training data, considering the diverse types of the artifacts and their variable shapes and locations for a given type, in addition to their variable intensity. In our approach, the intensity of the artifacts would be the only factor that influences the detectability.Conclusion
Our unsupervised deep learning-based approach could be an option in addition to supervised deep learning-based approaches in the binary classification of spectral quality with an extended abnormal spectra regime.Acknowledgements
This work was supported by the National Research Foundation of Korea (NRF) grant funded by the Ministry of Education, Science and Technology (2018M3A7B4071235) and the Korea government (MSIT) (2019R1A2C1002433).References
1. S. S. Gurbani, E. Schreibmann, A. A. Maudsley, et al., A convolutional neural network to filter artifacts in spectroscopic MRI. Magn Reson Med 2018;80:1765–1775.
2. S. P. Kyathanahally, A. Doring, R. Kreis, Deep learning approaches for detection and removal of ghosting artifacts in MR spectroscopy. Magn Reson Med 2018;80:851–863.
3. N. Hatami, M. Sdika, H. Ratiney, Magnetic resonance spectroscopy quantification using deep learning. MICCAI, Grenada, Spain, 2018. hal-01904617.
4. Z. Iqbal, D. Nguyen, M. A. Thomas, S. Jiang, Acceleration and quantitation of localized correlated spectroscopy using deep learning: A pilot simulation study. arXiv:1806.11068 (2018).
5. S. S. Gurbani, S. Sheriff, A. A. Maudsley, H. Shim, L. A. D. Cooper. Incorporation of a spectral model in a convolutional neural network for accelerated spectral fitting. Magn Reson Med 2019;81:3346–3357.
6. H. H. Lee, H. Kim, Intact metabolite spectrum mining by deep learning in proton magnetic resonance spectroscopy of the brain. Magn Reson Med 2019;82:33-48.
7. H. H. Lee, H. Kim, Deep learning‐based target metabolite isolation and big data‐driven measurement uncertainty estimation in proton magnetic resonance spectroscopy of the brain. Magn Reson Med 2020;84:1689-1706.
8. J. M. Johnson, T. M. Khoshgoftaar, Survey on deep learning with class imbalance. J Big Data 2019;6:27.
9. I. J. Goodfellow, J. Pouget-Abadie, M. Mirza, et al, Generative adversarial nets, NIPS, Montreal, Canada, 2014. pp. 2672-2680.
10. T. Schlegl, P. Seeböck, S. M. Waldstein, U. Schmidt-Erfurth, G. Langs, Unsupervised Anomaly Detection with Generative Adversarial Networks to Guide Marker Discovery. In: Niethammer M. et al. (eds) Information Processing in Medical Imaging. IPMI, Lecture Notes in Computer Science, vol 10265. Springer, Cham, Switzerland, 2017.
11. T. L. Perry, K. Berry, S. Hansen, S. Diamond, C. Mok, Regional distribution of amino acids in human brain obtained at autopsy. J Neurochem 1971;18:513–519.
12. T. L. Perry, S. Hansen, K. Berry, C. Mok, D. Lesk, Free amino acids and related compounds in biopsies of human brain. J Neurochem 1971;18:521–528.
13. V. Govindaraju, K. Young, A. A. Maudsley. Proton NMR chemical shifts and coupling constants for brain metabolites. NMR Biomed 2000;13:129–153.
14. R. A. de Graaf, In vivo NMR spectroscopy: principles and techniques, John Wiley & Sons, New York, 2007.
15. K. S. Opstad, B. A. Bell, J. R. Griffiths, F. A. Howe, Toward accurate quantification of metabolites, lipids, and macromolecules in HRMAS spectra of human brain tumor biopsies using LCModel. Magn Reson Med 2008;60:1237–1242.
16. R. Birch, A. C. Peet, H. Dehghani, M. Wilson, Influence of macromolecule baseline on 1H MR spectroscopic imaging reproducibility. Magn Reson Med 2017;77:34–43.
Figures