1994
Mapping of downfield resonances in the human brain using 1H-MRSI with binomial spectral-spatial excitation and selective refocusing1Department of Radiology and Radiological Science, The Johns Hopkins University School of Medicine, Baltimore, MD, United States, 2Kennedy Krieger Institute, F. M. Kirby Research Center for Functional Brain Imaging, Baltimore, MD, United States
Synopsis
Water suppression employed in 1H-MR spectroscopy affects signals of exchangeable protons that resonate downfield from water. We have developed a novel method without water suppression for mapping these resonances on a 3T scanner using 2D 1H-MRSI in combination with binomial spectral spatial excitation and selective refocusing. Acquired data were consistent across all scanned subjects and within the whole FOV, with spectral patterns in agreement with previous single voxel studies.
Introduction
Water suppression modules typically employed in in vivo 1H-MR spectroscopy (MRS) and spectroscopic imaging (MRSI) cause an attenuation of metabolite signals that are subject to chemical exchange and magnetization transfer with water. In particular, the signals of amide groups and other exchangeable protons that resonate downfield from water (i.e. 5-10 ppm) are severely affected1. Therefore, in order to observe these resonances, which may give valuable information on brain tumor metabolism2 and ischemia3, it is important to avoid saturation of the water signal. Most downfield proton MRS studies performed to date have used single voxel localization techniques4–7. A method capable of spatially mapping downfield resonances would be beneficial for many applications. Recently, 3D MRSI with spectrally selective excitation was used to detect NAD+ at ultra-high field8. This abstract presents a method to map downfield resonances on a 3T clinical scanner using 2D 1H-MRSI in combination with binomial spectral-spatial excitation9 and selective refocusing.Methods
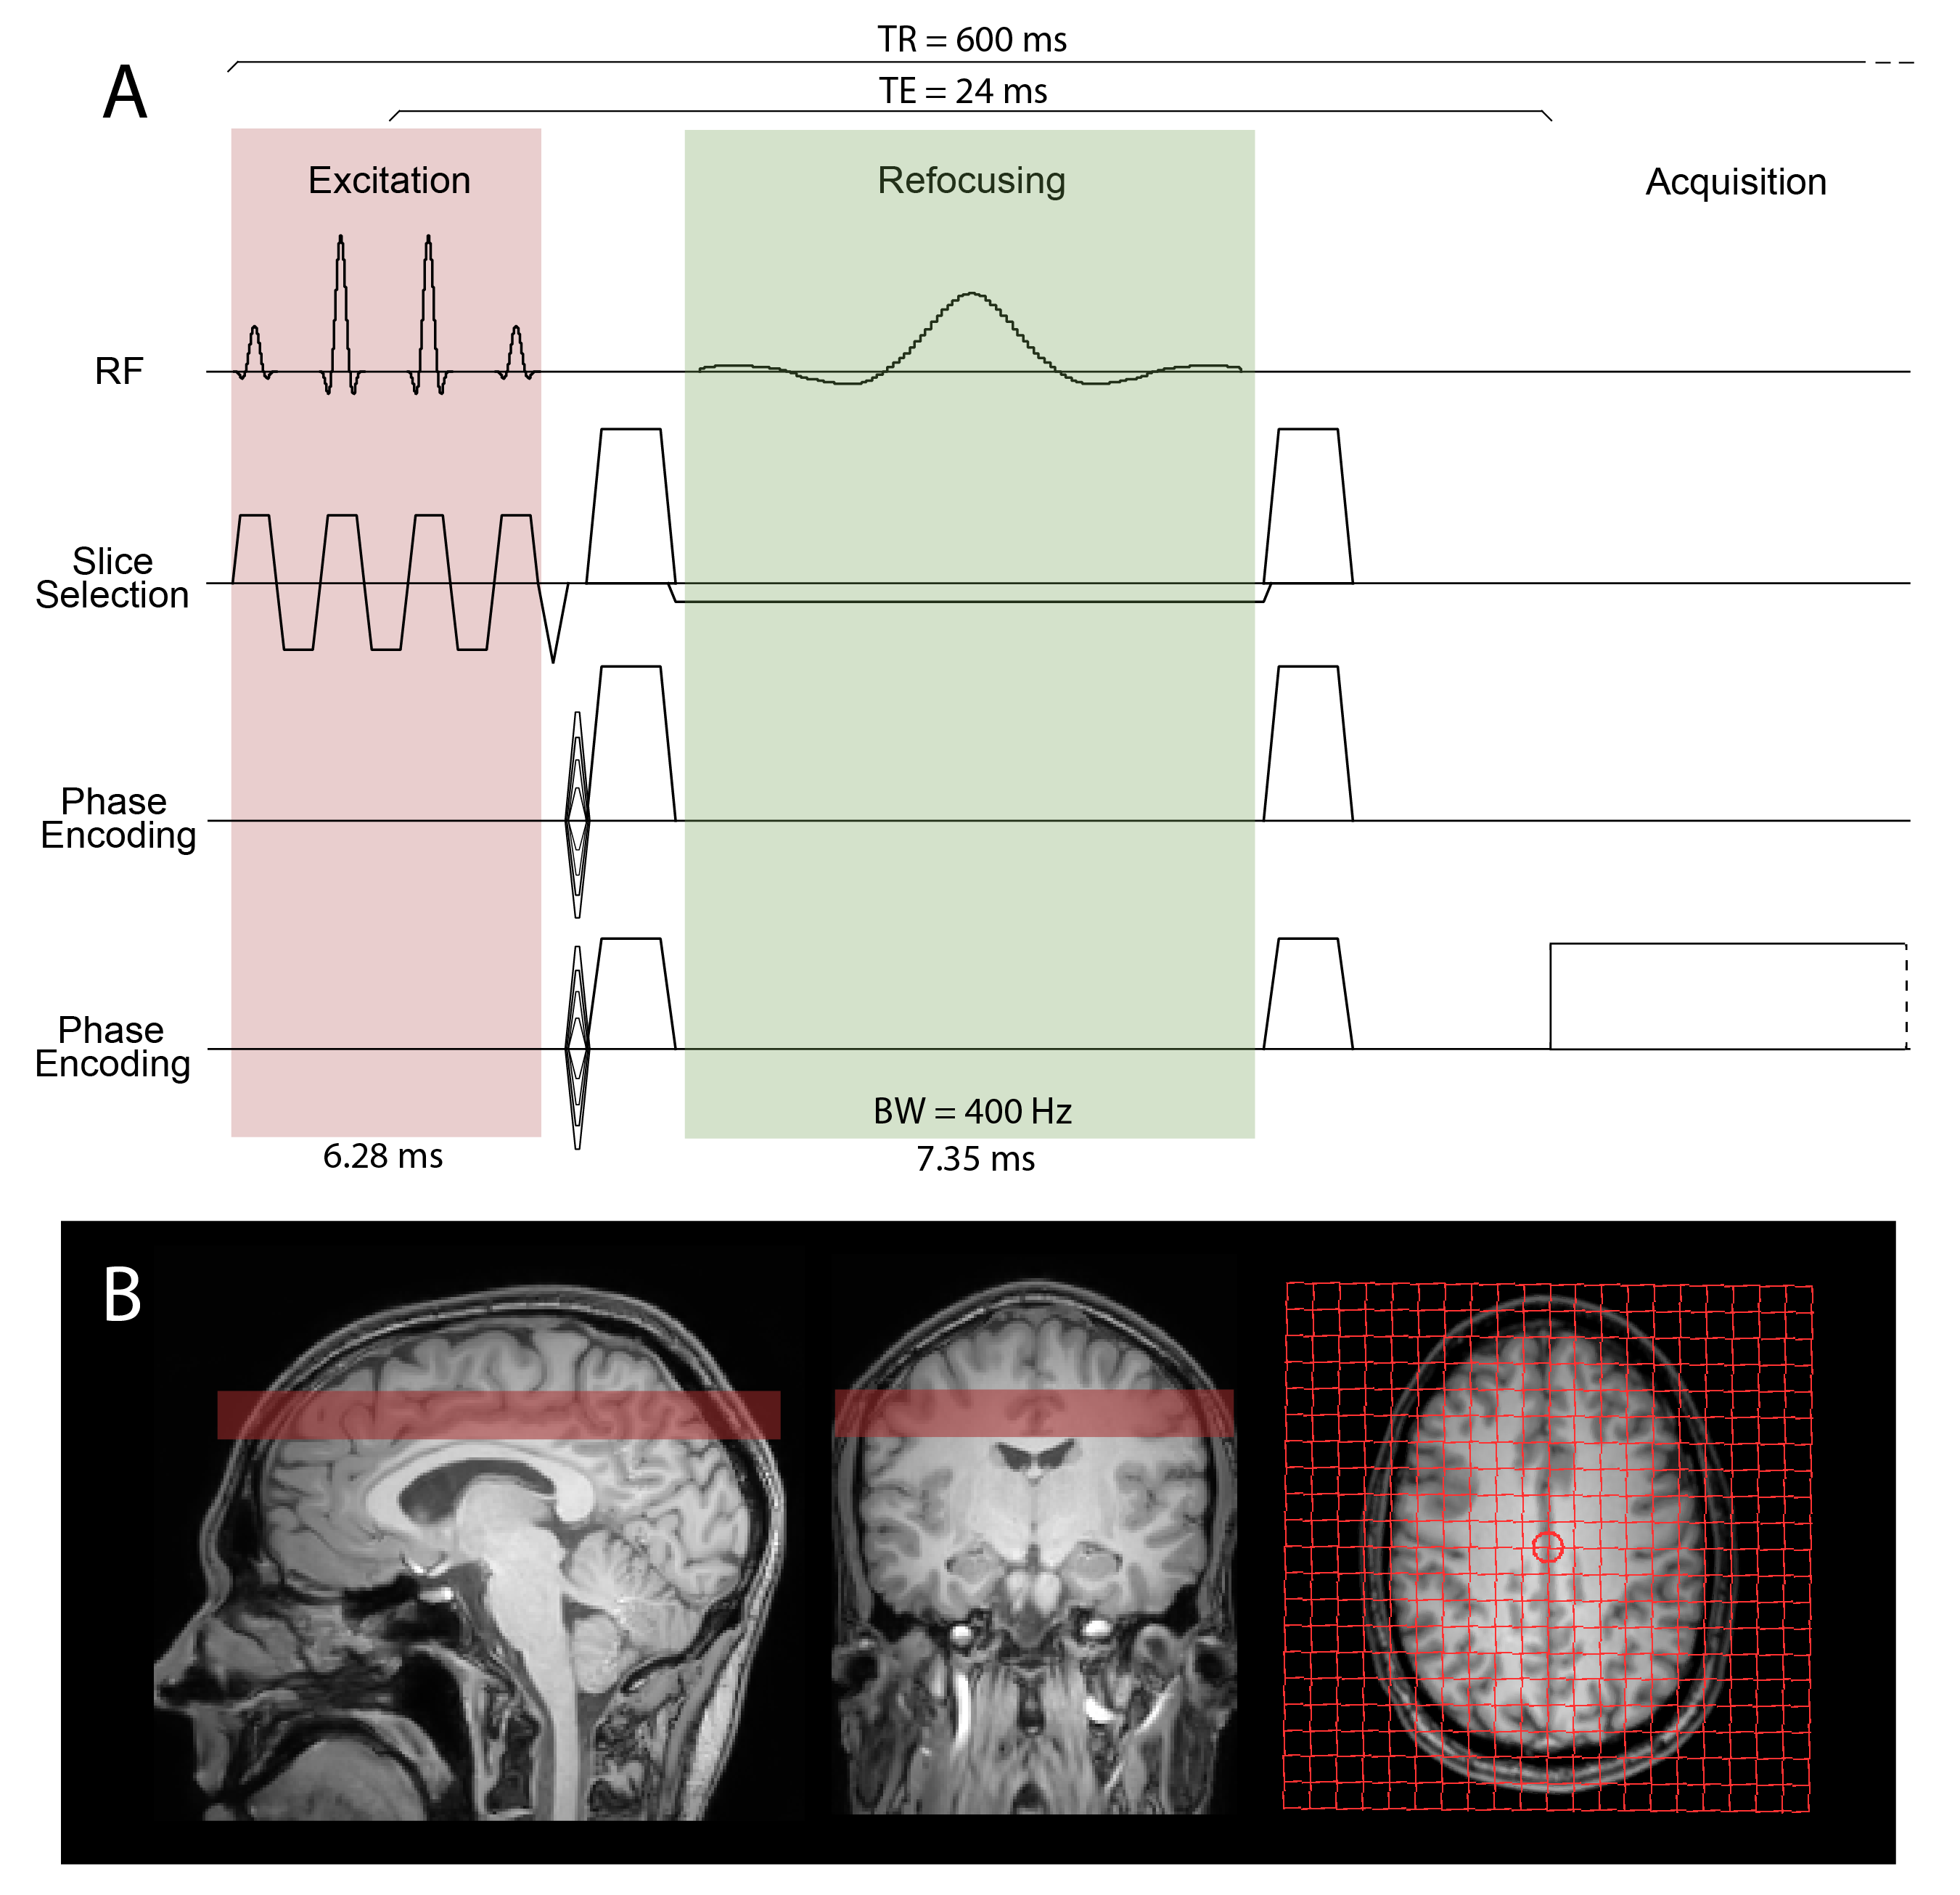
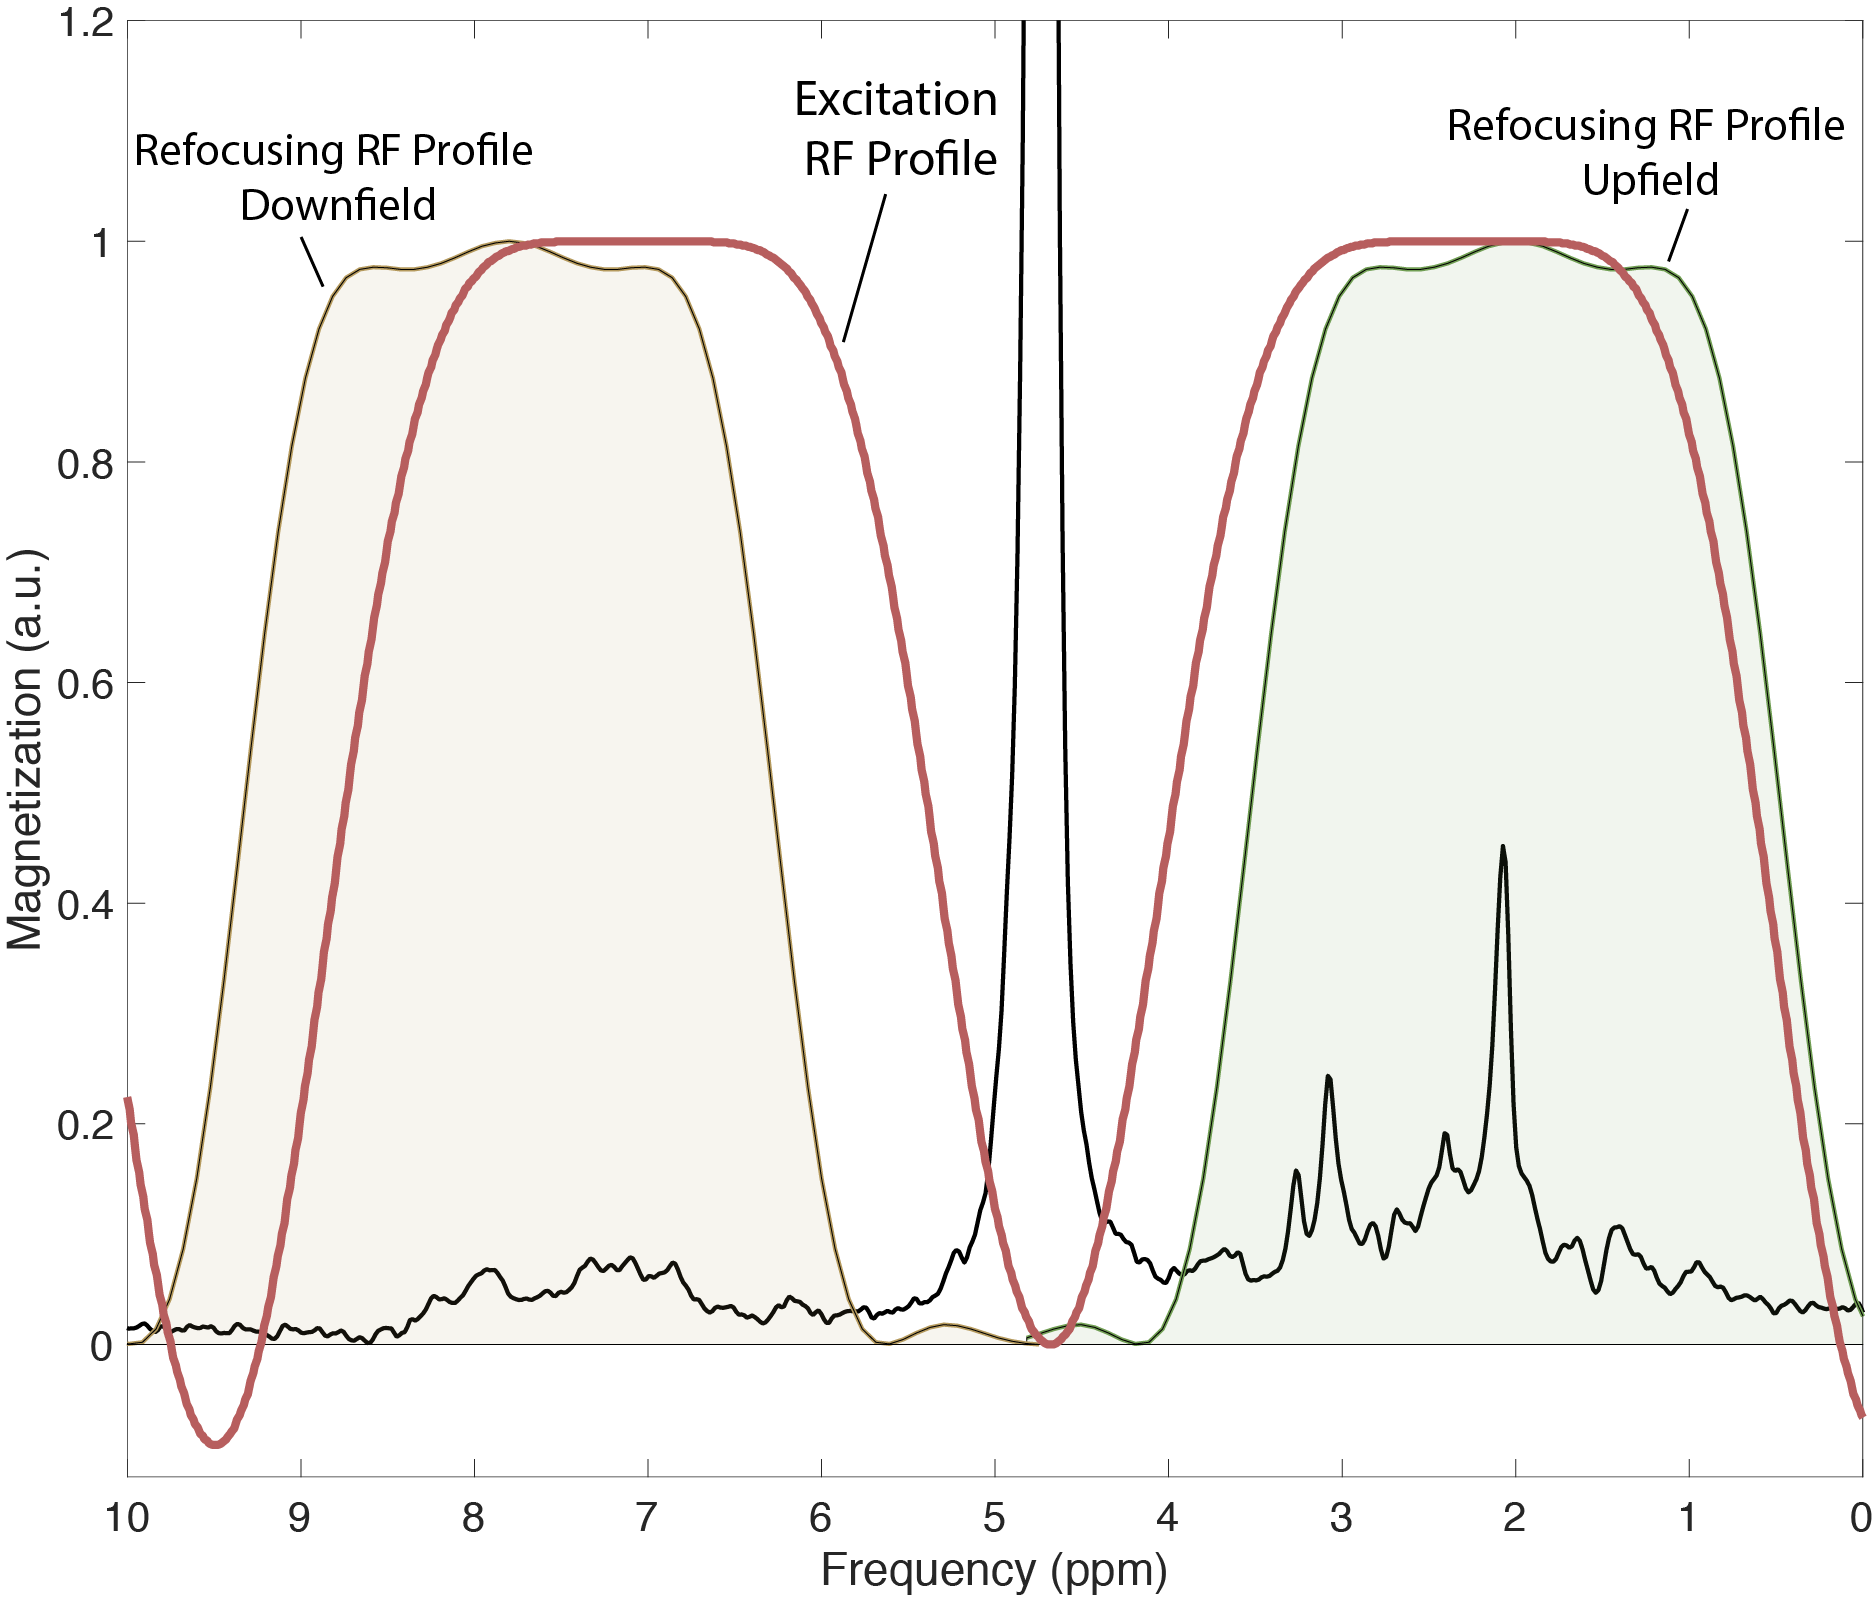
A spin-echo sequence was implemented using a binomial spectral-spatial excitation pulse (truncated sinc, 6.28ms/14.2uT) and a frequency-selective sinc refocusing pulse (7.35ms/7.3uT) with 400Hz bandwidth (Fig. 1A). Excitation and refocusing frequency profiles were calculated using Bloch equations in RFVAR Viewer v1.3.0 (Fig. 2). The sequence parameters were optimized using simulation and phantom scans. 3 healthy subjects (29-32 years old) were scanned on a Philips Ingenia Elition 3T scanner with a 32-channel receive head coil. Before MRSI acquisition, 2nd order shimming was carried out using a field-map based shimming algorithm (Philips ‘shimtool’; 19±2Hz). Two (upfield and downfield) 2D MRSI datasets were acquired from a supraventricular slice (Fig.1B) with the following parameters: TR/TE = 600/24ms, FOV 200x200mm2, nominal voxel size 20x20x20mm3 (zero-filled to 10x10x20 mm3 in post-processing), refocusing pulse frequency offset=2.0ppm(upfield)/7.8ppm(downfield), NSA=1/2, acquisition time=49s/96s, samples=1024, spectral bandwidth=2000Hz. Outer-volume suppression pulses were placed over the skull for lipid suppression in the upfield acquisition. A 2D MRSI dataset with CHESS water suppression enabled and identical parameters was acquired additionally in one subject. Spectra were frequency aligned and phased corrected in jMRUI v6.0-alpha10, and 3Hz Gaussian line broadening was applied.Results
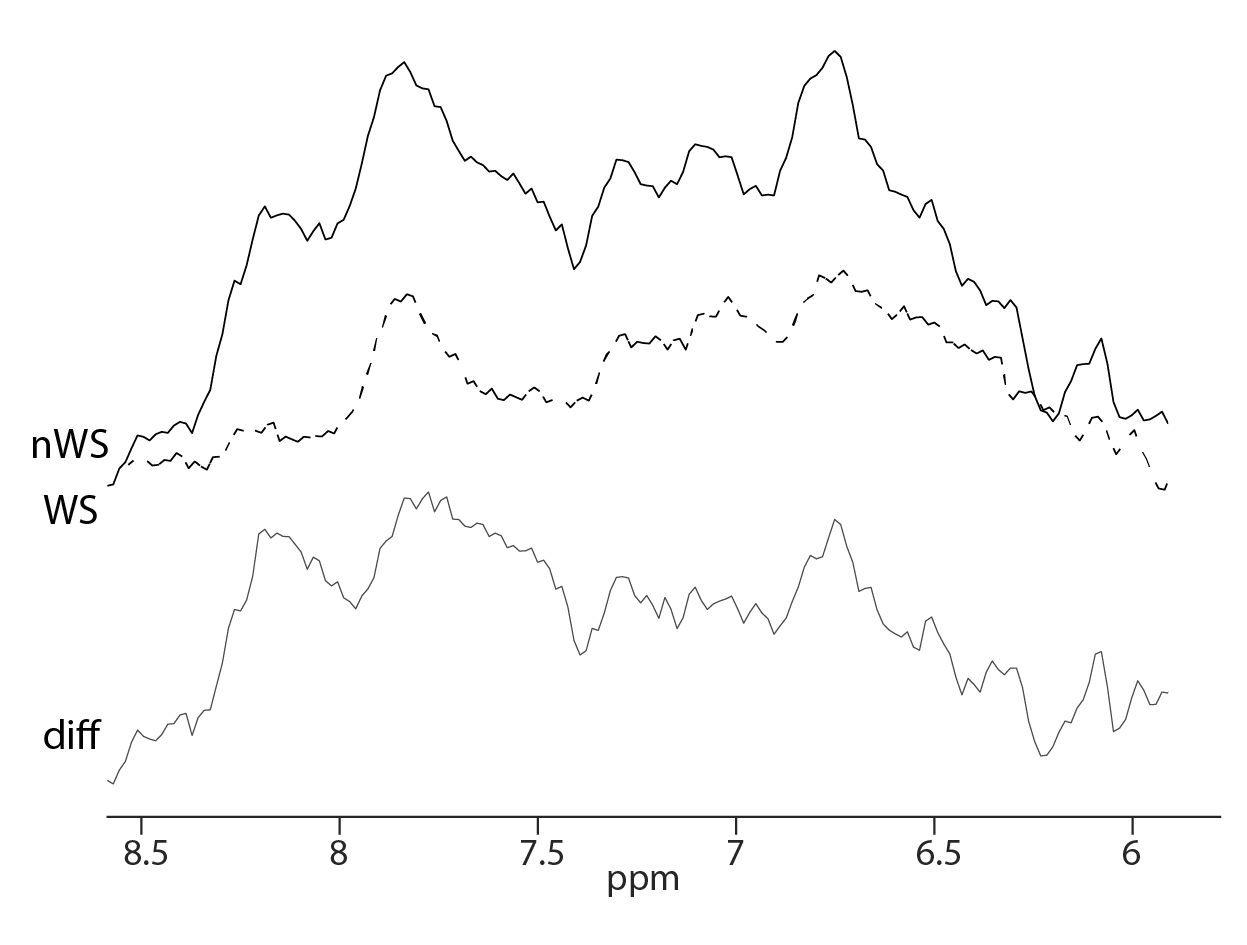
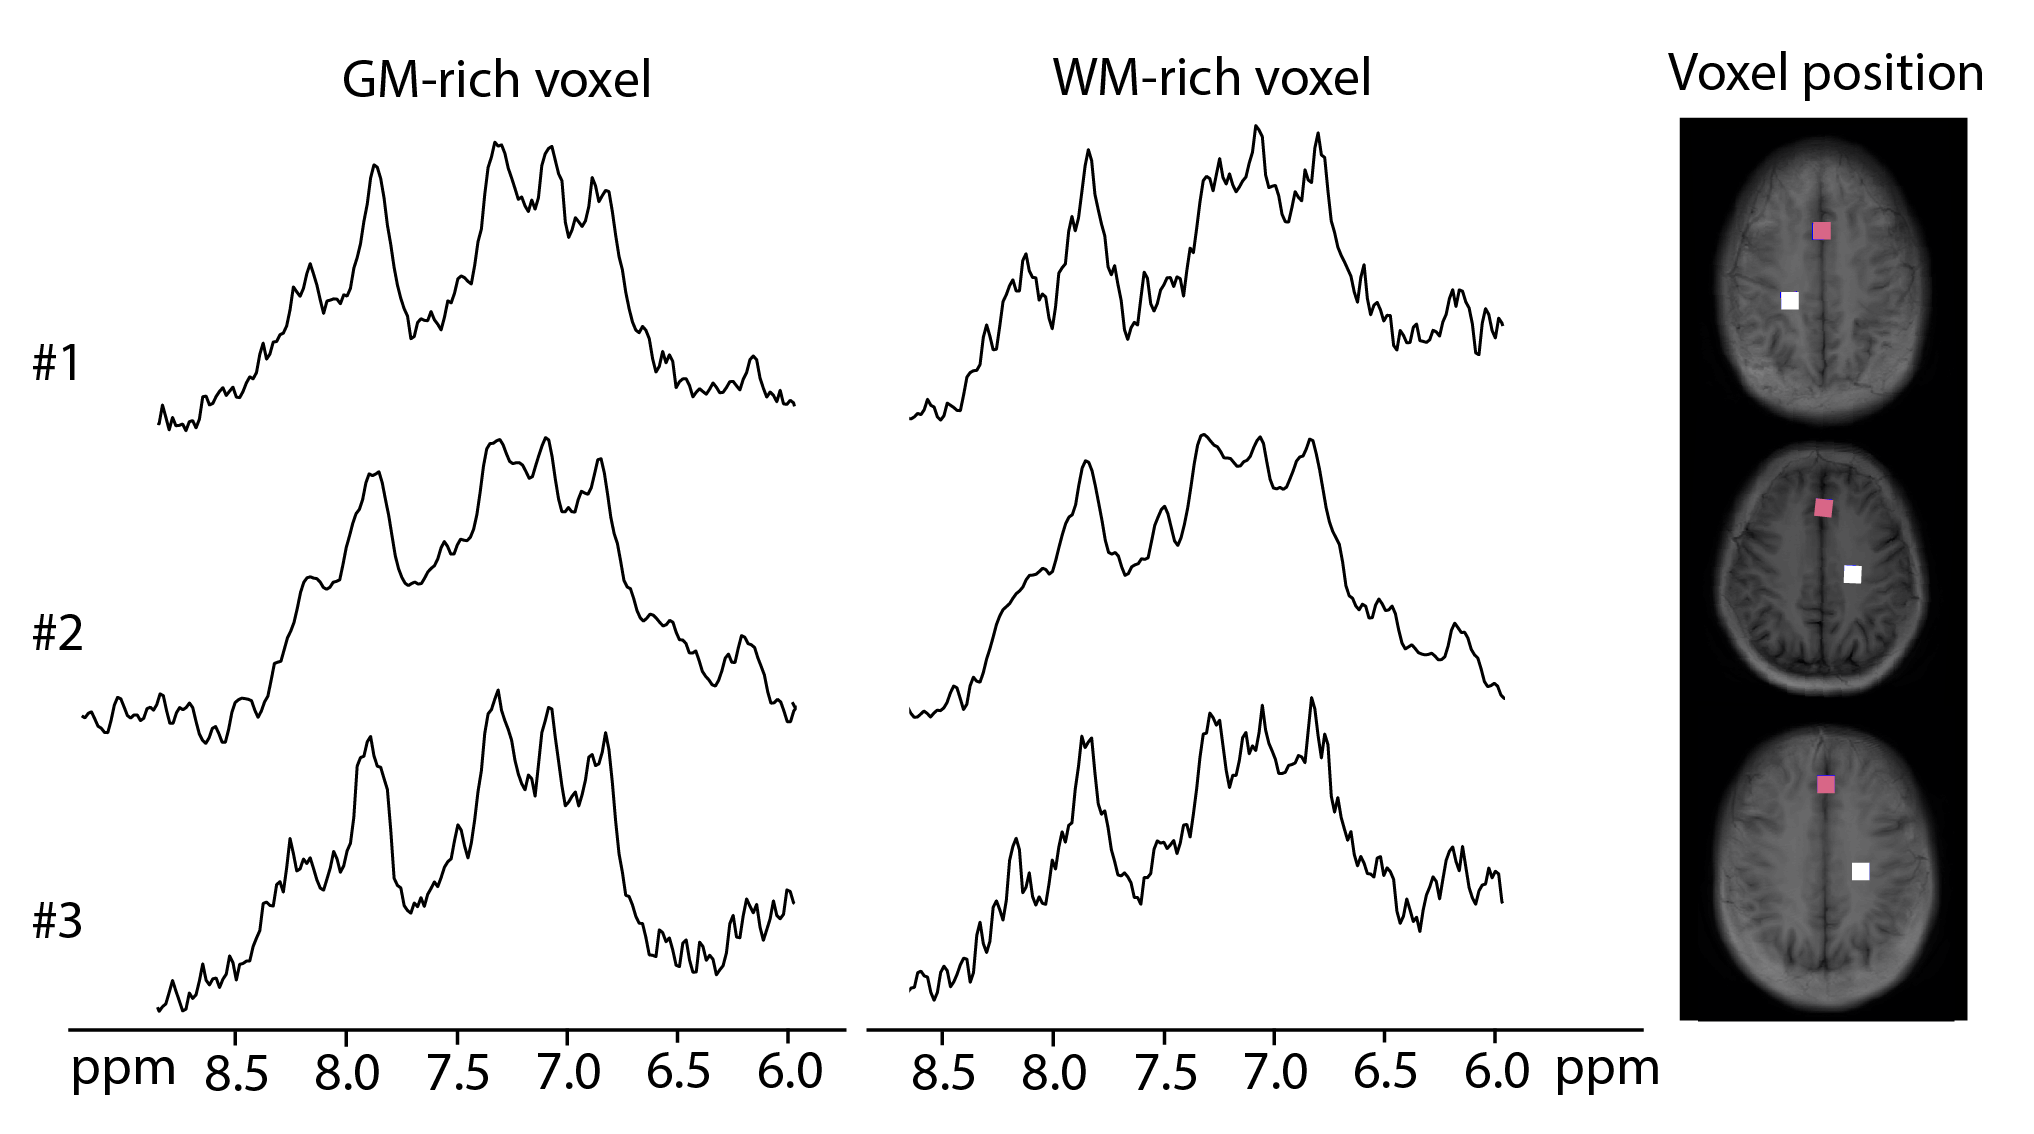
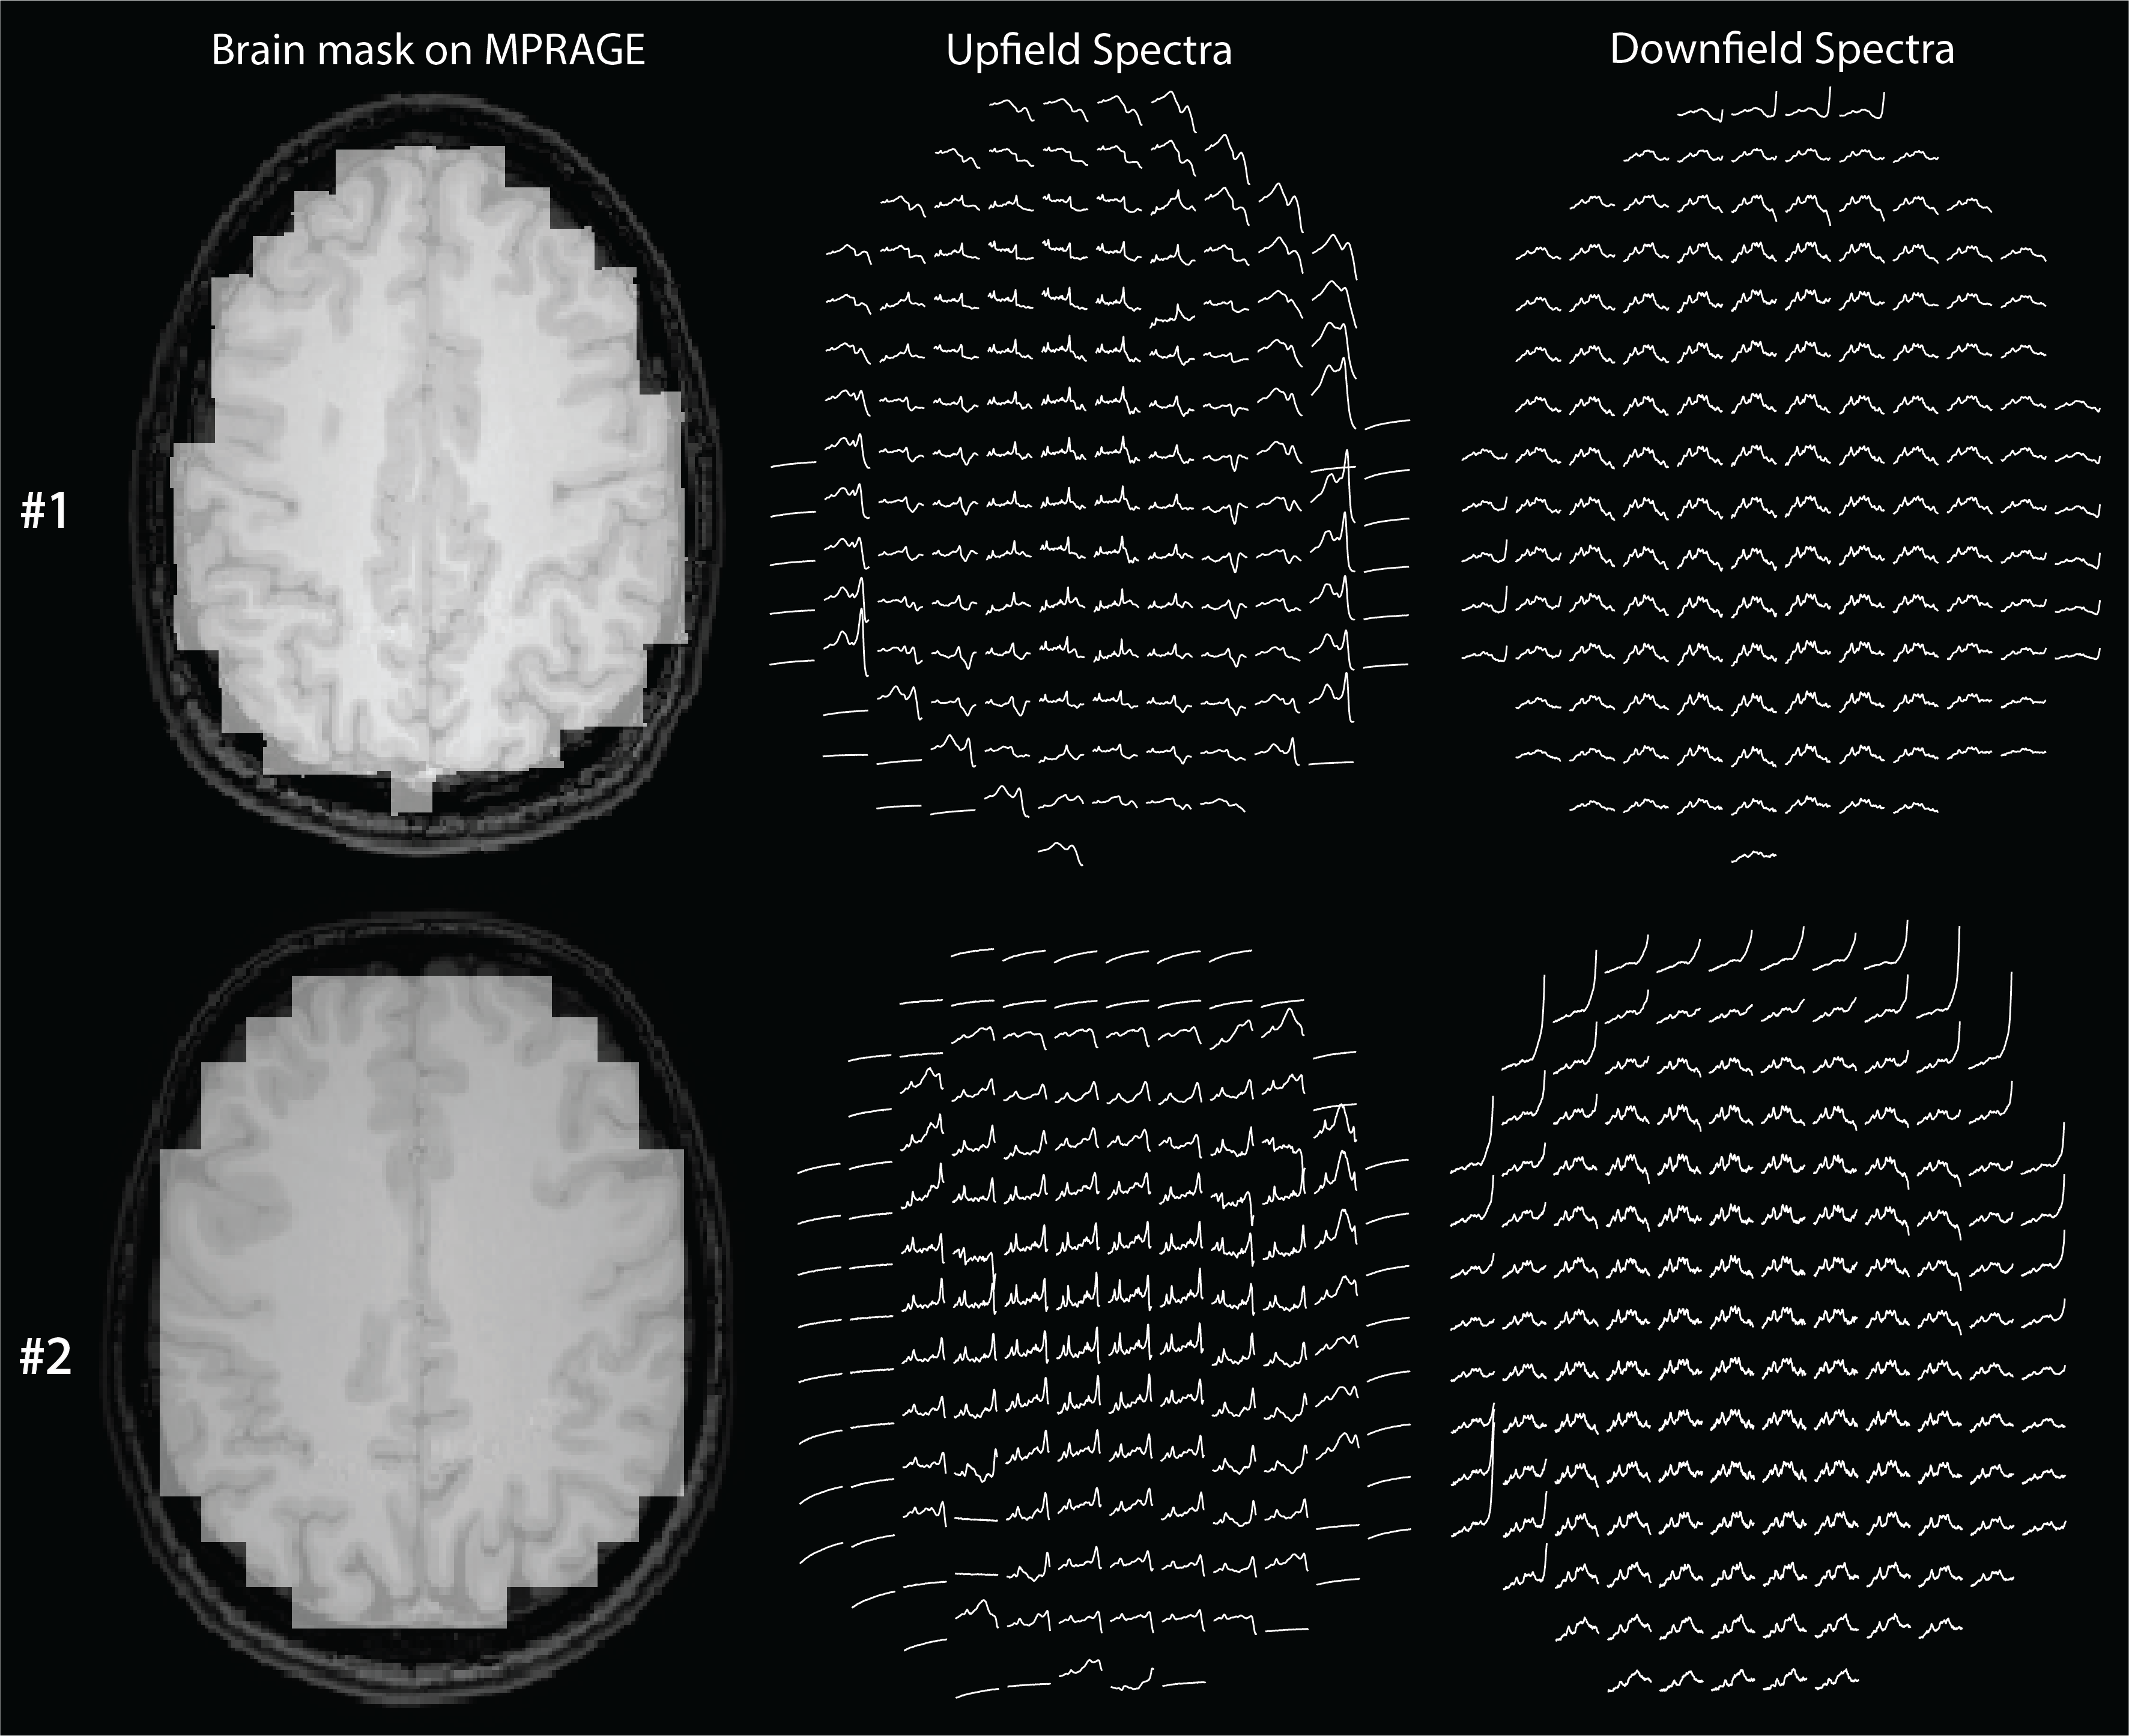
As expected, substantial differences were found between the downfield resonances acquired with and without water suppression, with a large increase in SNR when water suppression was not applied (Fig. 3). Spectra from selected grey and white matter regions were consistent across all 3 subjects (Fig. 4), and within the whole slice (Fig. 5), with distinct peaks at 6.1, 6.8, 7.1, 7.3, 7.5, 7.9, and 8.2 ppm, generally consistent with prior SV studies.Discussion
The abstract shows that 2D MRSI in combination with spectral-spatial excitation and frequency selective refocusing can be used to map downfield resonances on a 3T clinical scanner in just 1:36 minutes at 2 cm spatial resolution. As shown previously, adding a water suppression module significantly reduces the signal amplitudes of the downfield resonances7; by combining spectral-spatial excitation with selective refocusing, the water signal was unperturbed throughout the whole sequence, allowing for significant exchange (relaxation) enhancement of the downfield resonances3. The observed spectral pattern from 6 ppm to 9 ppm corresponds to previous single-voxel studies from 3T6. Peaks at 7.9 and 8.2 ppm appeared smaller than in Dziadosz et al.7 most probably due to different excitation/refocusing profiles and different TE. Because of the short T2’s of the downfield resonances, shortening of the TE would be desirable. While the TE of 24ms in this spin-echo sequence was fairly short, it could be significantly shortened if a FID-MRSI approach is used; however, FID-MRSI with binomial excitation was found to have poor water suppression factors and 1st order phase error which makes quantification of the downfield resonances more difficult. While contrast in amide proton transfer (APT) MRI reflects amide proton concentrations, it may also be susceptible to confounding factors including changes in pH, temperature and water relaxation times. In contrast, MRSI is relatively independent of these factors and offers improved spectral resolution, albeit at lower sensitivity and spatial resolution than APT. The binomial MRSI sequence may also be used to record upfield proton MRSI data without the effects of water suppression. Lipid suppression of the upfield acquisition may be further improved by optimizing the excitation and refocusing profiles to achieve more selective excitation and avoiding refocusing of lipids signals in the 1.9-0.9 ppm range.Acknowledgements
No acknowledgement found.References
1. Mori, S., Eleff, S. M., Pilatus, U., Mori, N. & Van Zijl, P. C. M. Proton NMR spectroscopy of solvent-saturable resonances: A new approach to study pH effects in situ. Magn Reson Med 40, 36–42 (1998).
2. Park, J. E. et al. Pre-and posttreatment glioma: Comparison of amide proton transfer imaging with MR spectroscopy for biomarkers of tumor proliferation. Radiology 278, 514–523 (2016).
3. Shemesh, N. et al. Metabolic properties in stroked rats revealed by relaxation-enhanced magnetic resonance spectroscopy at ultrahigh fields. Nat Commun 5, 1–8 (2014).
4. Fichtner, N. D., Henning, A., Zoelch, N., Boesch, C. & Kreis, R. Elucidation of the downfield spectrum of human brain at 7 T using multiple inversion recovery delays and echo times. Magn Reson Med 78, 11–19 (2017).
5. Fichtner, N. D. et al. In vivo characterization of the downfield part of 1 H MR spectra of human brain at 9.4 T: Magnetization exchange with water and relation to conventionally determined metabolite content. Magn Reson Med 79, 2863–2873 (2018).
6. Macmillan, E. L. et al. Magnetization exchange with water and T1 relaxation of the downfield resonances in human brain spectra at 3.0 T. Magn Reson Med 65, 1239–1246 (2011).
7. Dziadosz, M., Bogner, W. & Kreis, R. Non-water-excitation MR spectroscopy techniques to explore exchanging protons in human brain at 3 T. Magn Reson Med 1–12 (2020). doi:10.1002/mrm.28322
8. Bagga, P., Hariharan, H., Witschey, W. R. & Reddy, R. 3D CSI downfield 1H MR spectroscopy using EBURP1 spectrally selective excitation pulse. in Proc. Intl. Soc. Mag. Reson. Med. (2020).
9. Kreis, R. & Boesch, C. Localized 1H-MRS without water saturation: Techniques and initial results for human brain and muscle. Proc Int Soc Magn Reson Med 6, 24 (1998).
10. Naressi, A. et al. Java-based graphical user interface for the MRUI quantitation package. MAGMA 12, 141–52 (2001).
Figures