1993
Detection and quantification of NAD+ in the human brain at 3 T: Comparison of three different localization techniques1Departments of Radiology and Biomedical Research, University of Bern, Bern, Switzerland, 2Cardiff University Brain Research Imaging Centre (CUBRIC), School of Psychology, Cardiff University, Cardiff, United Kingdom, 3Department of Radiology, Center for Magnetic Resonance Research, University of Minnesota, Minnesota, MN, United States
Synopsis
The detection and quantification of Nicotinamide adenine dinucleotide (NAD+) was demonstrated to be challenging in 1H Magnetic Resonance Spectroscopy, due to its low concentration and reported polarization exchange with water. Frequency-selective excitation with slice-selective refocusing was proposed to prevent saturation-transfer from water. In this study we compare three techniques to access NAD+ quantification – standard WS semiLASER and two nWS (MC semiLASER and 2D I-CSE). NAD+ was detected with all techniques with a limited visibility for the WS semiLASER. While utilizing nWS concept allows to detect NAD+ at the visibility of 66%.
Introduction
Nicotinamide adenine dinucleotide (NAD) is a crucial cofactor in brain metabolism1,2,3. Its detection and quantification is challenging due to not only its low concentration but also a reported polarization-exchange with water leading to strong signal suppression with standard MRS sequences. To avoid saturation-transfer from water, studies on humans at 7T3,4 have used frequency-selective excitation with slice-selective refocusing that leaves the longitudinal magnetization of water intact.Here, a comparison of three techniques to assess the potential of NAD+ quantification on clinical scanners is presented. They include standard semiLASER5,6 with VAPOR water-suppression (WS), semiLASER with metabolite-cycling (MC)7,8 as a technique avoiding water presaturation, and ISIS-localization with chemical-shift-selective excitation (I-CSE)9, a type of non-water-excitation (nWE) technique.
Methods
10 healthy volunteers for each technique (12 in total), supraventricular VOI10: 50x75x20cm3, 3T MR Scanner (Prisma, Siemens), 64-channel receive head coil. Three localization techniques: semiLASER5, MC-semiLASER7,8, 2D I-CSE9. Transmit frequency at 7.3 ppm for semiLASER and MC-semiLASER; at 9.7 ppm for I-CSE. VOI-optimized B1+. Data processing with jmrui11 and MATLAB.WS-sLASER: VAPOR with 135Hz bandwidth and optimized flip angles; partial outer-volume suppression (OVS); 1280 scans; TE=35ms; TR=2500ms.
MC-sLASER: MC pulse of 22ms; no OVS; 768 scans; TE=35ms; TR=2500ms. 2D I-CSE: full OVS; TE=10ms; TR=3000ms; 640 scans; adapted raw data post-processing.
2D I-CSE: full OVS; TE=10ms; TR=3000ms; 640 scans; adapted raw data post-processing.
Fitting in FiTAID12 with identical Voigt models including prior-knowledge restraints and a simulated partial spectrum of NAD+ for all techniques but differing in downfield background modeling by a set of tightly-spaced Voigt lines. NAD+ Voigt line with fixed Lorentzian part (80ms T2). For semiLASER, the upfield spectrum was fitted first. NAD+ frequency was fixed relative to the main downfield peaks. For I-CSE, residual water and upfield peaks were removed by HLSVD and only the downfield part fitted (model extended by 2 Voigt lines representing background signal from the amide-signal tail).
Quantification via unsuppressed water from MC- semiLASER and estimated tissue water content based on tissue fractions. Differences in VOI profile for the techniques accounted for based on phantom measurements.
Results and Discussion
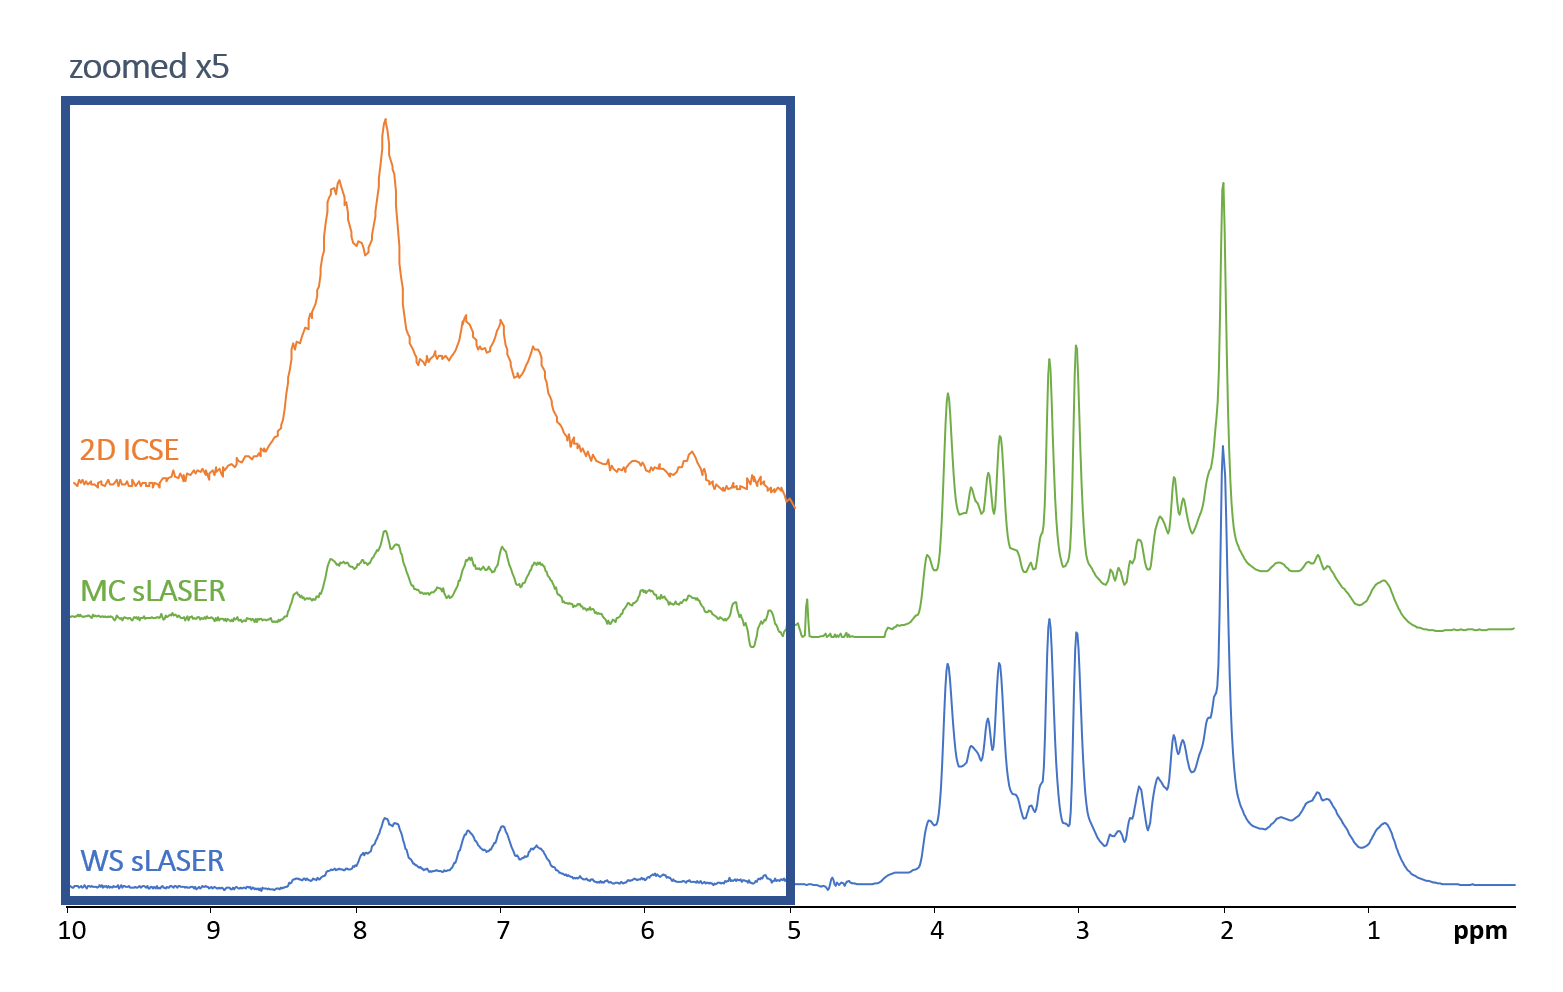
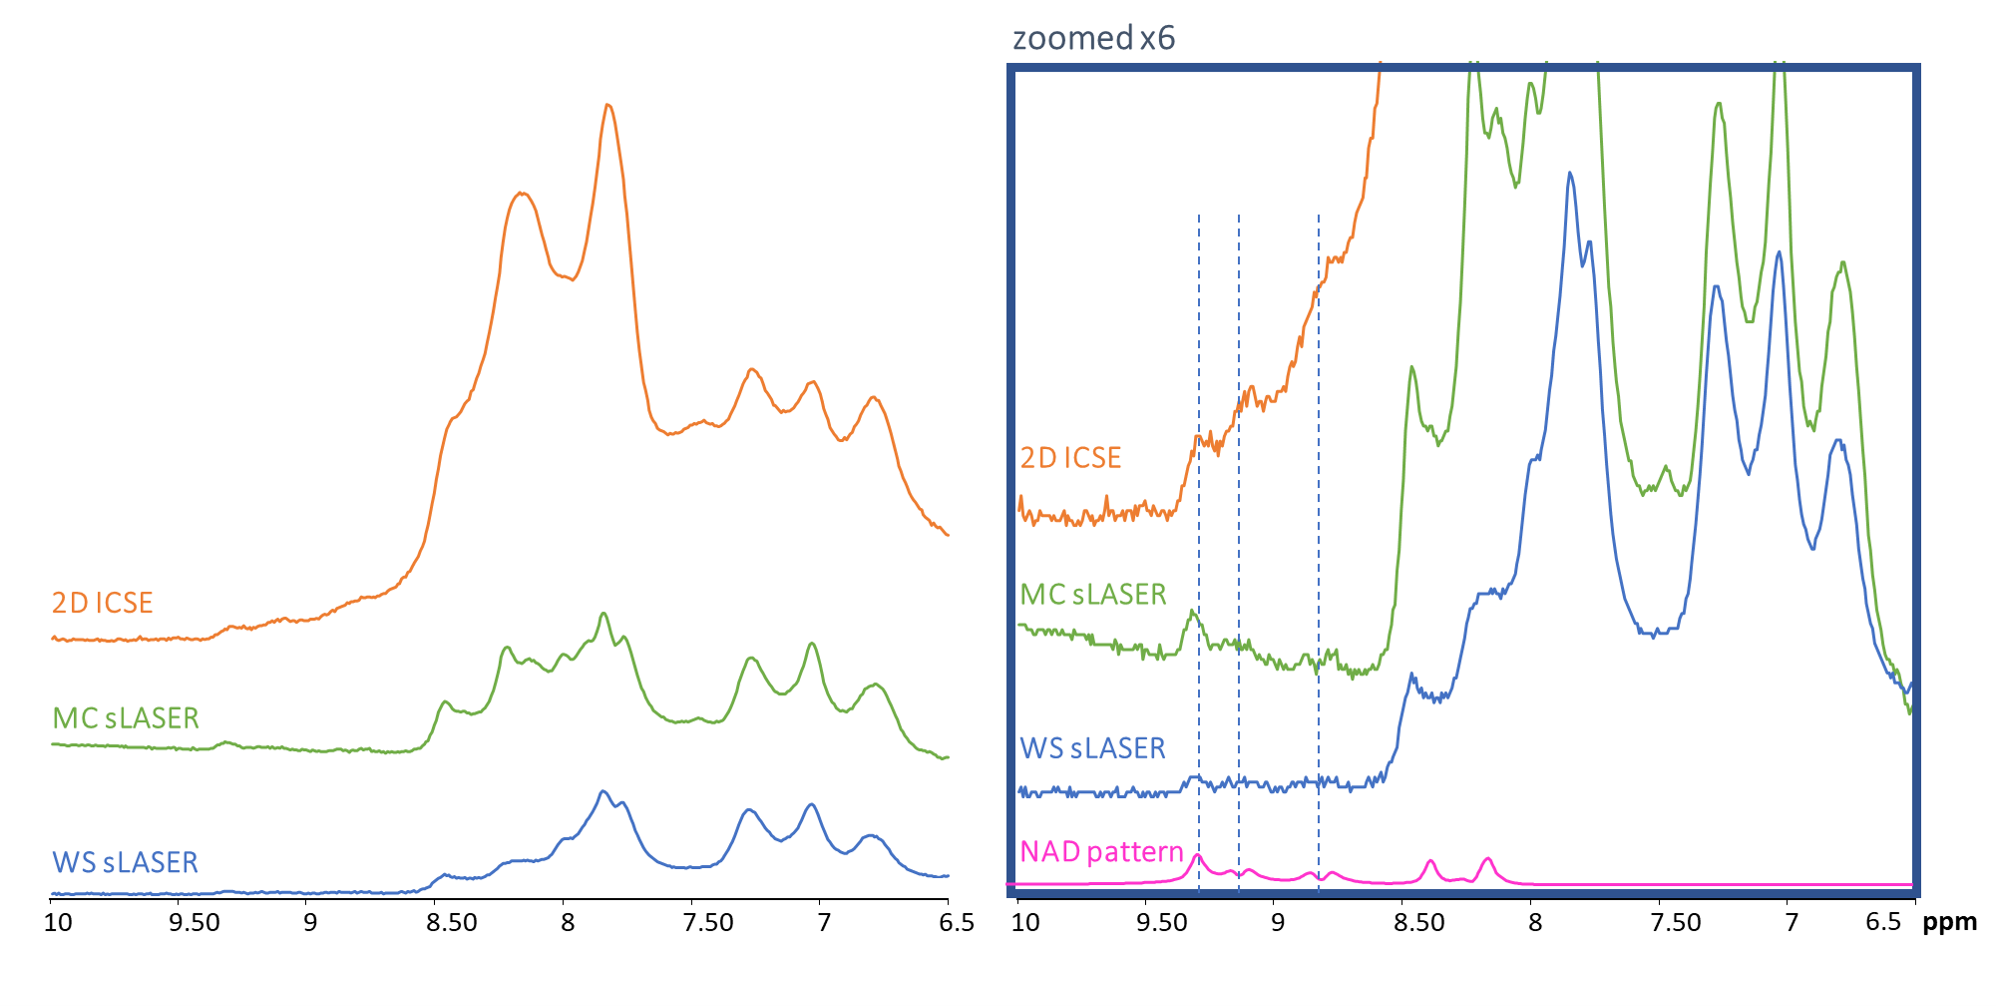
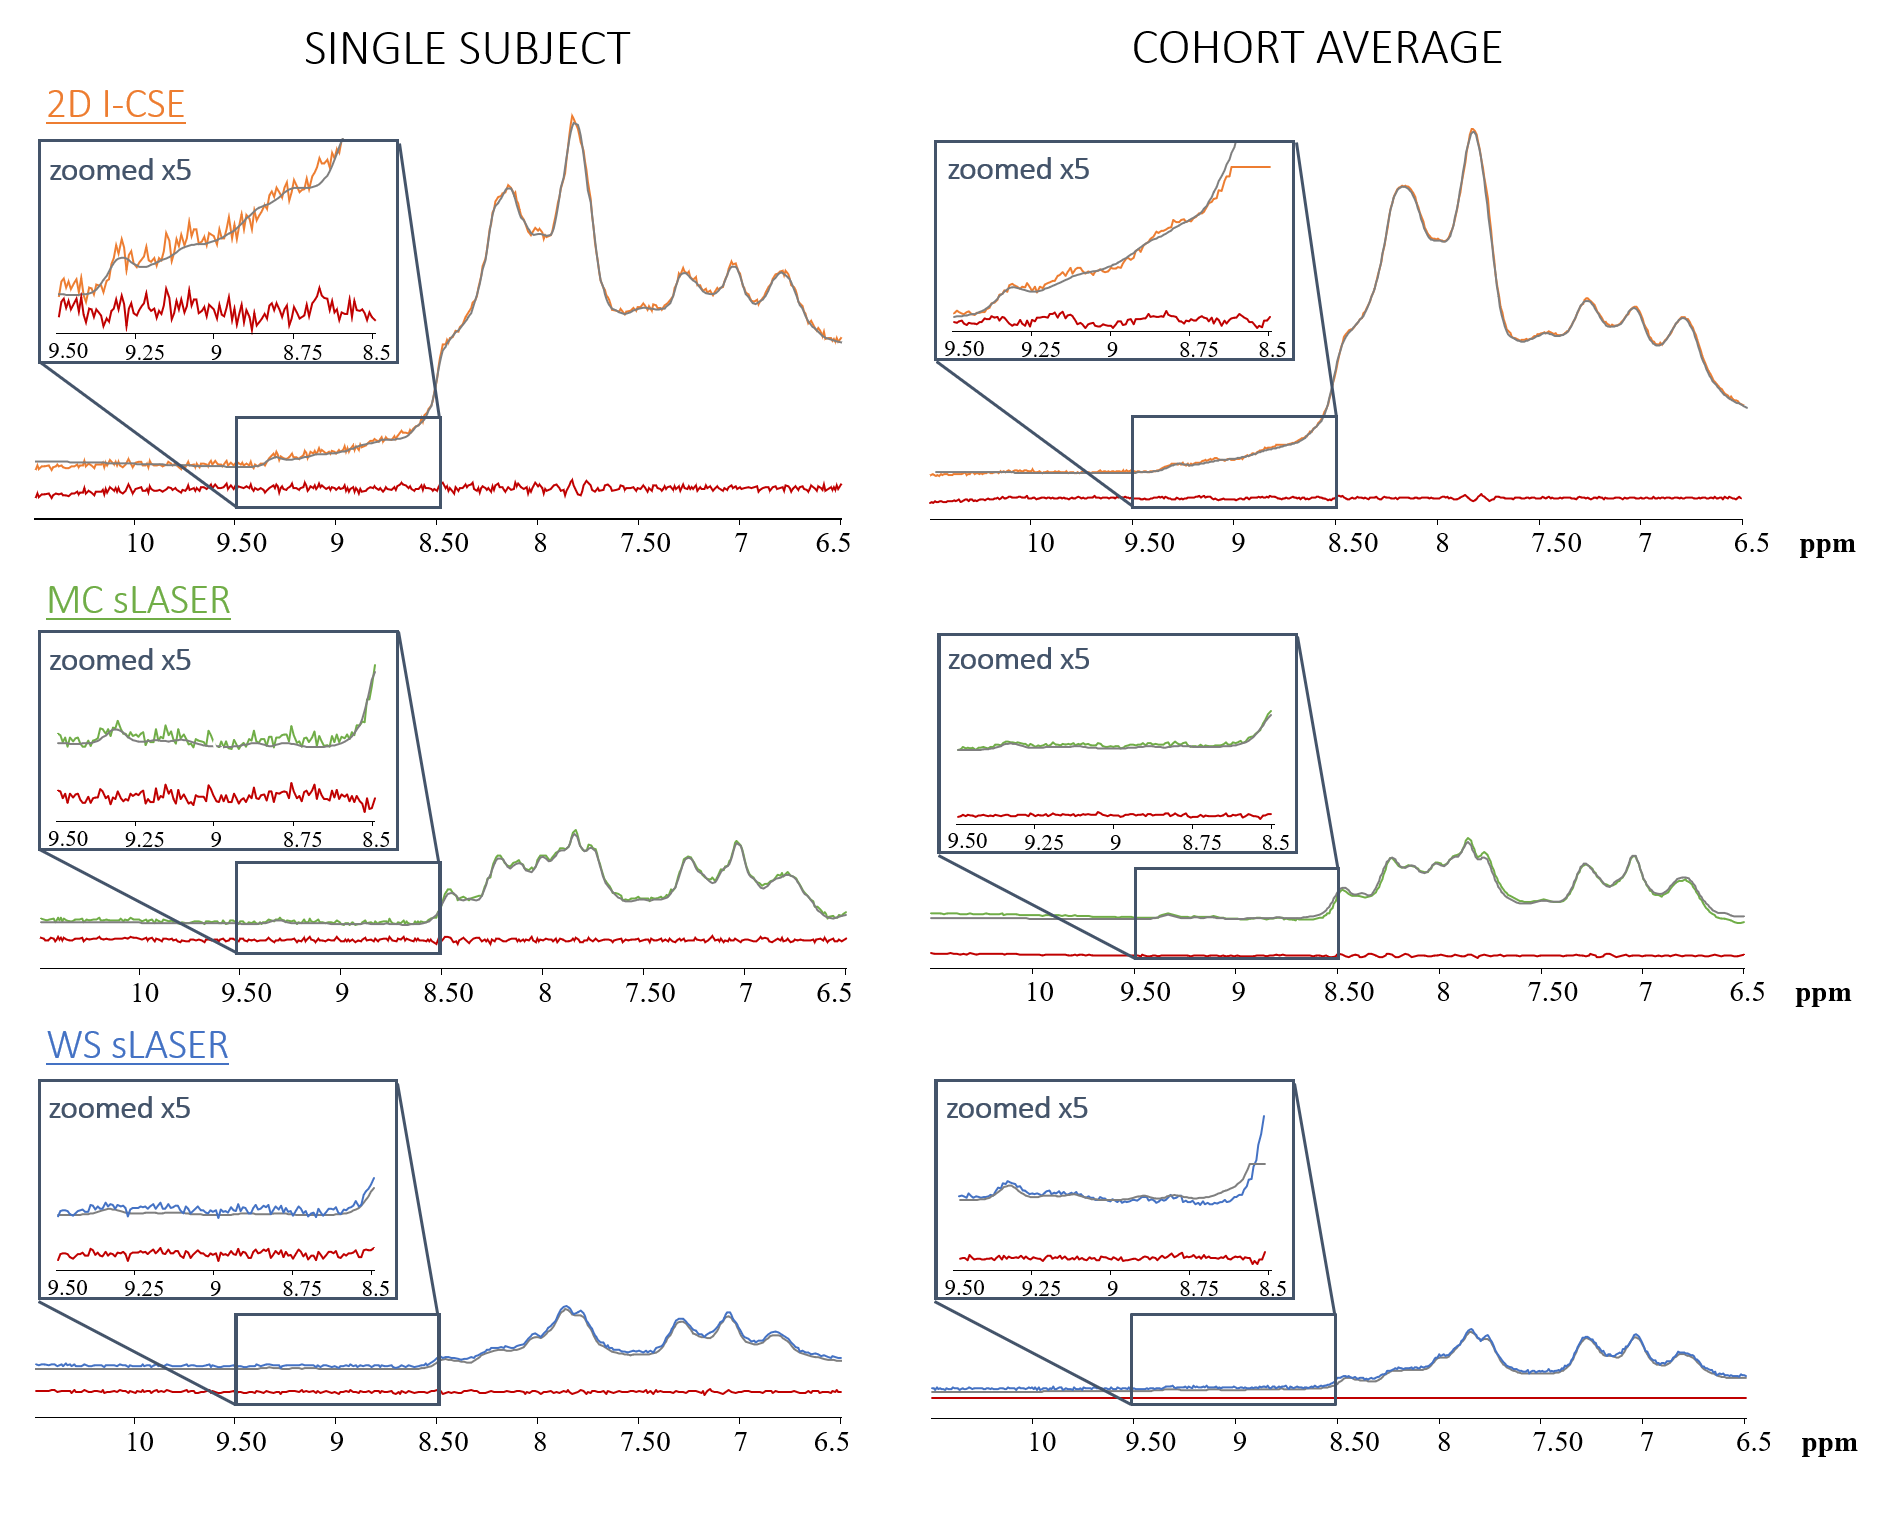
Typical spectra from a single representative subject for all techniques are presented in Figure-1. The semiLASER techniques provide both, the upfield and downfield spectrum at very high SNR, while the I-CSE sequence is limited to the downfield part. Signals from exchangeable protons are more prominent with MC than WS (~8.2 and 8.5 ppm), but I-CSE with much shorter TE and very limited periods of magnetization exchange clearly impresses with very large amide signal contributions at 8-8.5 ppm.In the up-scaled cohort spectra in Figure-2 a peak at 9.33 ppm attributable to the H2 proton of NAD+ is clearly visible for all methods. Furthermore, the techniques without WS show signal contributions from H6 and H4 of NAD+ (doublets at 9.14 and 8.83 ppm). With MC-semiLASER, those peaks are best represented with less overlap with the large amide signal than in I-CSE, which becomes even clearer when inspecting the results from model fitting in Figure-3. The model fits fairly well for all three techniques but results are visually most convincing for MC-semiLASER. For I-CSE the residues do not appear to contain noise only—probably due to amide baseline interference in the fit. In addition, linewidths and intensities for the NAD+ peaks were enforced by prior knowledge, not allowing for potential differences in T2 and MR-visibility.
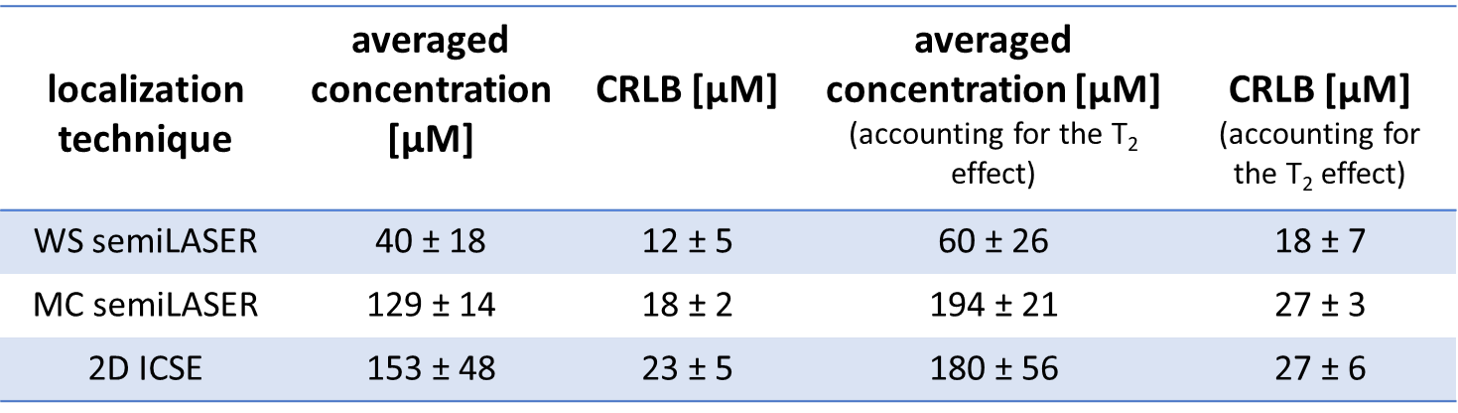
Table-1 contains the results of the quantification based on non-suppressed water. Raw tissue contents (i.e., without relaxation correction) show that I-CSE provides most NAD signal, followed by MC-semiLASER. After T2-correction, estimated tissue contents are similar for MC-semiLASER and I-CSE, while a lower value for WS-semiLASER confirms the limited visibility associated with saturation transfer from water. For MC-semiLASER the cohort SD was very similar to the CRLB while for I-CSE this value is about double the CRLB. For WS-semiLASER, the CRLB are smallest in absolute terms, but largest as a percentage of the estimated value. The estimated tissue content of ~190 μmolar suggests visibility of roughly 66% when using the values from 31P-MRS as reference4. This is higher than reported earlier for human brain4, but similar to the value for rat brain13.
Conclusions
Three MRS techniques with different approaches to deal with the water resonance have been evaluated.Standard localization with water-presaturation with a long train of RF pulses does show the NAD+ resonances in an optimized setting with large SNR, though truly convincing only in a group average spectrum6.
Localization using semiLASER with moderately short TE but metabolite-cycling instead of WS and thus limited periods for saturation-exchange to occur is well-suited for NAD+ quantification, also for single subjects, given a relative CRLB of 14% and a cohort SD of 11%. A large VOI and 32 min scan time are needed for this precision.
Optimal acquisition conditions are achieved with I-CSE that features shorter TE and minimal time for saturation-exchange. However, at 3T the large amide signals yield an ill-defined background signal that interferes with robust and precise quantification of NAD+.
Comparing with tissue levels measured invasively or with 31P-MRS, the presented 1H-MRS methods show a MR visibility of ~2/3 for both methods without presaturation, somewhat higher than reported previously for higher fields3,4.
Acknowledgements
This work is supported by the Swiss National Science Foundation (SNSF #320030‐175984).References
1. Imai, Cell Biochem Biophys (2009) 53: 65-74
2. Okabe, et al., J Biomed Sci 26, 34 (2019); (https://doi.org/10.1186/s12929-019-0527-8)
3. Bagga, et al., Magn. Reson. Med 25 (2020) 83:806-814
4. de Graaf, et al., Magn. Reson. Med (2017) 78: 828-835
5. Marjanska and Auerbach, Center for Magnetic Resonance Research, University of Minnesota, USA; https://www.cmrr.umn.edu/spectro/
6. Hoefemann, et al., Proc. Intl. Soc. Mag. Reson. Med. (2019) 26: #2259
7. Dreher, et al., Magn Reson Med. (2005) 54:190–195
8. Giapitzakis, et al., Magn Reason Med (2018) 79:1841-1850
9. Dziadosz, et al., Magn Reson Med (2020); (epub; https://doi.org/10.1002/mrm.28322)
10. Hoefemann, et al., NMR Biomed. (2019) 32:e4161.
11. Stefan et al., Measurement Science & Technology (2009) 20:104035
12. Chong, et al., Magn Reson Mater Phy (2011) 24:147-164
13. de Graaf, et al., NMR Biomed. (2014) 27:802-809
Figures