1987
Potential of Dual-SPECIAL sequence in revealing interregional differences in human brain metabolite concentrations1McGill university, Montreal, QC, Canada, 2Centre d'Imagerie Cérébrale, Douglas Mental Health University, Montreal, QC, Canada
Synopsis
Previously, we demonstrated the feasibility of performing simultaneous MRS localization in two human brain regions using the dual-SPECIAL technique. Based on the SPin ECho, full Intensity Acquired Localized sequence, this approach yields simultaneous acquisition from two regions in combination with Hadamard encoding, reducing the acquisition time by half compared with serial acquisition. Here, we demonstrate that MRS acquisition using dual-Special sequence reveals significant differences in the ratio of tCho/tCr between anterior and posterior regions and higher concentration of several metabolites in regions with higher gray matter fraction.
INTRODUCTION
In many MRS studies, it is desirable to obtain metabolic information from multiple brain regions or tissue structures of interest. The cingulate cortex has been known as central hub in sensory–emotion–memory/anticipation–motor integration and studying different parts of the cortex may shed light on region-specific metabolic changes due to disease or treatment response. Likewise, studying the neurochemistry of different tissue types such as gray matter and white matter may provide insights into tissue-type specific pathology. Single voxel (SV) MRS sequences are limited to studying one volume of interest (VOI) at a time. Therefore, the conventional solution to obtain MRS data from multiple regions using SV sequences is to serially scan the different brain regions, which leads to a long acquisition time. Recently we developed an approach based on the SPin ECho, full Intensity Acquired Localization (SPECIAL) sequence1, called the dual-SPECIAL sequence2, to simultaneously record spectra from two regions of interest. The approach makes use of Hadamard encoded ISIS preparation3 to separate the individual signal contributions from each region. Importantly, the dual-SPECIAL sequence reduces the acquisition time by half compared with sequential measurement of two regions using conventional SV-MRS. In this study, we show the feasibility of performing simultaneous MRS using the dual-SPECIAL sequence at multiple brain regions including anterior and posterior cingulate cortices (ACC & PCC), and the supplementary motor area (GM-rich) and adjacent lateral white matter (WM-rich).METHODS
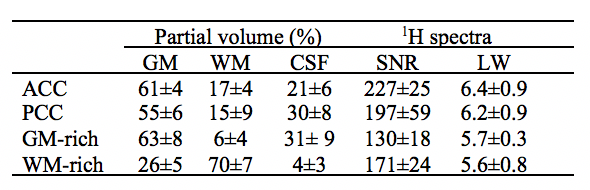
Six healthy volunteers provided informed consent to participate in this study. Experiments were performed on a 3T Siemens Prisma MR scanner with a commercial body transmit-volume coil and 32-channel receive array. To guide placement of the VOIs for MRS acquisition, a three-dimensional T1-weighted anatomical image was acquired using MPRAGE4. In the first scan, two equal-size voxels (2.0×2.0 ×2.0 cm3) were placed in ACC and PCC regions and separated by 8.0 cm. In the second scan, two equal-size voxels (2.5×1.0×2.5 cm3) were positioned; one in the medial GM-rich supplementary motor area, and the other in the adjacent lateral WM, separated by 2.0 cm. Bo field inhomogeneities were minimized using the GRE-shim procedure, yielding a water linewidth of 5-7 Hz (table 1). Localized water-suppressed 1H spectra were acquired from both pairs of regions using the dual-SPECIAL sequence with acquisition parameters of TR/TE = 4000/8.5 ms and 128 averages. Localized water 1H spectra were also acquired from the same regions to be used as a reference. Spectral pre-processing steps, including coil combination, phase and frequency correction and averaging were performed in MATLAB using the FID-A toolkit5. Concentration of metabolites were estimated using LCModel fit and corrected for partial volume6.RESULTS
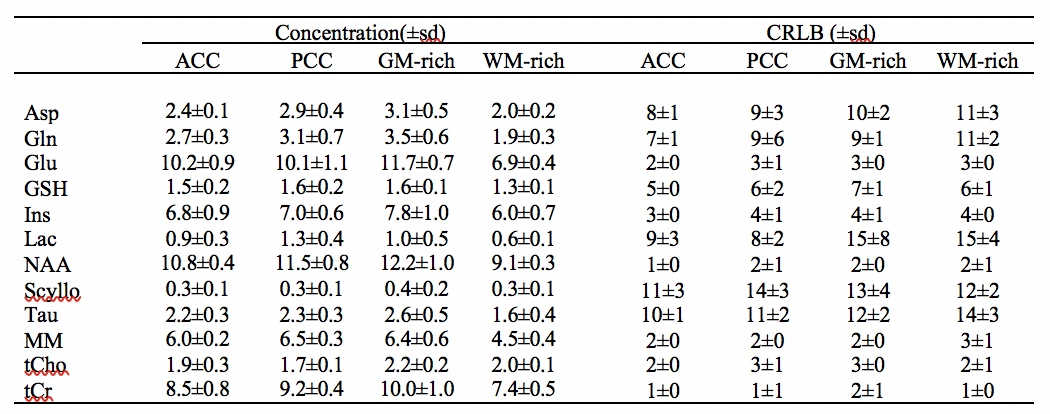
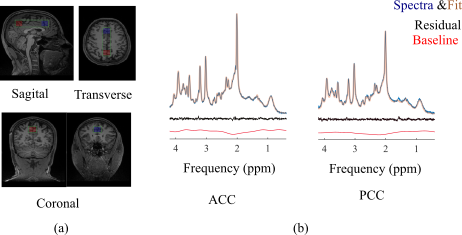
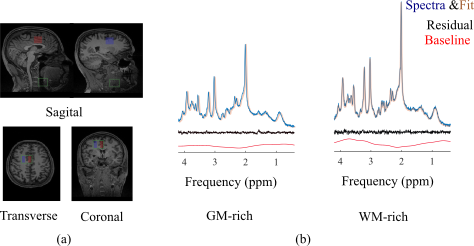
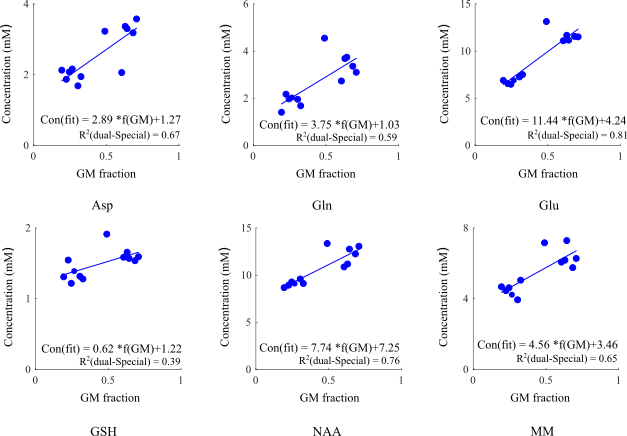
Figure 1.b and Figure 2.b show the regions of interest and representative 1H spectra from each region in a single participant along with LCModel fit. Table 2 lists the absolute averaged concentration of metabolites and their CRLB along with their variation over six subjects. LCModel quantification of metabolite levels in each region showed slightly lower concentration level for all metabolites except Glu and tCho in ACC than in PCC. Glu concentration level had a fairly homogeneous distribution between both regions and tCho was 14% higher in ACC than PCC. However, none of these differences are statistically significant. A statistically significant difference was found between the ratio concentration of tCho/tCr in ACC and PCC (p-value = 0.002). The concentration of most metabolites in the GM-rich region was higher than in the WM-rich region. This difference was statistically significant for Asp, Gln, Glu, GSH, NAA, and MM (p-value <0.002). Linear regression results for metabolite concentrations versus their GM fraction yielded a R2 value ranging from 0.39 to 0.81 (Figure 3).DISCUSSION
LCModel analysis yielded excellent fits for the acquired spectra, illustrated by smooth flat baseline and small residuals, as shown in Figure 1.b and Figure 2.b. The good spectral quality allowed the quantification of 12 metabolites with CRLB <15% at four different regions. Overall, the small intersubject variability for most metabolites (Table 2) indicates that the measurements were highly reliable and consistent. The higher concentration of tCho found in ACC relative to PCC is in agreement with a previous study that found slightly more choline containing compounds in frontal than parietal and occipital human cortex7. It is further consistent with previous MRS studies in which the ratio of tCho/Cr increased from frontal to posterior paramedian gray matter 8,9. Considering the similarity in tissue composition of the ACC and PCC regions studied (Table 1), it is likely that membrane lipid composition and metabolism contribute to the regional dependence of tCho and tCho/tCr. In our study, we found higher concentrations for most metabolites in GM-rich region than WM-rich as previous studies10,11. The strong correlation of metabolites estimated from GM-rich and WM-rich to GM fraction in Figure 3 indicates the role of tissue composition of VOIs in interregional variation of metabolite concentration.CONCLUSION
1H MRS using the dual-SPECIAL sequence yielded reliable and consistent measurement from ACC, PCC, GM-rich and WM-rich regions and revealed interregional variations in concentration of metabolites. The results of this study showed that the dual-SPECIAL sequence can be considered a practical approach in studies where multiple regions for single voxel spectroscopy are involved.Acknowledgements
No acknowledgement found.References
1. Mlynárik V, Gambarota G, Frenkel H & Gruetter R. Localized short-echo-time proton MR spectroscopy with full signal-intensity acquisition. Magn Reson Med, 2006;56:965–970.
2. Dehghani M, Edden R & Near J. Simultaneous ultra-short TE-MRS in two voxels using a SPECIAL sequence with Hadamard encoding. ISMRM. 2020.
3. Hadamard J. Résolution d’une question relative aux déterminants. Bulletin des Sciences Math, 1893; 17.
4. Mugler J P & Brookeman J R. Three-dimensional magnetization-prepared rapid gradient-echo imaging (3D MP RAGE). Magn Reson Med. 1990;15:152–157.
5. Simpson R, Devenyi G A, Jezzard P, et al. Advanced processing and simulation of MRS data using the FID appliance (FID-A)-An open source, MATLAB-based toolkit. Magn Reson Med. 2017;77:23–33.
6. Near J, Harris A D, Juchem C, et al. Preprocessing, analysis and quantification in single-voxel magnetic resonance spectroscopy: experts’ consensus recommendations. NMR in Biomed. 2020;e4257.
7. Nitsch R M, Blusztajnc K, Doylea F M, et al. Phospholipid metabolite levels are altered in cerebral cortex of patients with dominantly inherited olivopontocerebellar atrophy. Neuroscience Letters, 1993;161:191–194
8. Tedeschi G, Bertolino A, Lundbom N, et al. Cortical and
subcortical chemical pathology in Alzheimer’s
disease as assessed by multislice proton magnetic resonance spectroscopic
imaging. Neurology. 1996;47:696–704.
9. Pouwels P J & Frahm J. Regional metabolite concentrations in human brain as determined by quantitative localized proton MRS. Magn Reson Med. 1998;39:53–60.
10. Hong D, van Asten J J A, Rankouhi S R, et al. Implications of the magnetic susceptibility difference between grey and white matter for single-voxel proton spectroscopy at 7 T. J Magn Reson. 2018;297:51–60.
11. McLean M A & Barker G J. Concentrations and magnetization transfer ratios of metabolites in gray and white matter. Magn Reson Med. 2006;56:1365–1370.
Figures