1986
Atlas-based adaptive Hadamard-encoded Acquisition for Multiband 2D MRSI at 3T1Department of Radiology and Biomedical Imaging, University of California, San Francisco, San Francisco, CA, United States
Synopsis
Proton MR spectroscopy has been widely used for non-invasive assessment of brain metabolites. Metabolic alterations in the motor and sensory cortex, cingulate cortex and subcortical structures have been associated with pathology. It is desirable to acquire MRSI in these regions simultaneously with short scan time and sufficient SNR. We have developed a novel technique for simultaneous multiband 2D MRSI acquisition, which combines automated atlas-based prescription and adaptive Hadamard pulses. This technique helps to reduce prescription time, improve reproducibility and increase SNR efficiency.
Introduction
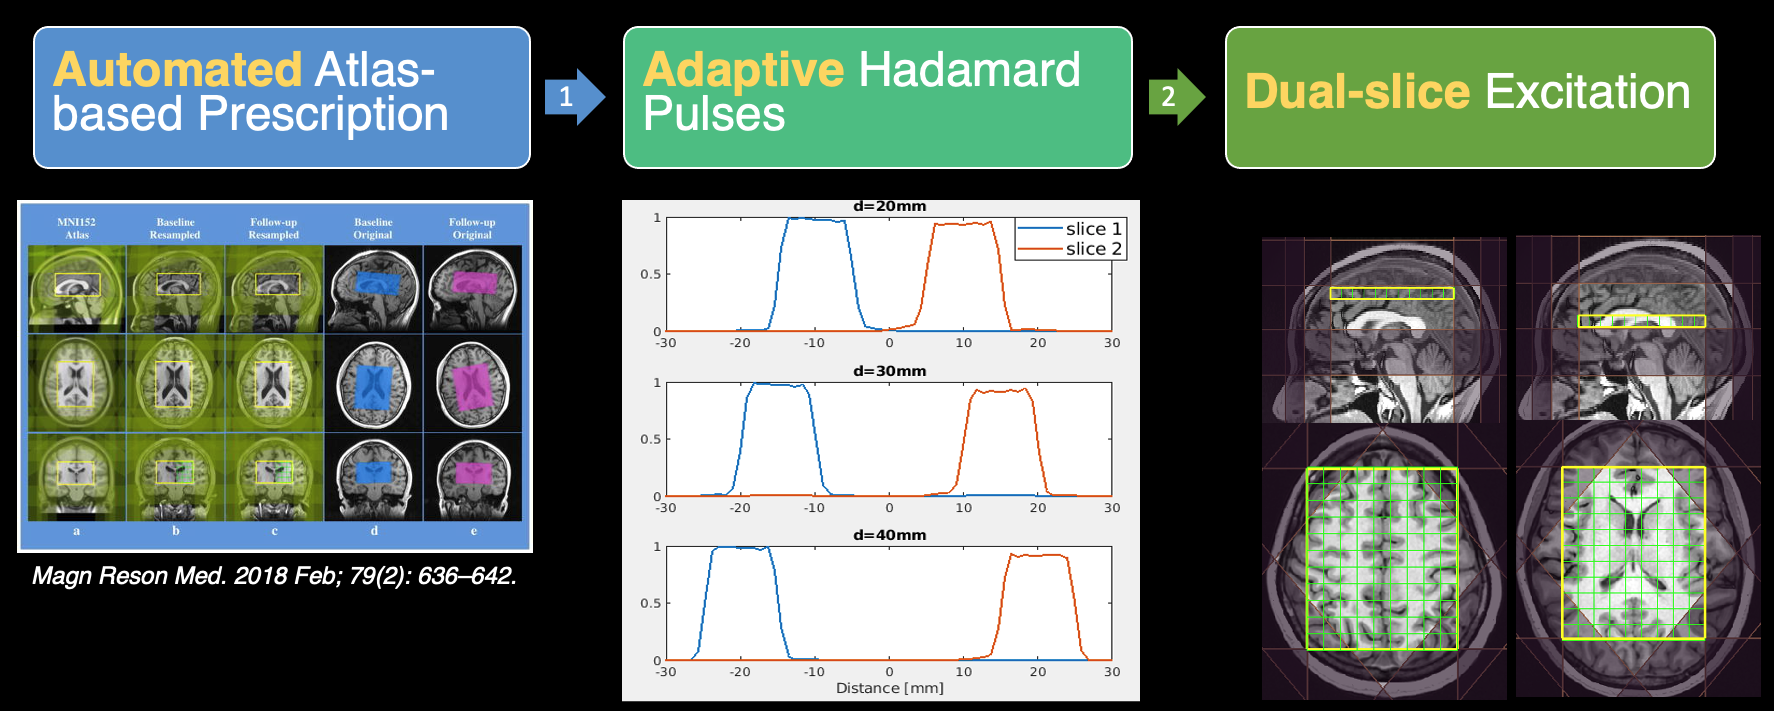
1H MRS is a powerful tool for non-invasively investigating alterations in brain metabolism from specific anatomical locations in patients with neurological and psychiatric diseases1. Single voxel spectroscopy is most commonly available methodology but can miss the regions of interested due to limited coverage and coarse resolution. 3D MRSI acquisitions provide more spatial information but requires much longer acquisition time, making it difficult for clinical evaluation. When non-whole-brain metabolite information is needed, such as motor cortex and deep grey structures, two 2D MRSI acquisitions could be sufficient. However, extra prescription, preparation and pre-scan could make it more complicated and time consuming. Hadamard encoding is efficient and robust for multiband excitation2,3, meanwhile provides an improved SNR efficiency proportional to the square root of number of slices. The purpose of this study was to develop an efficient method for multi-slice 2D MRSI acquisition within a clinical feasible acquisition time. By combining atlas-based automatic prescription4,5, we designed adaptive double-band Hadamard pulses for automatic and accurate two-slice 2D MRSI acquisition.Methods
The study was performed on a GE Discovery 750 3T scanner with a 32‐channel head coil. Hadamard pulses were constructed by vector superposition of single-band RF pulse, which was designed by Shinnar–Le Roux algorithm6,7. The 90˚ localization pulse in PRESS was replaced with Hadamard pulses. The distance of two simultaneously excited slices would be automatically calculated based on atlas prescription in order to adaptively generate Hadamard pulses. With the tailored Hadamard pulses, two slices were acquired and encoded in a two-echo scan. An overview diagram of the method is illustrated in Figure 1.Phantom scans
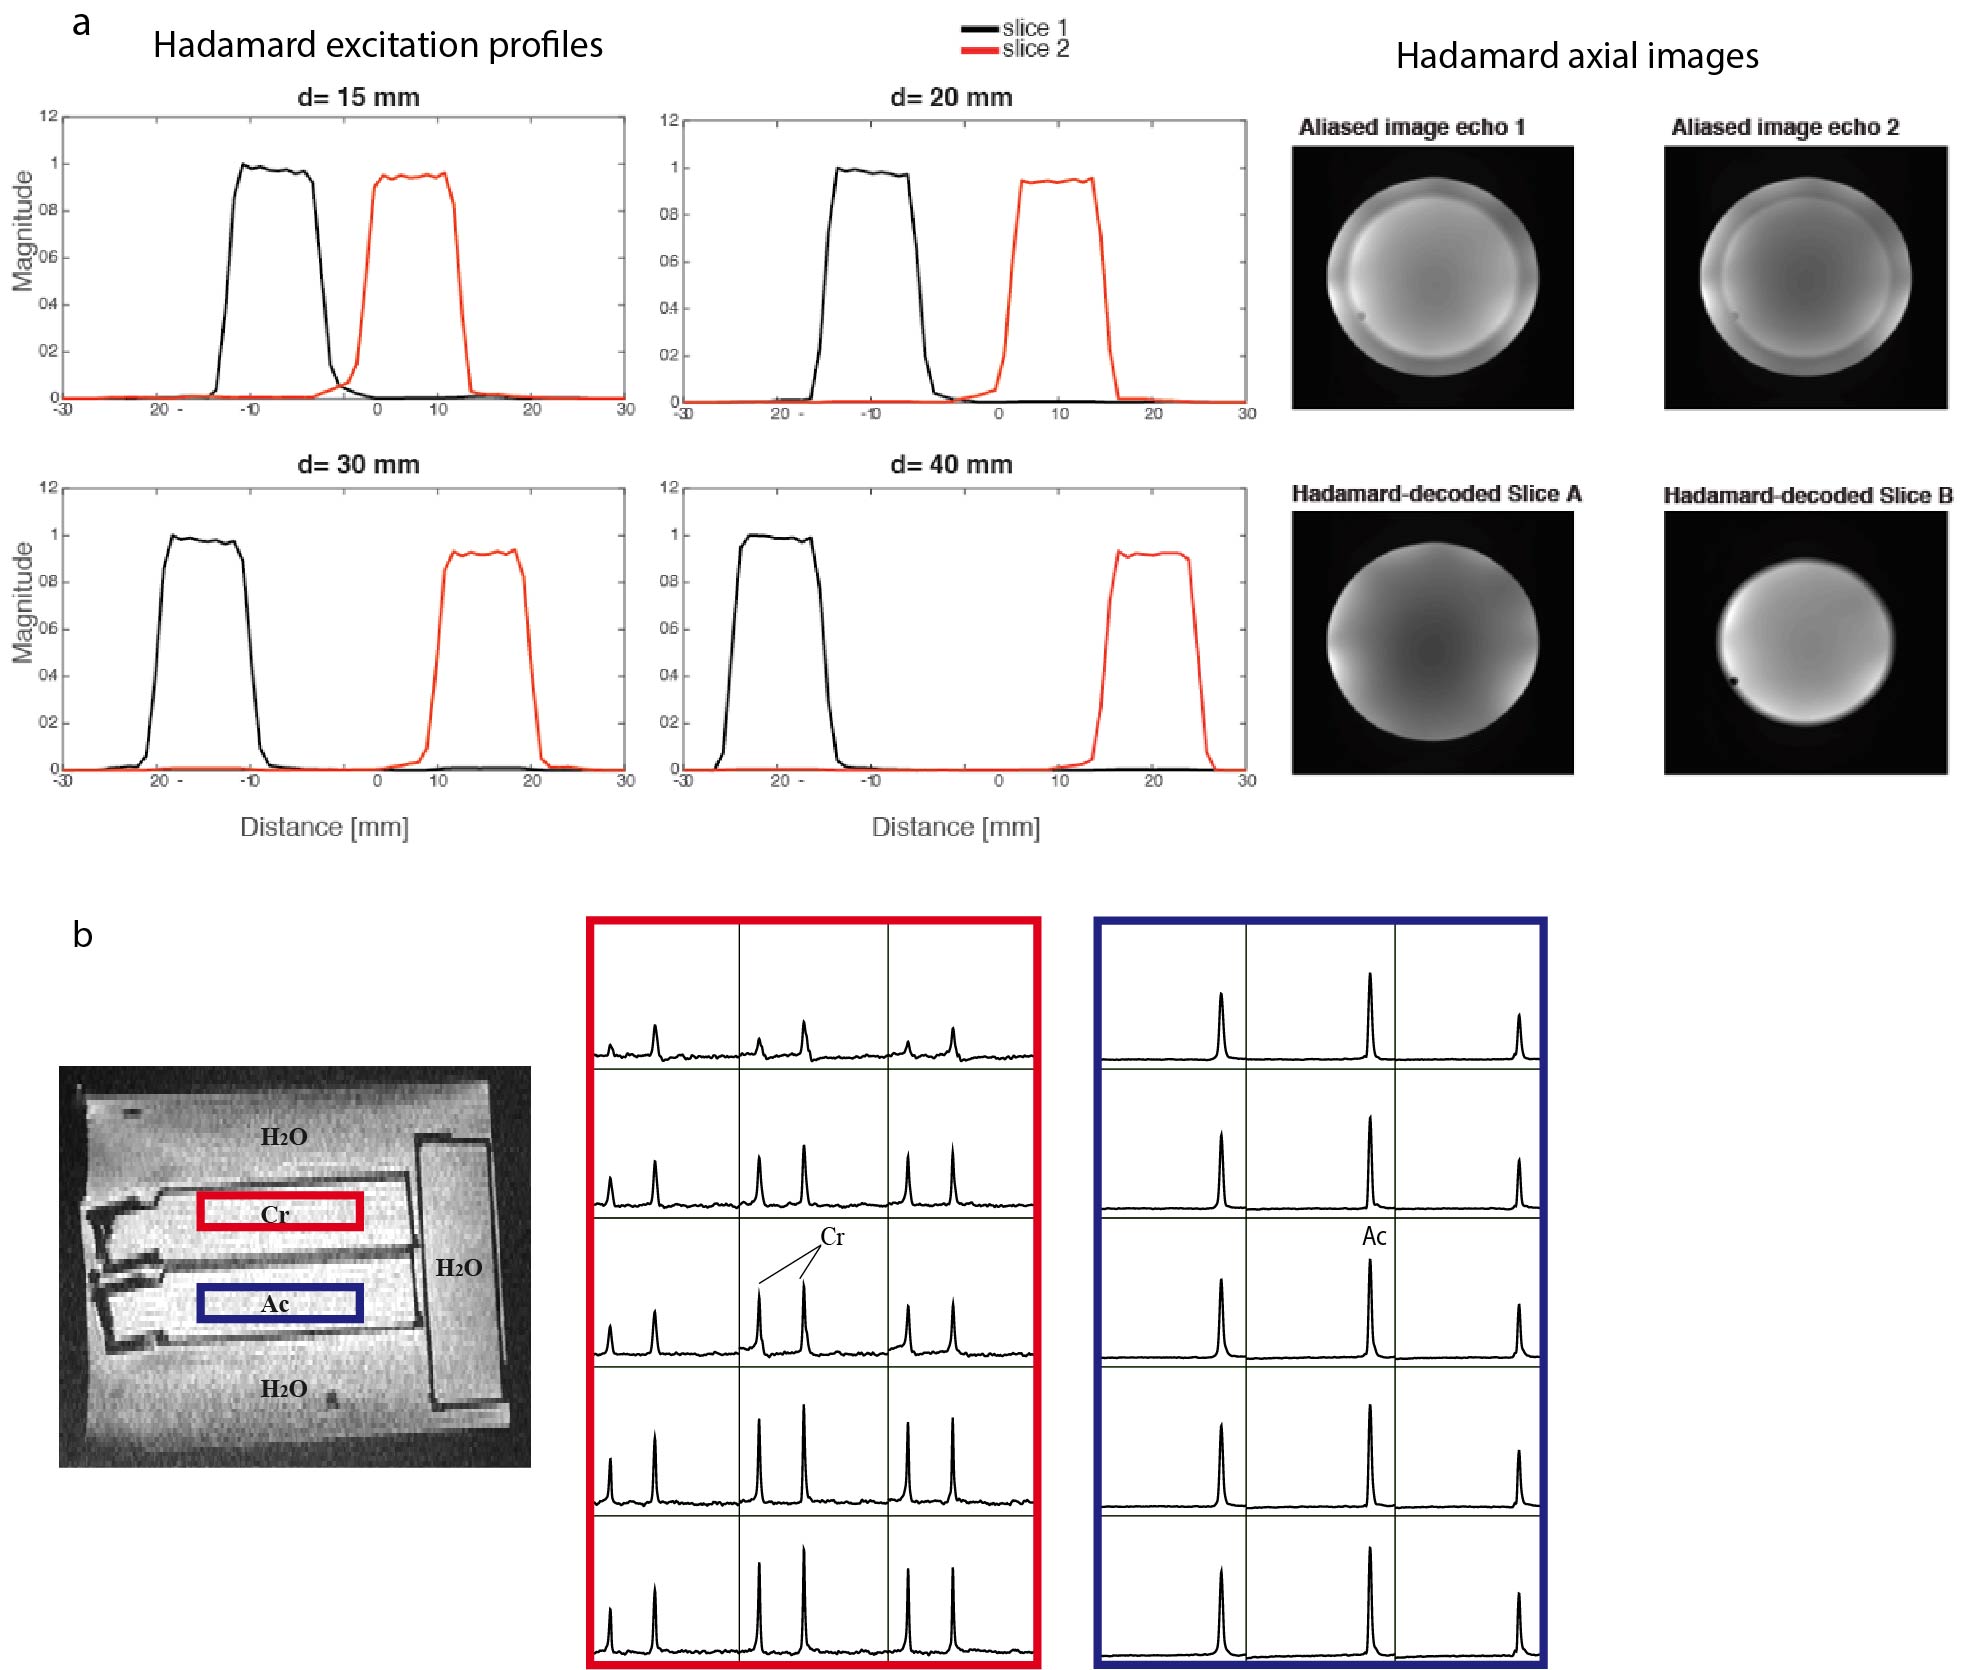
A standard brain metabolite phantom was used to evaluate slice localization profiles. Signal bleeding between slices was assessed with a homemade phantom, composed of two adjacent compartments immersed in a large container. One compartment contained 1% creatine (Cr) solution, and the other contained 5% acetate (Ac) solution. A GABA phantom was used for evaluating the method’s performance in GABA-editing scan.
In-vivo scans
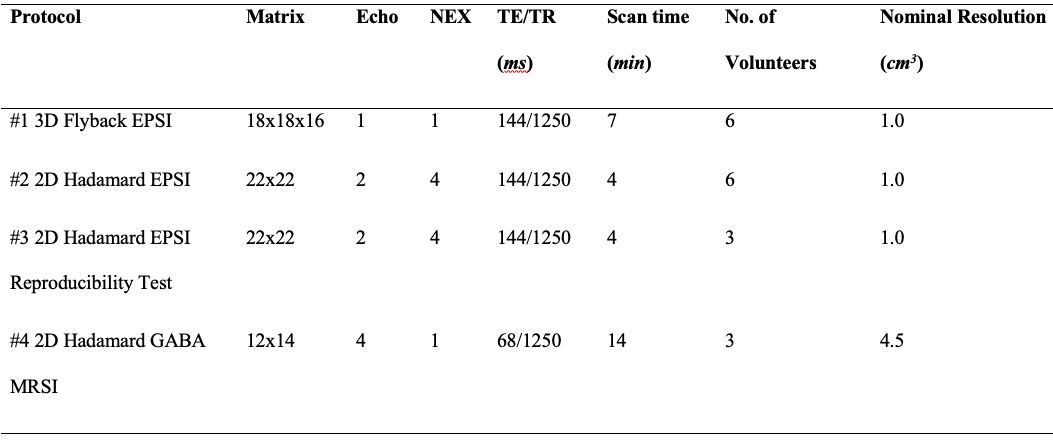
Nine healthy volunteers (4 males, 5 females; median age, 26±5 years) were recruited for this study. None of them had a history of neurological disorders and all of them provided informed consent prior to MR exams, as approved by our Institutional Review Board at UCSF. Figure 2 lists all in vivo MRSI measurement protocols. Data analysisMRSI data were processed offline with the GE Orchestra package on Matlab, SIVIC and in-house scripts, and then quantified using LCModel8.
Results
Phantom resultsHadamard excitation profiles and images are shown in Figure 3a. The home-made phantom and 2D spectra are shown in Figure 3b. Ac contamination in the Cr compartment was about 0.4%. The SNRAc of Hadamard to single-slice MRSI ratio was 1.32, close to the theoretical value (40%). GABA/NAA ratio acquired by single voxel, single-slice, Hadamard MRSI in top and bottom slices were 0.11, 0.12, 0.11 and 0.11.
In-vivo results
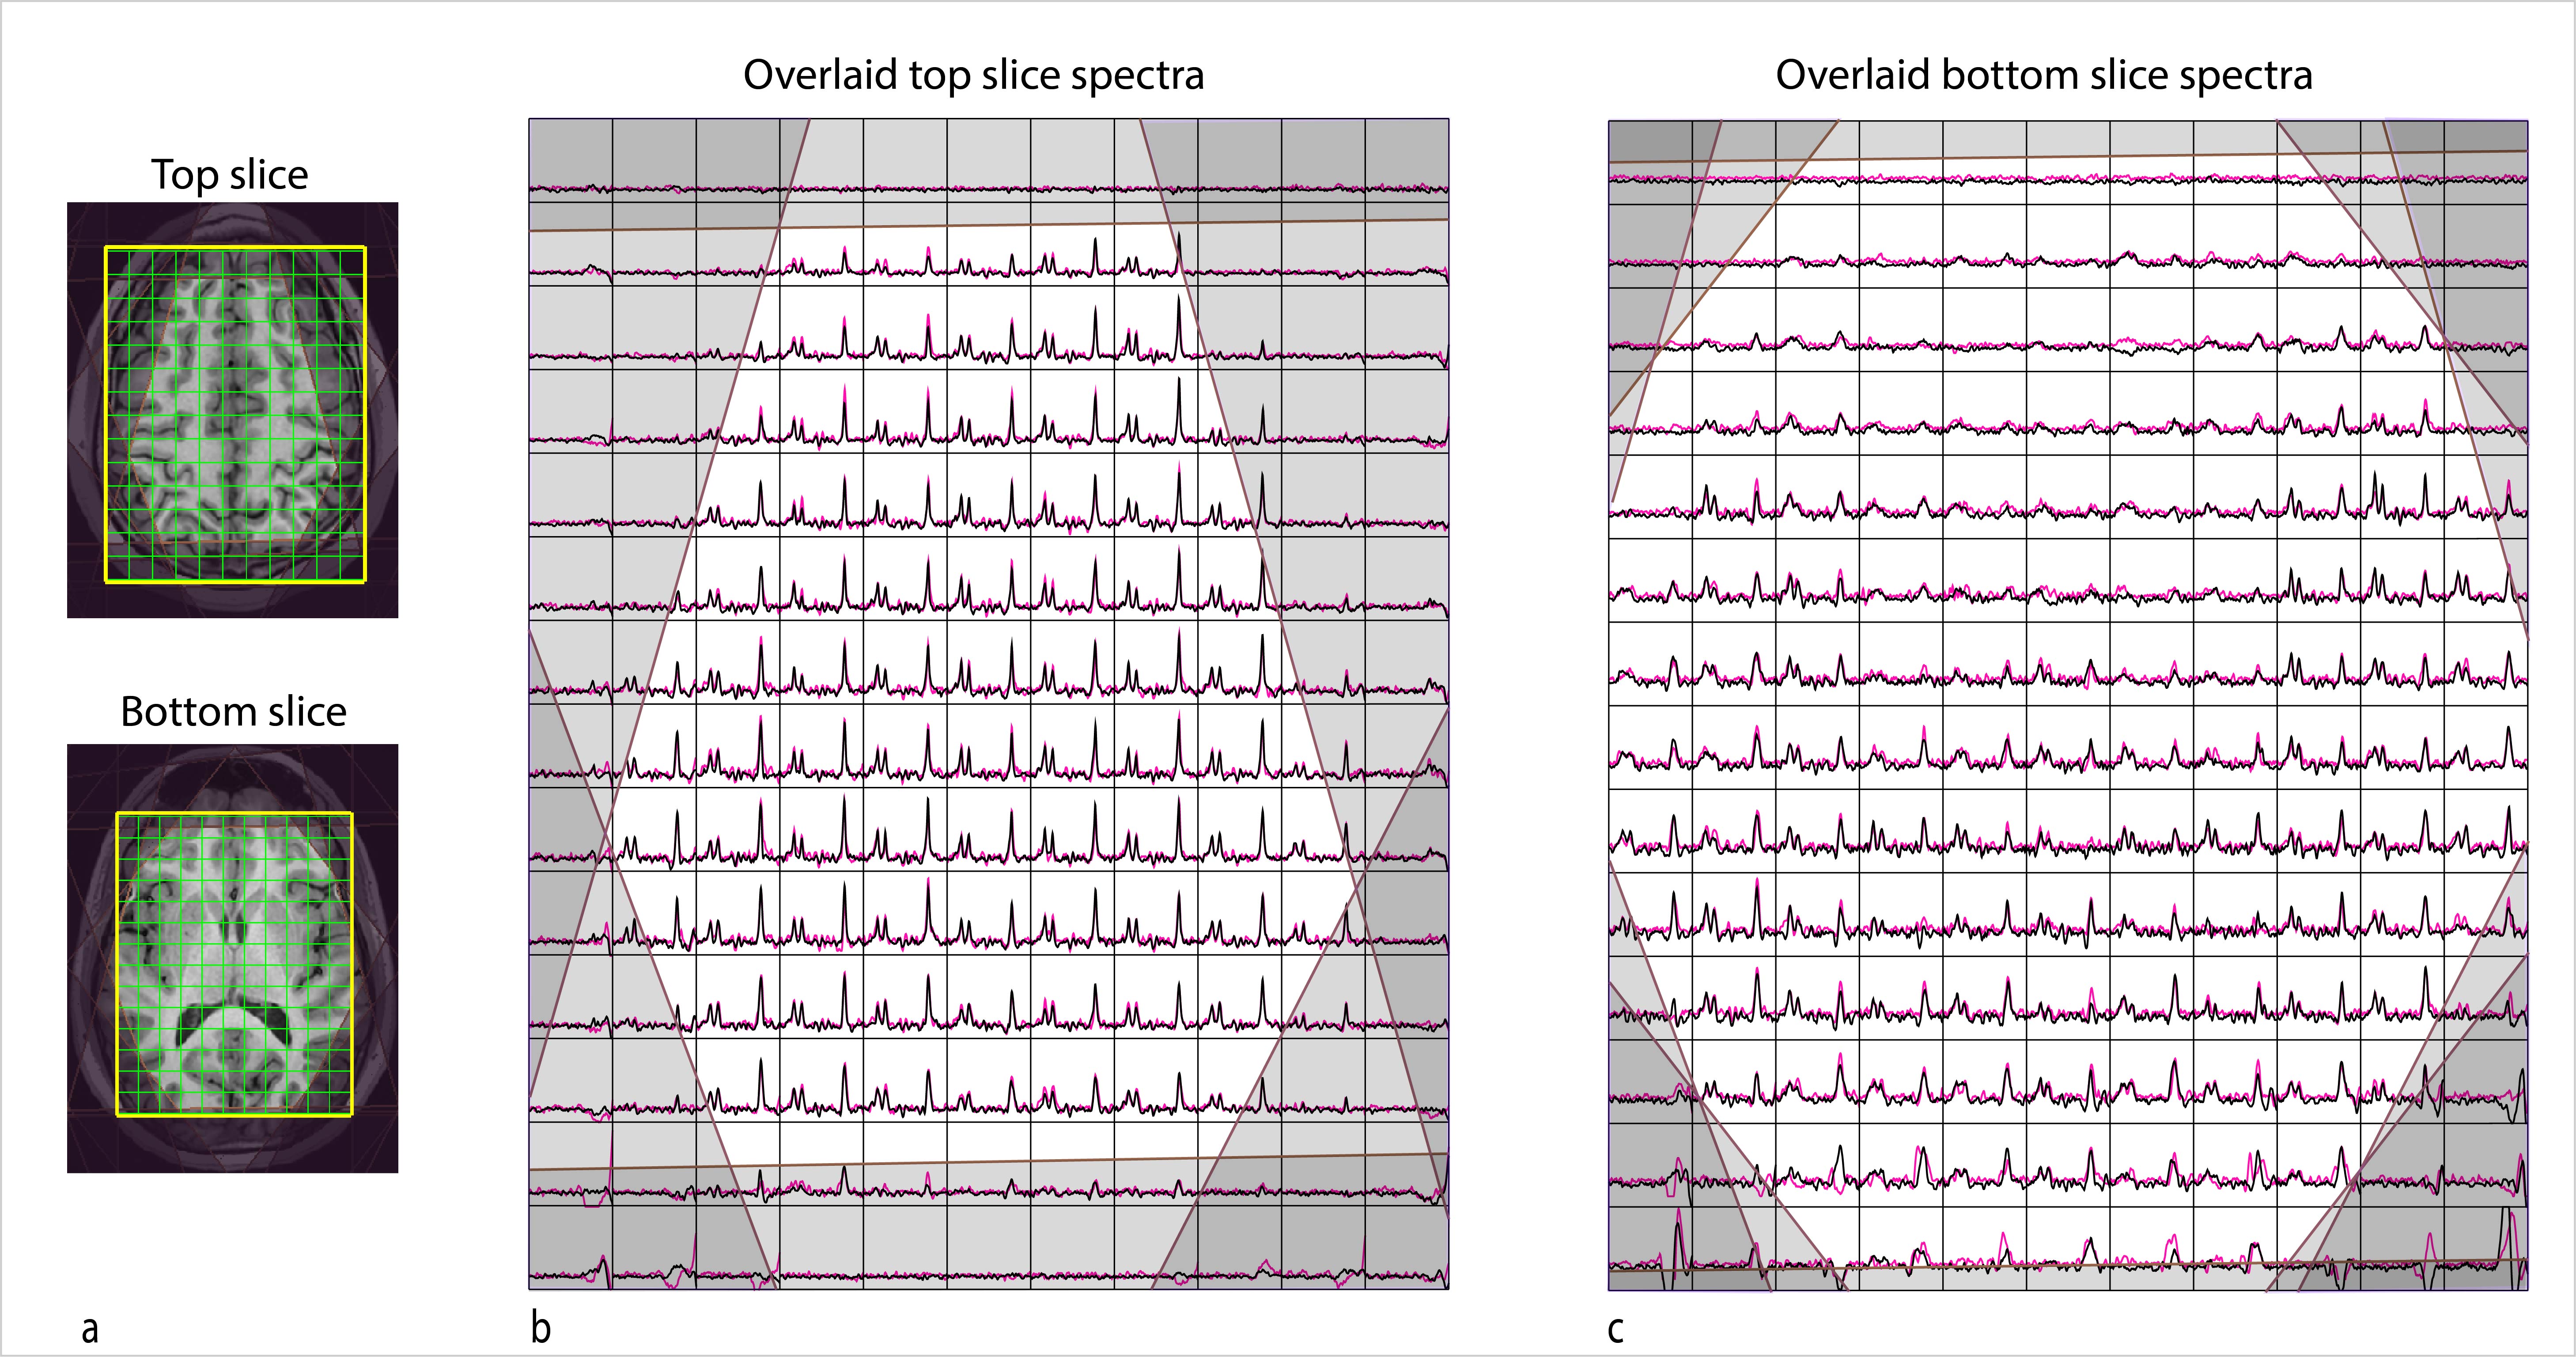
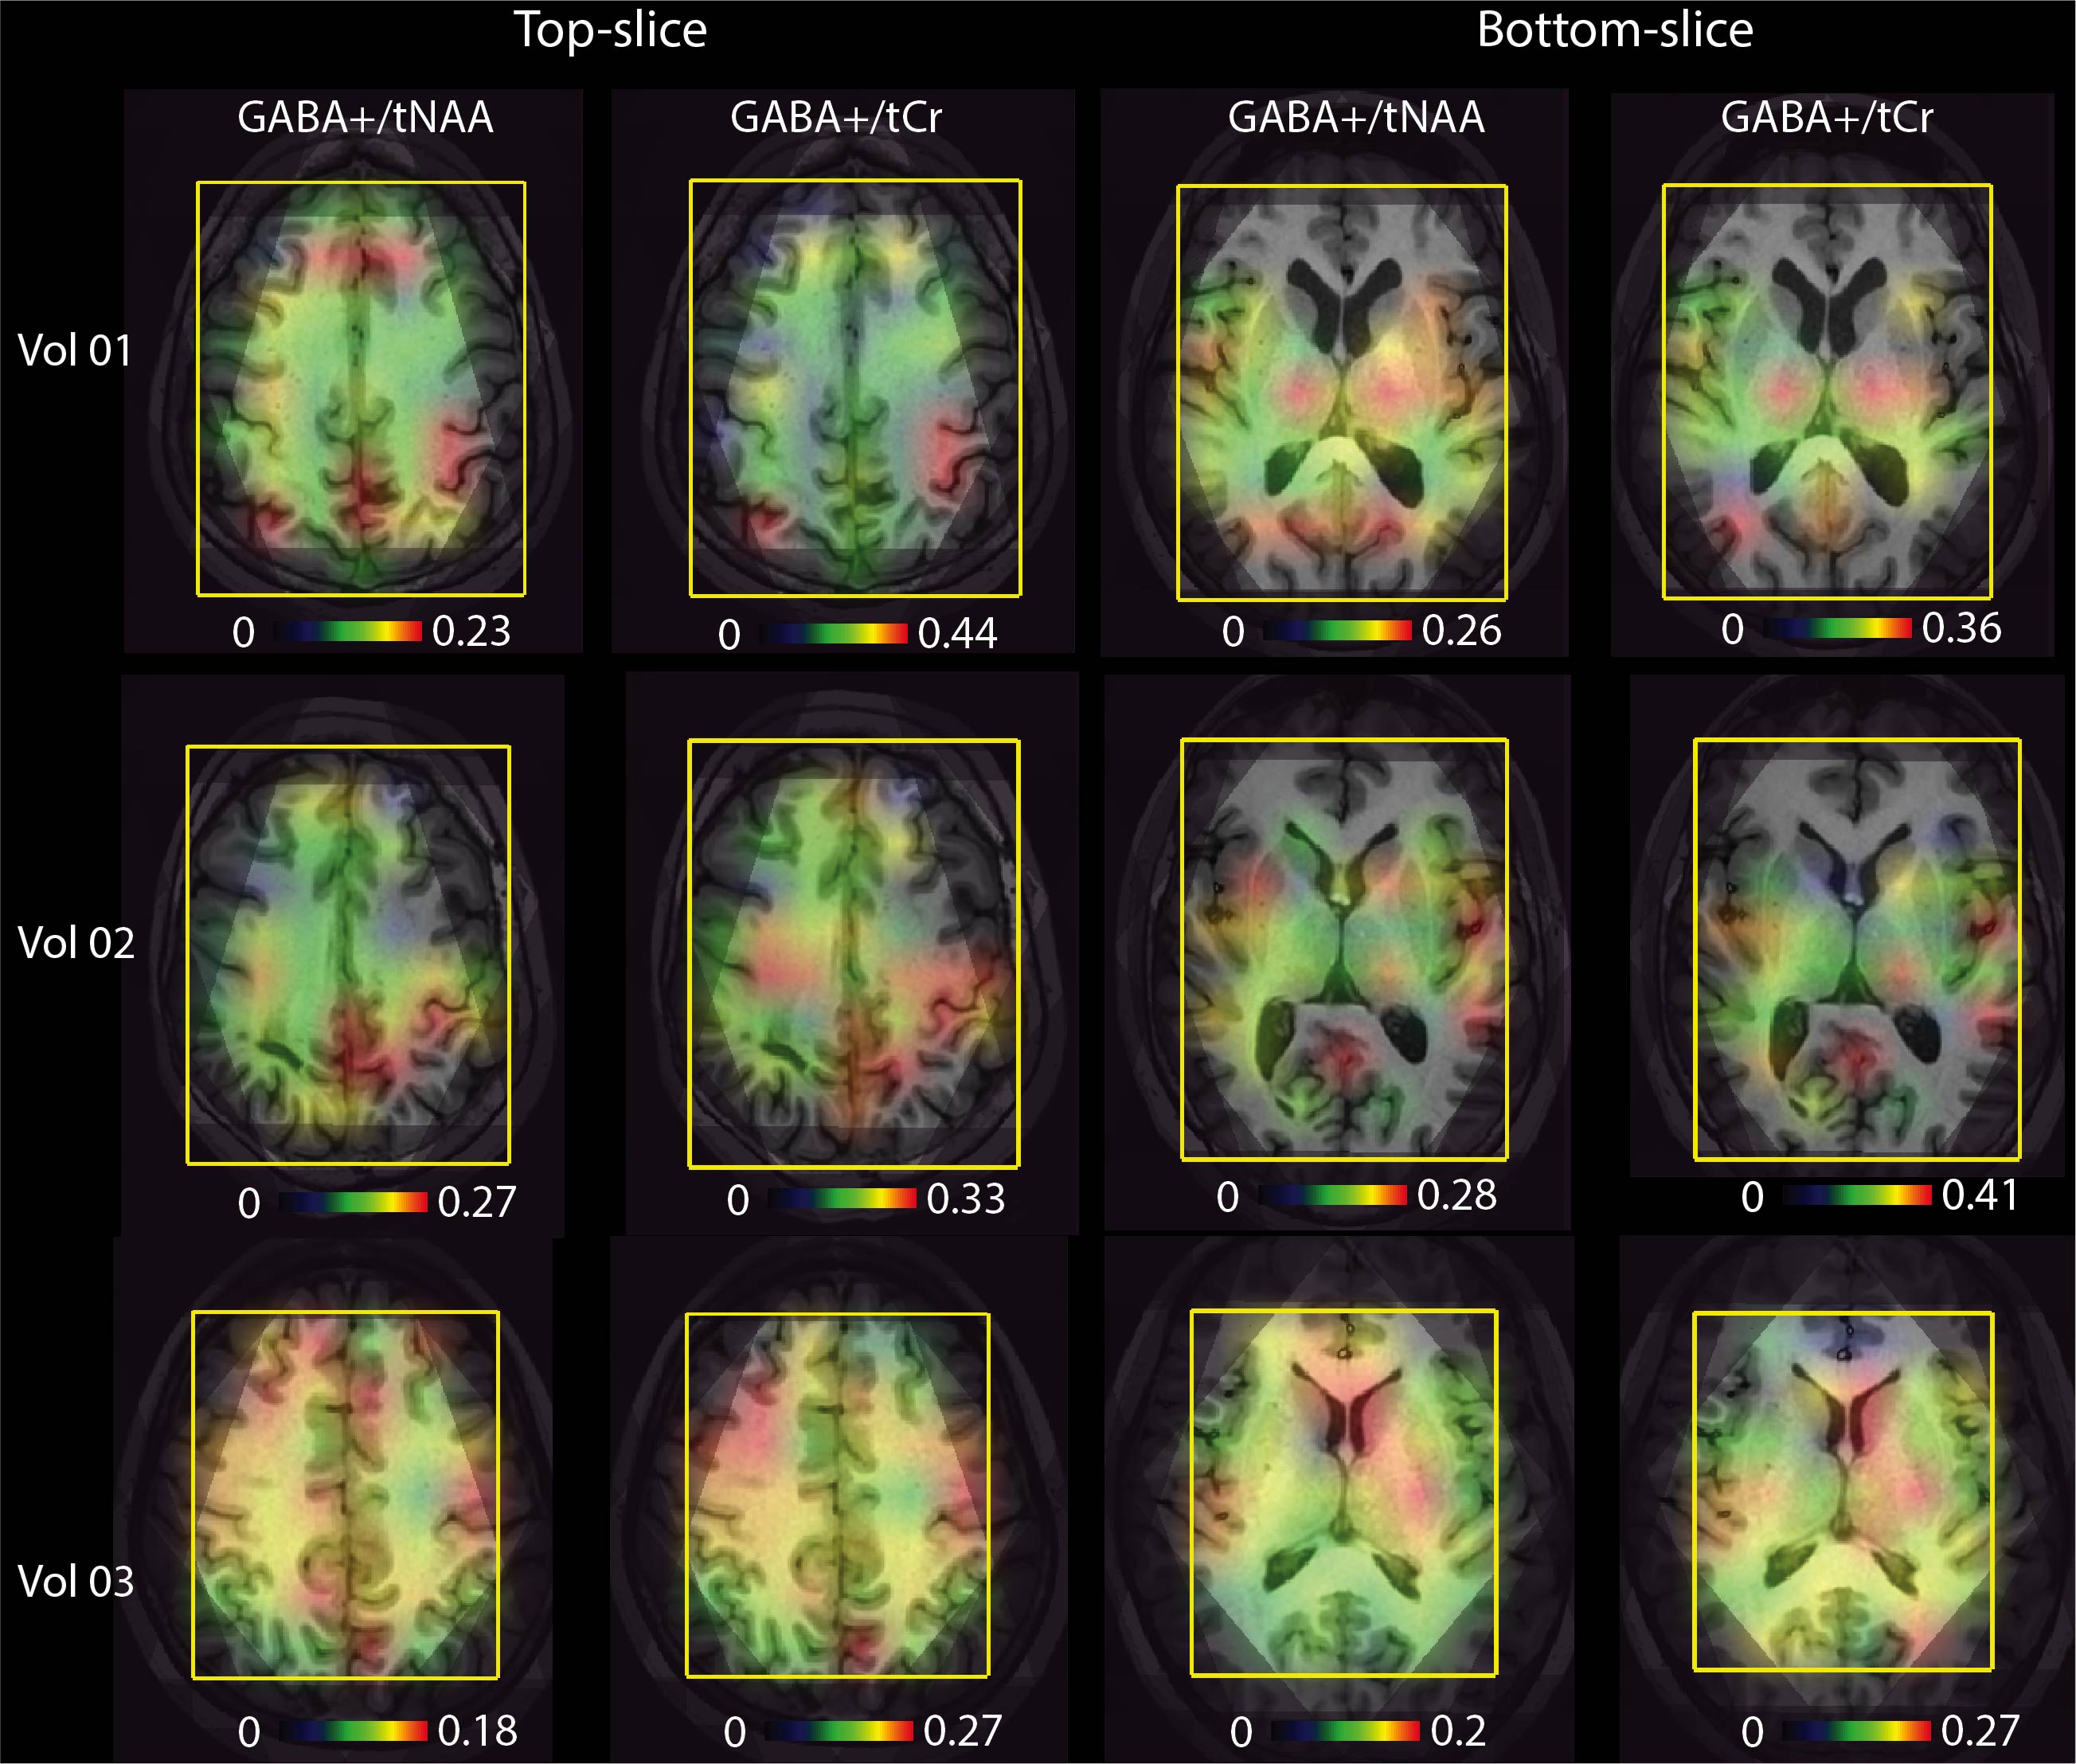
Comparison of 3D EPSI and 2D Hadamard EPSI in top and bottom slices from a volunteer scan is illustrated in Figure 4. Reproducibility tests showed coefficients of variance (CoVs) of peak height ratios in the top slice were 0.096, 0.108, and 0.081 for NAA/Cr, Cho/Cr and NAA/Cho, respectively. The mean intersession CoVs of peak height ratios in bottom slice were 0.122, 0.129, and 0.126 for NAA/Cr, Cho/Cr and NAA/Cho, respectively. Figure 5 shows GABA+/NAA and GABA+/tCr ratio maps in the top slice and bottom slice from three volunteers.
Discussions
In this study, we implemented a fully automated multi-slice 2D MRSI method using atlas prescription and adaptive Hadamard pulses. The presented phantom and volunteer results demonstrated that this method could provide accurate slice excitation, high reproducibility and improved time-efficiency. Hadamard excitation profiles from the phantom showed accurate localization, uniform excitation and negligible signal bleeding. Hadamard 2D spectra and 3D MRSI were well matched in both top and bottom slices, indicating that the proposed method had accurate multi-slice excitation for in-vivo scans. CoVs calculated on a voxel-by-voxel basis were comparable to previous reports4. Tests in GABA phantom and subjects proved that this approach is also suited for multiband editing spectra acquisitions. Similar to previous studies9, higher GABA+/NAA ratios in cortical gray matter regions were observed in multiband GABA-editing datasets. Our work has some limitations. One is that only two slices encoding was implemented, which may be insufficient in some applications. We have not explored motion-correction and dynamic shimming compensation techniques for better reproducibility10. Another one is the number of datasets is small, especially for GABA-editing scans. In future, we plan to address these issues by introducing new RF pulse design method, utilizing motion correction techniques and recruiting more subjects for scan. In conclusion, we proposed a combined multi-slice 2D MRSI method which provided better time-efficiency, SNR efficiency and reproducibility, which may improve 2D MRSI utilization in clinical research.Acknowledgements
NIH R21HD092660References
1. Zhu H, Barker PB. MR spectroscopy and spectroscopic imaging of the brain. Methods Mol Biol. 2011;711:203-226.
2. Goelman G, Walter G, Leigh JS. Hadamard spectroscopic imaging technique as applied to study human calf muscles. Magn Reson Med. 1992;25(2):349-354.
3. Hangel G, Strasser B, Povazan M, et al. Ultra-high resolution brain metabolite mapping at 7 T by short-TR Hadamard-encoded FID-MRSI. Neuroimage. 2018;168:199-210.
4. Bian W, Li Y, Crane JC, Nelson SJ. Fully automated atlas-based method for prescribing 3D PRESS MR spectroscopic imaging: Toward robust and reproducible metabolite measurements in human brain. Magn Reson Med. 2018;79(2):636-642.
5. Jang JH, Kwon JS, Jang DP, et al. A proton MRSI study of brain N-acetylaspartate level after 12 weeks of citalopram treatment in drug-naive patients with obsessive-compulsive disorder. Am J Psychiatry. 2006;163(7):1202-1207.
6. Pauly J, Le Roux P, Nishimura D, Macovski A. Parameter relations for the Shinnar-Le Roux selective excitation pulse design algorithm [NMR imaging]. IEEE Trans Med Imaging. 1991;10(1):53-65.
7. Cunningham CH, Wood ML. Method for improved multiband excitation profiles using the Shinnar-Le Roux transform. Magn Reson Med. 1999;42(3):577-584.
8. Provencher SW. Automatic quantitation of localized in vivo 1H spectra with LCModel. NMR Biomed. 2001;14(4):260-264.
9. Moser P, Hingerl L, Strasser B, et al. Whole-slice mapping of GABA and GABA(+) at 7T via adiabatic MEGA-editing, real-time instability correction, and concentric circle readout. Neuroimage. 2019;184:475-489.
10. Bogner W, Hess AT, Gagoski B, et al. Real-time motion- and B0-correction for LASER-localized spiral-accelerated 3D-MRSI of the brain at 3T. Neuroimage. 2014;88:22-31.
Figures