1983
Ultrahigh-field echo-planar spectroscopic imaging with semi-adiabatic spatial-spectral pulses1Radiology, Icahn School of Medicine at Mount Sinai, New York, NY, United States, 2Medical Physics, University of British Columbia, Kelowna, BC, Canada
Synopsis
An echo-planar spectroscopic imaging sequence has been demonstrated incorporating semi-adiabatic band-limited refocusing (SABRE) pulses. The sequence simultaneously addresses two major obstacles to the implementation of high-resolution spectroscopic imaging at ultrahigh field: presence of B1 field inhomogeneity and aliasing due to bandwidth limitation in the spectral-spatial readout. Both bi-polar and flyback variants of the EPSI readout have been implemented in a user-selectable manner. An accompanying Matlab-based reconstruction has been developed which performs extraction and complete processing from raw data including eddy current compensation, phase reversal of even echoes in the bi-polar readout and removal of spurious points acquired during gradient switching.
Introduction
Benefitting from greater spectral dispersion and SNR and with increasing availability of scanners, ultrahigh field magnetic resonance spectroscopic imaging (MRSI) has emerged as a highly-sensitive, yet non-invasive technique for assessing brain metabolism. Clinical application of MRSI has thus far been limited by slow rates of spatial encoding and therefore low spatial resolution – a limitation further exacerbated by the greater B1 field inhomogeneity prone to ultrahigh field scanners. Fast acquisition schemes like echo-planar (EP) encoding can potentially facilitate higher resolution by simultaneously acquiring spatial and spectral dimensions in a single readout. However, EP encoding has found limited application at ultrahigh field because the increased spectral dispersion – ordinarily a benefit to MRSI – creates a bandwidth limitation forcing a tradeoff between spatial resolution, spectral aliasing or interleaving. It is here that the novel combination of spectrally-selective semi-adiabatic radio frequency (RF) pulses and EP encoding offers a serendipitous balance: the inherently bandwidth-limited EP encoding avoids spectral aliasing artifacts due to the bandwidth-limited shaped RF pulses. Since these pulses avoid the excitation of water, they also preclude the need for RF-intensive water saturation pulses typical in MRSI, and thereby alleviate the specific absorption rate (SAR) related concerns prone to adiabatic pulses. A sequence combining semi-adiabatic band-limited refocusing (SABRE) pulses with echo-planar acquisition at ultrahigh field simultaneously builds on the strengths of the individual components while balancing their weakness, resulting in a highly-optimized solution for non-invasively characterizing brain metabolism with high resolution.Materials & Methods
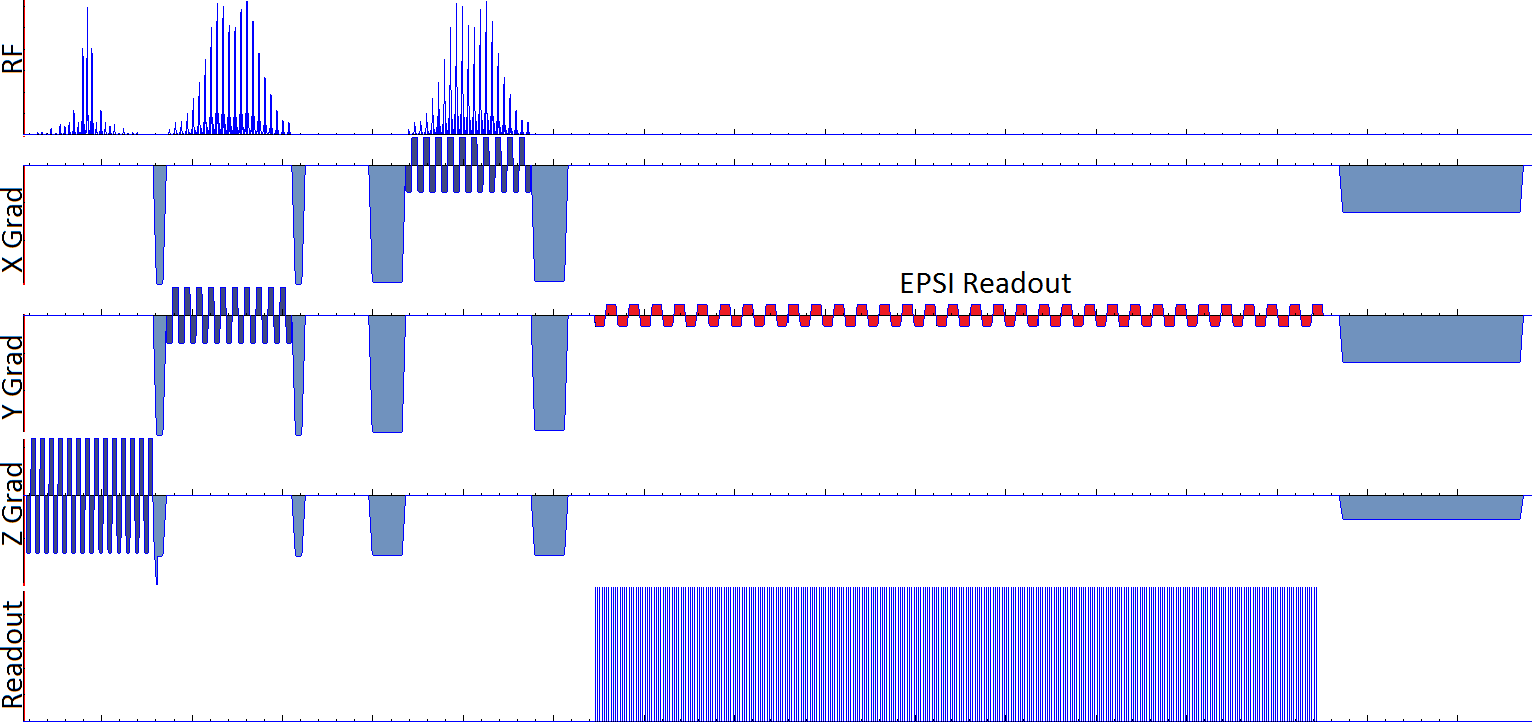
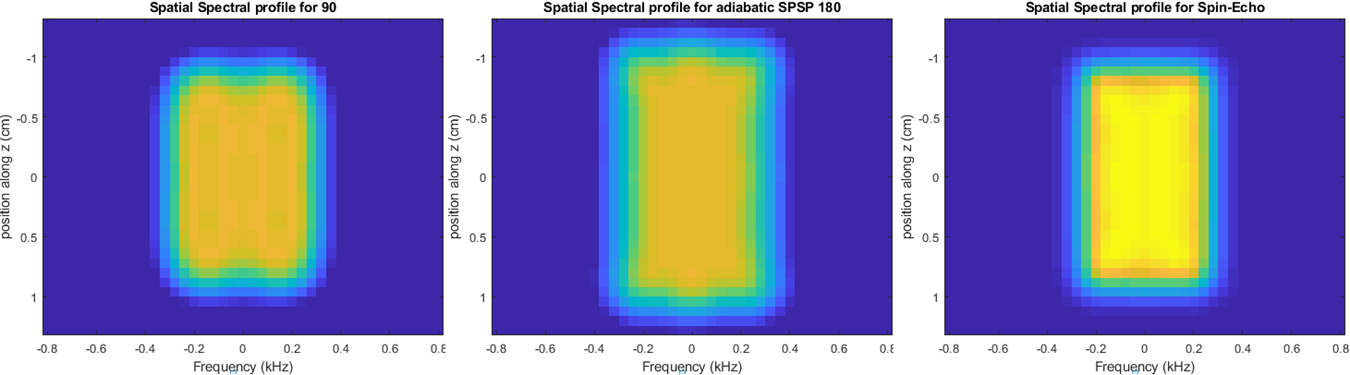
An echo-planar spectroscopic imaging (EPSI) incorporating SABRE pulses has been developed and is shown in Figure 1. The sequence was built around pulses developed with the adiabatic SLR algorithm, and spatial and spectral frequency responses are shown in Figure 2. This algorithm imparts quadratic phase to the adiabatic 180 RF pules which eliminates the need for adiabatic pulse pairs, resulting in shorter pulses (minimum echo time of 30 ms) and lower SAR. The 90-180-180 RF pulses used in the sequence were each 8 ms long with 660 Hz effective spectral bandwidth. Bi-polar and flyback variants of the EPSI readout have been incorporated switchable using the operator interface. The sequence features a long continuous readout with gradient switches timed to match the dwell time of the spectral readout. A corresponding image reconstruction algorithm has been developed in Matlab (Mathworks, Natick, MA) which drops readout points acquired during the gradient switching, time-reverses the even edges of the gradient readout and performs eddy current compensation using an interleaved water acquisition. The program also performs the other usual steps in image reconstruction from raw data, including coil combination, averaging and Fourier transformation. The EPSI sequence was implemented on the 7T Siemens MAGNETOM scanner (Siemens Healthineers, Erlangen, Germany) with a 32Rx/1Tx-channel Nova head coil. A 2-liter “Braino” phantom containing brain metabolites at physiological concentration was used for scanning in this feasibility demonstration of the sequence. Scan parameters included 30 ms minimum echo time (TE), 1500 ms repetition time (TR), 4x4x4 acquistion matrix with 80x80x80 mm3 field-of-view (FOV) resulting in a voxel size of 20x20x20 mm3 or 8.0 ml. Four averages were acquired and the total scan time was 1 minute, 36 seconds. The SABRE pulses have an excitation bandwidth of approximately 660 Hz (2.2 ppm at 7T), whereas the spectral readout has a bandwidth of 3040 Hz, across the four points. The 760 Hz bandwidth per voxel accommodates partially-excited signal from the side bands of the RF pulses to avoid aliasing. A water interleave is played during the relaxation phase of the main band with identical acquisition parameters but a shifted excitation and encoding frequency covering the range between 4.3 and 6.5 ppm.Results
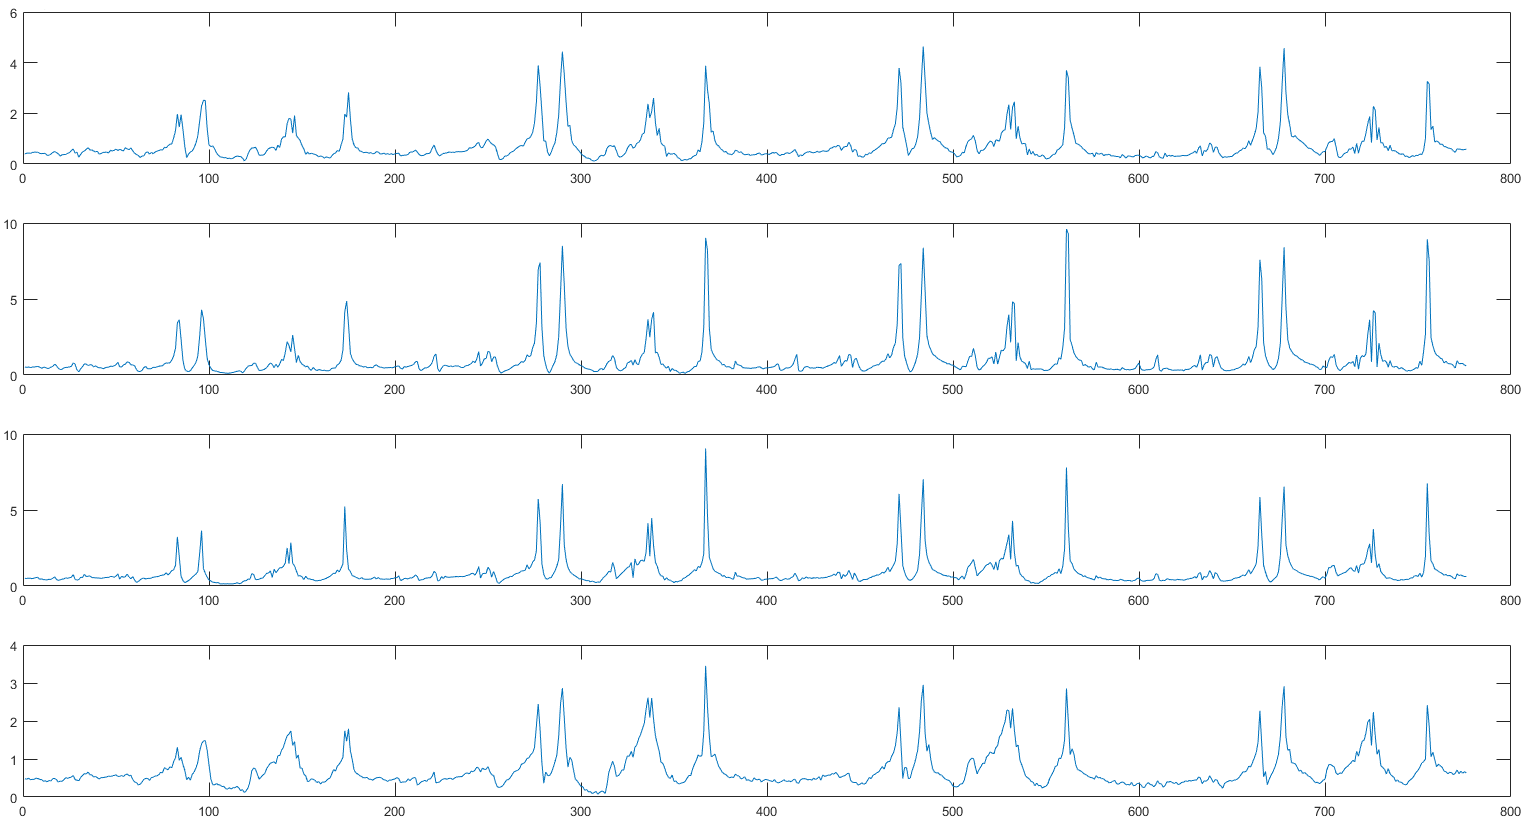
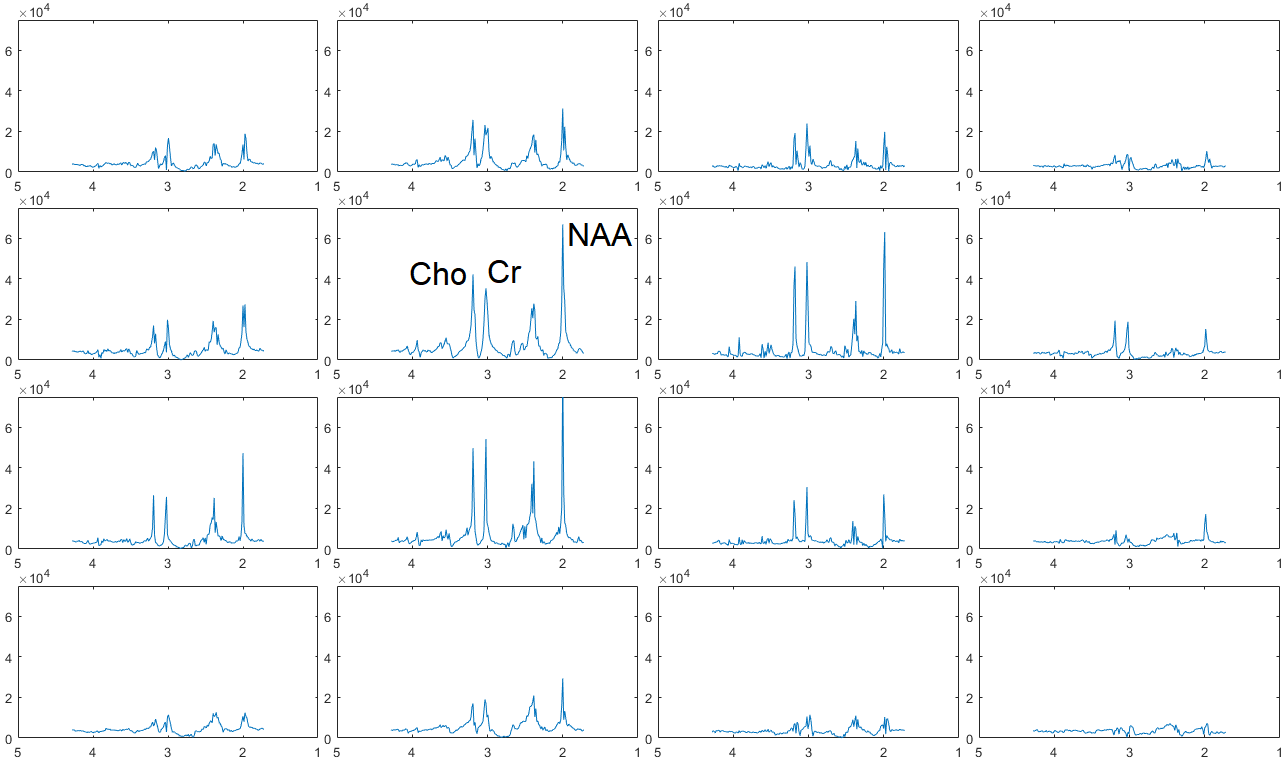
Results in the brain phantom demonstrate the feasibility of the bi-polar EPSI sequence. The combined spectral-spatial readout shows the presence of multiple acquired spectra within a single EPSI readout, representing spectra from each encoded voxel in a row of k-space (Figure 3). Following removal of spurious points during gradient switching and phase reversal and combination of even-numbered gradients, a typical proton brain metabolite spectrum demonstrating presence of n-acetylaspartate (NAA), Creatine (Cr) and Choline (Cho) can be seen (Figure 4). No water suppression was applied for this study, yet the spectra show minimal presence of water baseline or other aliasing artifact. The spectra notably show no sign of aliasing rf excited signal from outside of the 760 Hz (2.6 ppm at 7T) acquired bandwidth demonstrating the spectral selectivity of the SABRE pulses. This study demonstrates the feasibility of the EPSI sequence in physiological brain phantom at 7T. Future directions for the study include implementation in human volunteer following approval by the local institutional review board (IRB) phantom and human reproducibility testing. Potential improvements in the sequence include the implementation of non-Cartesian echo-planar readouts and higher slew rates to improve spatial resolution without introducing eddy current artifacts. In application where a water interleave is unneeded, a spatial interleave could also be implemented to facilitate faster spatial acquisition.Conclusion
The EPSI sequence can potentially greatly accelerate acquisition of MRSI at 7T while avoiding the B1 inhomogeneity and spectral aliasing pitfalls of such a sequence at ultrahigh field.Acknowledgements
The authors would like to acknowledge funding from NIH R01 MH109544.References
1. Balchandani, Priti, John Pauly, and Daniel Spielman. "Designing adiabatic radio frequency pulses using the Shinnar–Le Roux algorithm." Magnetic resonance in medicine 64.3 (2010): 843-851.
2. Feldman, Rebecca E., and Priti Balchandani. "A semiadiabatic spectral‐spatial spectroscopic imaging (SASSI) sequence for improved high‐field MR spectroscopic imaging." Magnetic resonance in medicine 76.4 (2016): 1071-1082.
3. Ebel, Andreas, and Andrew A. Maudsley. "Improved spectral quality for 3D MR spectroscopic imaging using a high spatial resolution acquisition strategy." Magnetic resonance imaging 21.2 (2003): 113-120.
4. Posse, Stefan, Charles DeCarli, and Denis Le Bihan. "Three-dimensional echo-planar MR spectroscopic imaging at short echo times in the human brain." Radiology 192.3 (1994): 733-738.
Figures