1974
Improved CNN-based Image reconstruction using regularly under-sampled signal obtained in phase scrambling Fourier transform imaging
satoshi ITO1 and Shun UEMATSU1
1Utsunomiya University, Utsunomiya, Japan
1Utsunomiya University, Utsunomiya, Japan
Synopsis
It has been reported that a quadratic phase scrambling of the spin system in advance to Fourier encoding (PSFT) is effective to the improvement of image quality. In this paper, an CNN-based image reconstruction using PSFT signal was examined. Simulation studies showed that proposed method allows equi-spaced under-sampling and that preservation of structure and image contrast were improved compared to standard Fourier transform based CS-CNN or iterative image reconstruction method. These studies indicate that PSFT has the possibility to reconstruct higher quality images in deep learning image reconstruction as well as iterative reconstruction.
Introduction
In the application of compressed sensing to MR image acquisition, it has been reported that a quadratic phase scrambling of the spin system in advance to Fourier encoding is effective to the improvement of image quality [1,2]. Maudslay proposed the phase scrambling Fourier transform imaging (PSFT) to reduce the signal dynamic range [3]. Yamada and Ito showed the feasibility of image reconstruction using equi-spaced under-sampled PSFT signal [4-6]. In this research, a new convolutional neural network (CNN) based image reconstruction method using PSFT signal as an input signal. Firstly, image quality was compared with Fourier transform imaging and secondly, random and non-random equi-spaced under-sampling was compared in proposed PSFT-CNN reconstruction.Method
The signal obtained in the phase-scrambling Fourier transform imaging (PSFT)[1] is given as Eq.(1) in which a quadratic field gradient for the phase scrambling is added to the pulse sequence of conventional FT imaging. $$v(k_x,k_y)= \int \hspace{-2.0mm} \int^{\infty}_{-\infty} \left\{ \rho(x,y) e^{-j \gamma b \tau (x^2+y^2)} \right\} e^{-j(k_x x+k_y y)}dxdy ...(1), $$where $$$\rho(x,y)$$$represents the spin density distribution in the subject, $$$\gamma$$$ is the gyromagnetic ratio, and b and $$$\tau$$$ are the coefficient and impressing time, respectively, of the quadratic field gradient. Image reconstruction is executed by inverse Fourier transform followed by quadratic phase demodulating as shown in Eq.(1). The coefficient of phase scrambling $$$\gamma b \tau$$$ is normalized as $$$\gamma b \tau =h \overline{\gamma b \tau} $$$, where phase changes with neighboring pixel become $$$\pi$$$ at $$$\overline{\gamma b \tau} =\pi/(N \Delta x^2)$$$ (N: size of image, $$$\Delta x$$$: pixel size). To reconstruct images, modified ADMM generic CS-net was used in which quadratic phase demodulation and modulation operations were incorporated to the ADMM CS-net framework (PSFT-CS-Net). The number of stages was 10, the number of iterations was 1, the number of filter and its size were 128 and 5x5, respectively. and epoch number was 300. Adam was used in order to minimize the value of the loss function.
Results & Discussions
In the simulation experiments, PSFT signal was synthesized according to the Eq. (1). We used IXI data set [7] for real value image dataset, and healthy volunteer images obtained with 3T MRI (Canon Medical, Vantage Titan) for the dataset of phase varied images. Informed consent was obtained from all volunteers. The imaging conditions were as follows: three-dimensional fast spin echo, TR/TE = 3,500/352 ms, flip angle = 90 degrees, slice thickness = 1.2 mm, slice spacing = 1.2 mm, and spatial resolution = 1.1 mm. Comparison of obtained PSNRs and SSIMs using the same sampling pattern shown in Fig.1(a) (reduction factor 33%) were made among proposed PSFT-CS-Net, ADMM-CS-Net using standard Fourier transform imaging (FT-CS-Net) and iterative ADMM reconstruction using PSFT signal. Figure 3 shows the results. Higher PSNRs and SSIMs were obtained in PSFT based two methods compared to FT-CS-Net. PSFT-CS-Net shows superior PSNRs and SSIMs compared to PSFT iterative method. Next, comparison between uniform density random under-sampling (RaUS) and uniform density equi-space regular under-sampling (EsUS) (reduction factor 33%) were made. Sampling patterns are shown in Fig.1 (b) and (c). PSNR and SSIM value with reference to the parameter $$$h$$$ are shown in Fig.3 (a), (b). EsUS shows higher PSNR and SSIM when $$$h$$$ become greater than 0.3. This is attribute to the fact that the effect of error diffusion becomes stronger as the parameter h increases. Figure 4 shows the results of reconstruction experiments for spatially phase varied images using synthesized PSFT signal . Figure (a) and (b) shows the phase map and magnitude images of fully scanned image, figs (c) and (d) are the images with EsUS and RaUS, respectively. As shown in the region pointed by red arrows, structure and contrast preservation are improved with EsUS images. Figure 5 shows the results of reconstruction using experimentally obtained PSFT signal using 0.2 T hand-made MRI (h=1.0, resolution; 0.08 cm). The same sampling patterns shown in Fig.1 (b), (c) were used in the experiments. Figure 5(a) shows the PSFT signal and (b), (d), (e) show the reconstructed images with PSNR value. Since quadratic phase modulation acts as an error diffuser in the reconstruction step, random under-sampling is not necessary in PSFT-CS-Net. In this time, the important point is that the sampling interval is not too large, since it will increase the reconstruction error. Therefore, EsUS shows higher PSNRs and SSIMs compared to RaUS.Conclusion
The signal obtained in PSFT was applied to signal to image domain transfer learning in compressed sensing reconstruction. Proposed method showed higher PSNR and SSIM than Fourier transform based method. It was also shown that equi-space under-sampling was feasible in proposed method.Acknowledgements
The present study was supported in part by JSPS KAKENHI 19K04423 and KAYAMORI Foundation of Informational Science Advancement. The authors would like to thank Canon Medical Systems Corp. for the use of clinical magnetic resonance images and brain-development org. for the use of the IXI Dataset.References
- Wiaux Y et al., Spread Spectrum for Com-pressed Sensing Techniques in Magnetic Resonance Imaging, IEEE ISBI, 756–759, Rotterdam, The Netherlands, 2010
- Puy G et al., Spread Spectrum for Accelerated Acquisition in Magnetic Resonance Imaging, IEEE Trans Med Img, vol.31, 586-598, 2012
- Maudsley A A, Dynamic range improvement in NMR imaging using phase scrambling, Journal of Magnetic Resonance Imag-ing, vol.76, 287-305, 1988
- S. Ito et al., Alias-free image reconstruction using Fresnel transform in the phase-scrambling Fourier imaging technique, Magnetic Resonance in Medicine, vol.60, No.2, 422-430, 2008
- Yamada et al., Data Interpolation in Phase-scrambling Fourier Transform Technique for Alias-free Image Reconstruction by Iterative Signal Restoration Algorithm, ISMRM 17th Scientific Meeting, Honolulu, USA, p.2863, 2009
- S. Ito et al., MR Image Reconstruction of a Regularly Undersampled Signal using Quadratic Phase Scrambling, IEEE International Conference on Image Processing (ICIP2015), TEC-P26.2, Quebec City, Canada, 201
- Imperial College London, https://brain-development.org/ixi-dataset/
Figures
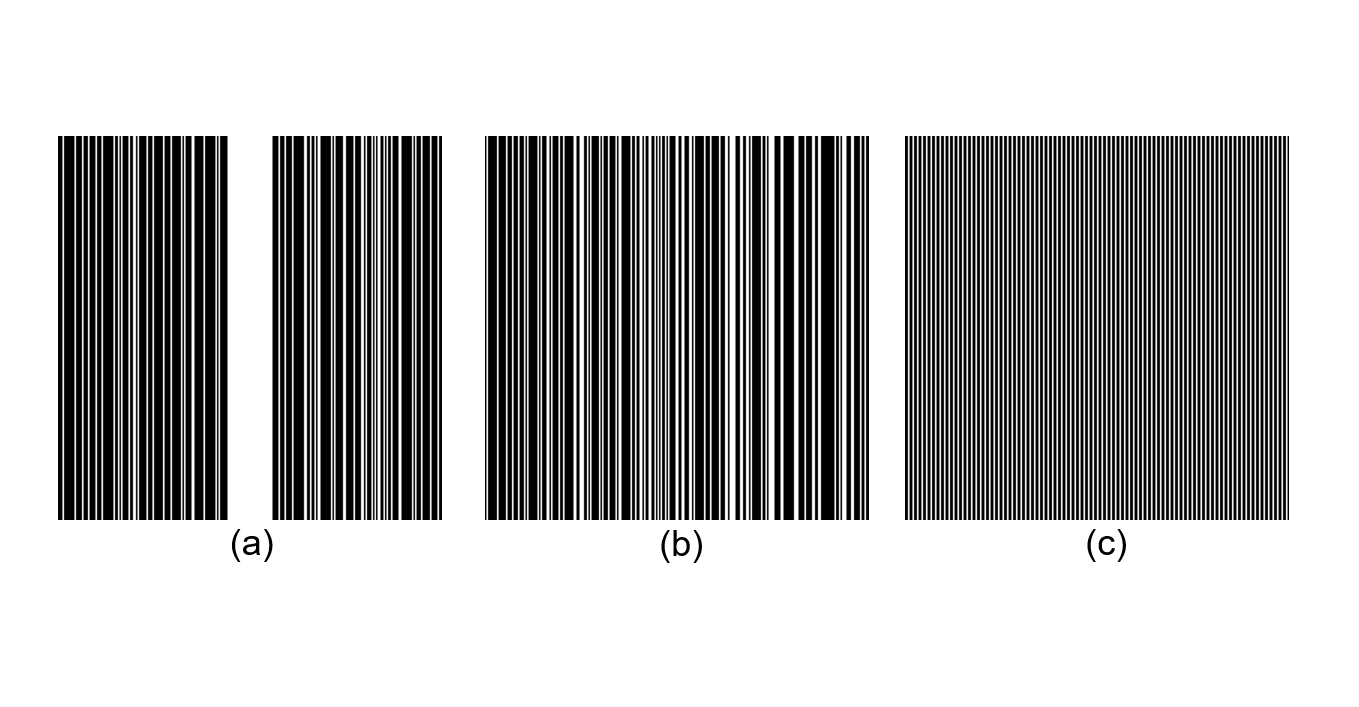
Figure 1. Signal under-sampling pattern of 33% reduction factor used in the
experiments.
Figure (a) shows the pattern that has
continuous sampling region around k-space center, (b) and (c) are uniform
density random under-sampling (RaUS) and equi-spaced under-sampling (EsUS),
respectively.
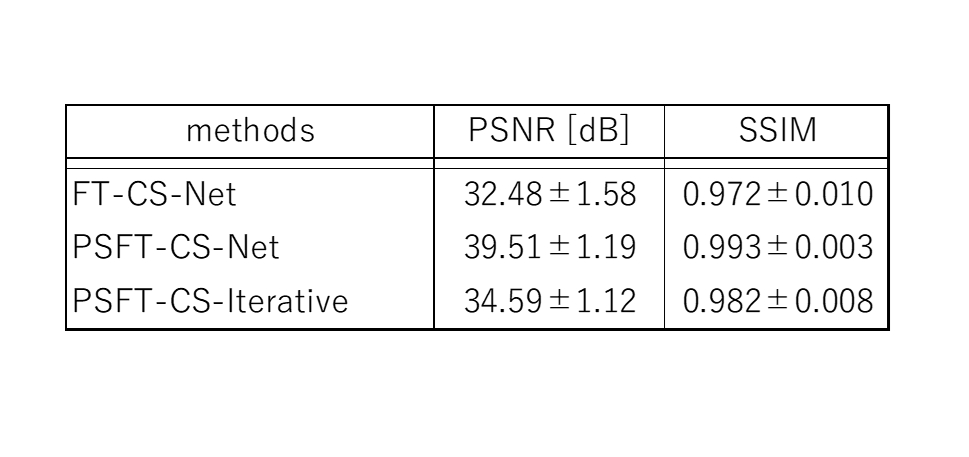
Figure 2. Comparison of PSNR and SSIM between PSFT-CS-Net and FT-CS-Net for
real-value images.
PSNR results using sampling pattern of Fig.1 (a) are shown. Comparison among
CNN reconstruction using PSFT or FT imaging and conventional iterative
reconstruction were made.
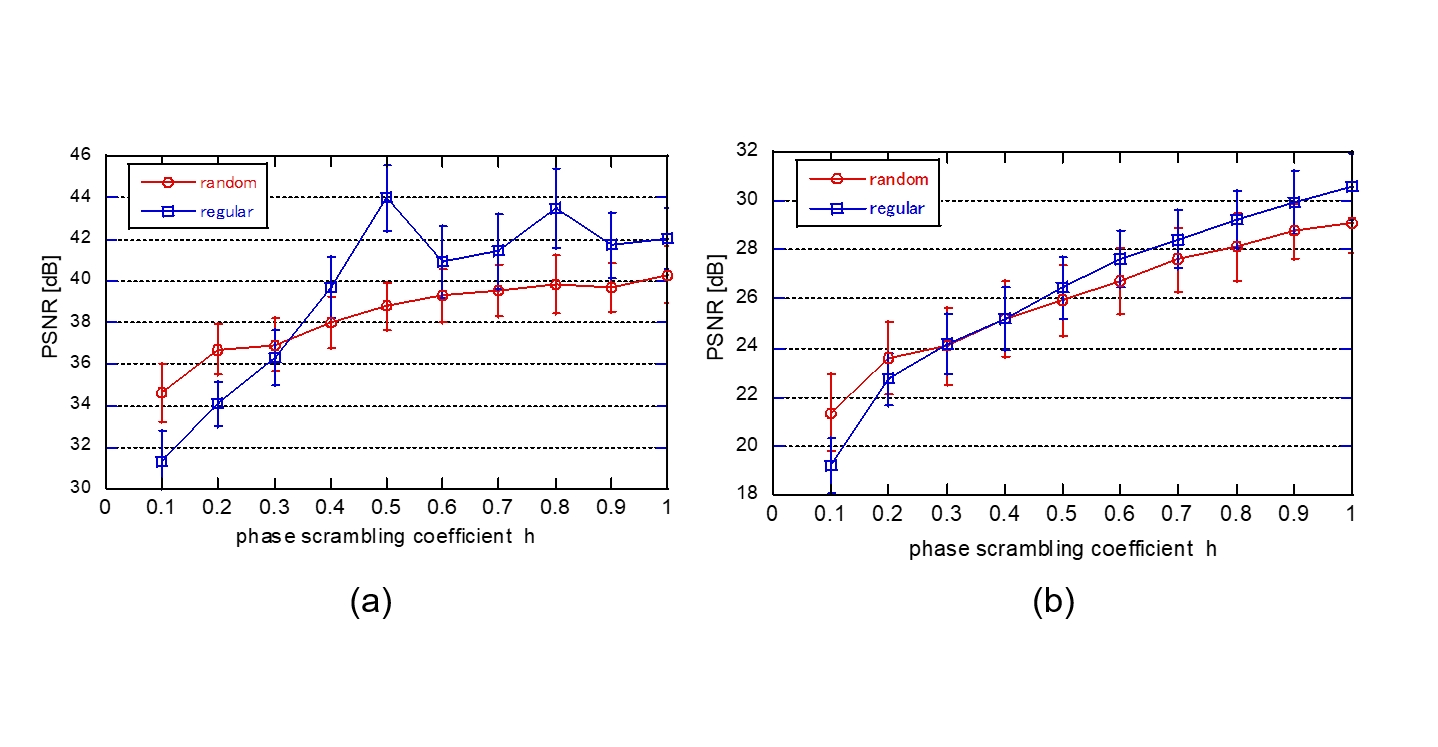
Figure 3. Relationship between
PSNR and parameter h for uniform RaUS and uniform EsUS. Spatially phase varied
images are used for training and testing.
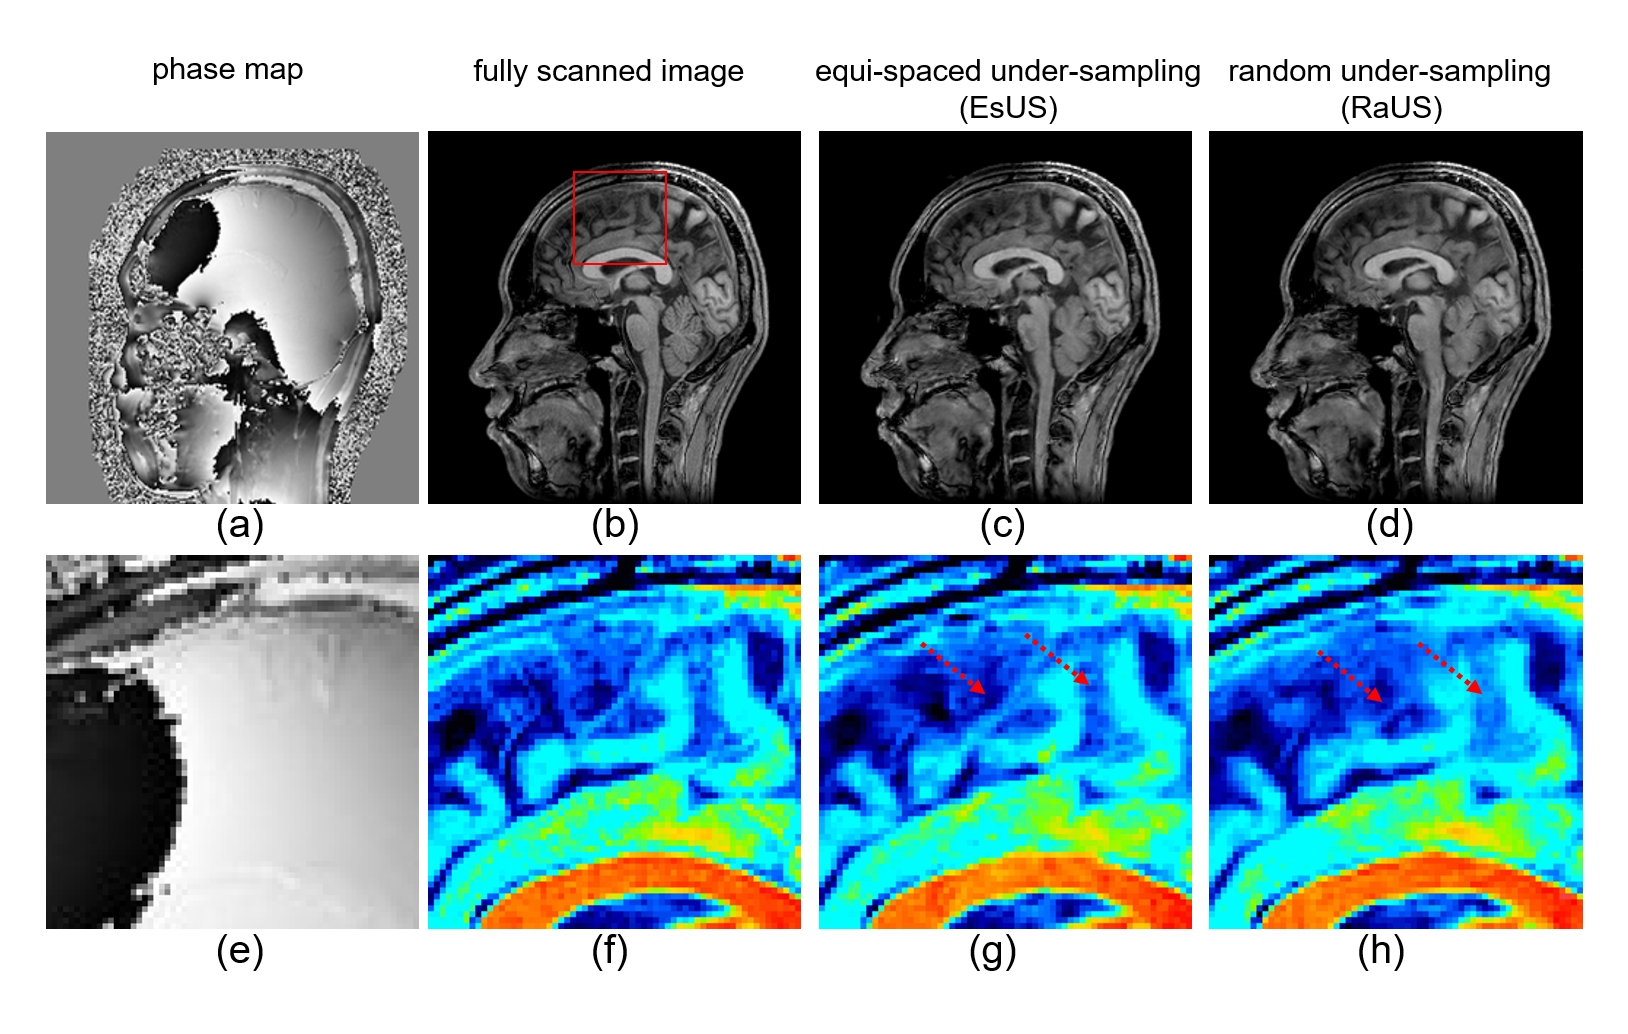
Figure 4. Results of reconstructing spatially phase varied images. Figure (a)
and (b) show the phase map and magnitude of fully scanned image. Figure (c) and
(d) are reconstructed images with EsUS and RaUS, respectively. Enlarged images
corresponding to (a) through (d) are shown in (e) through (h).
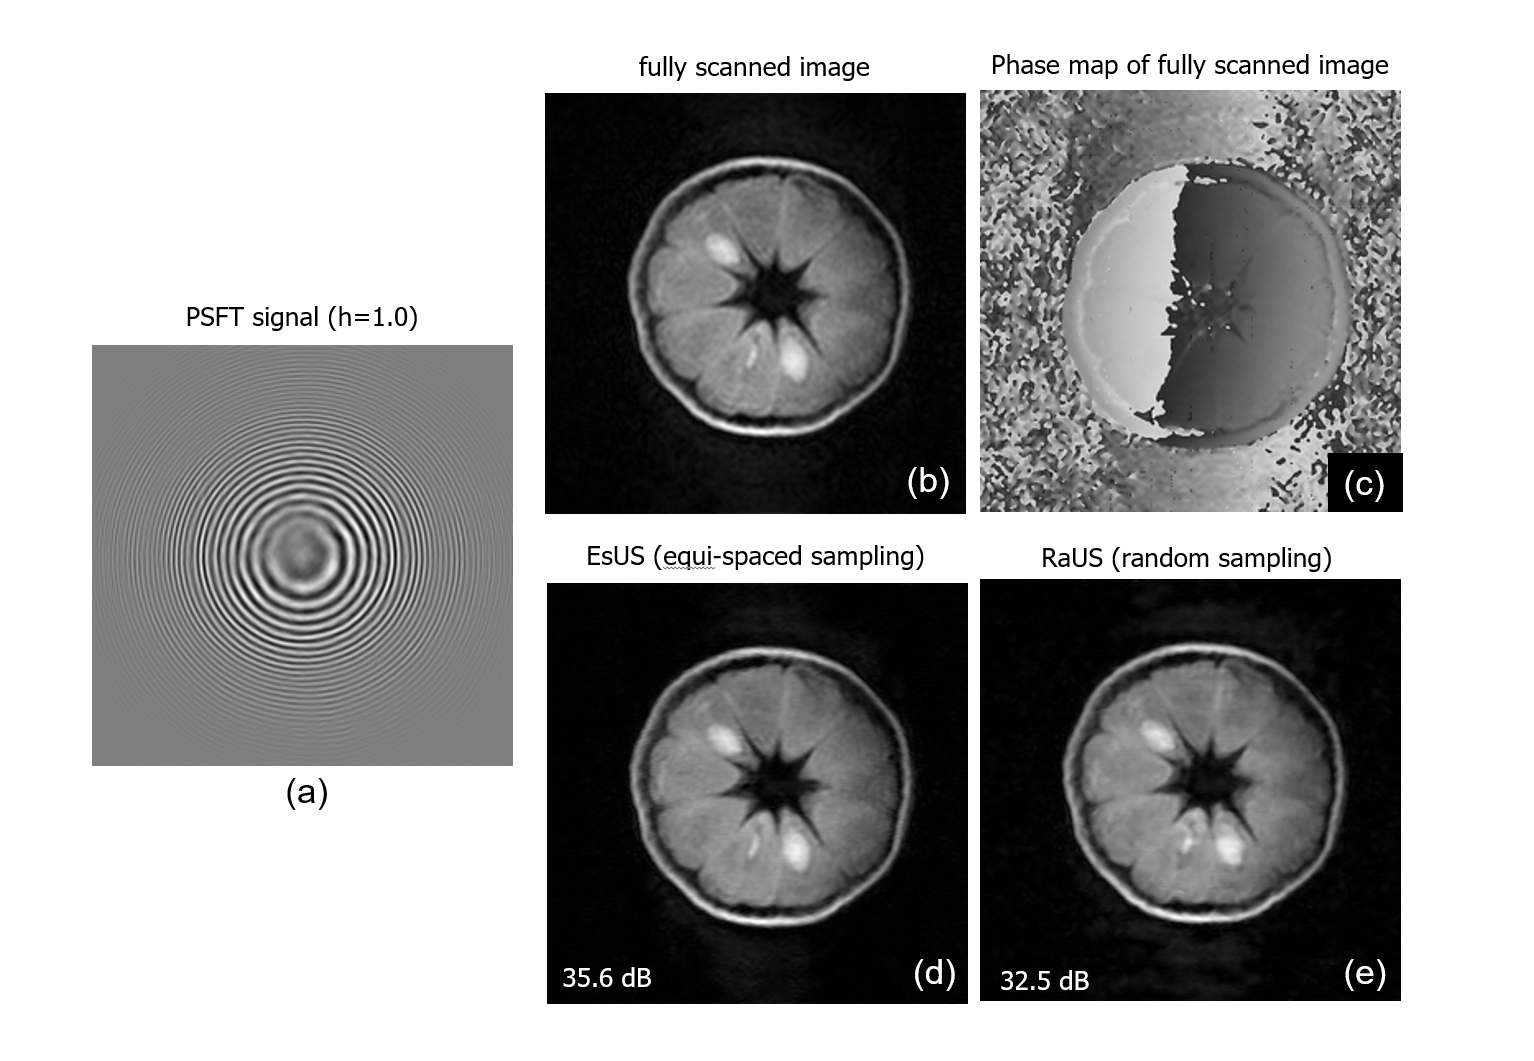
Figure 1. Application of experimentally obtained PSFT signal to PSFT-CS-Net.
Figure (a) show the k-space PSFT signal (real-part, h=1.0, resolution; 0.08 cm) and (b), (c) show the magnitude and phase map of fully scanned
orange image. Figure (d), (e) are obtained images with EsUS and RaUS. PSNR
values are shown in the Figures.