1972
Deep Laplacian Pyramid Networks for Fast MRI Reconstruction with Multiscale T1 Priors
Xiaoxin Li1,2, Xinjie Lou1, Junwei Yang3, Yong Chen4, and Dinggang Shen2,5
1College of Computer Science and Technology, Zhejiang University of Technology, Hangzhou, China, 2School of Biomedical Engineering, ShanghaiTech University, Shanghai, China, 3Department of Computer Science and Technology, University of Cambridge, Cambridge, United Kingdom, 4Case Western Reserve University, Cleveland, OH, United States, 5Shanghai United Imaging Intelligence Co., Ltd., Shanghai, China
1College of Computer Science and Technology, Zhejiang University of Technology, Hangzhou, China, 2School of Biomedical Engineering, ShanghaiTech University, Shanghai, China, 3Department of Computer Science and Technology, University of Cambridge, Cambridge, United Kingdom, 4Case Western Reserve University, Cleveland, OH, United States, 5Shanghai United Imaging Intelligence Co., Ltd., Shanghai, China
Synopsis
Recent studies explored the merits of using T1-weighted image (T1WI) as a guidance to reconstruct other undersampled MRI modalities via convolutional neural networks (CNNs). However, even aided by T1WI, the reconstruction of highly undersampled MRI data is still suffering from aliasing artifacts, due to the one-upsampling style of existing CNN architectures and not fully using the T1 information. To address these issues, we propose a deep Laplacian pyramid MRI reconstruction framework (LapMRI), which performs progressive upsampling while integrating multiscale prior of T1WI. We show that LapMRI consistently outperforms state-of-the-art methods and can preserve anatomical structure faithfully up to 12-fold undersampling.
Introduction
To accelerate multimodal Magnetic Resonance Imaging (MRI) acquisitions, recent studies1,2 have explored the merits of using T1-weighted image (T1WI) as a guidance to reconstruct the other undersampled MRI modalities via convolutional neural networks (CNNs). However, even with the aided T1WI, the reconstruction of highly undersampled MRI data is still suffering from aliasing artifacts. This is mainly due to the one-upsampling style of the existing CNN architecture and not fully exploiting the priors implied in T1WI. To address these issues, we propose a deep Laplacian pyramid MRI reconstruction framework (LapMRI), which gradually restores the missing k-space data of the query modalities from the central part to the periphery part while integrating the multiscale prior of T1WI.Methods
Let $$$\textrm{y}/\textrm{y}^{\prime}\in\mathbb{C}^{N\times M}$$$ and $$$\textrm{x}/\textrm{x}^{\prime}\in\mathbb{C}^{N\times M}$$$ represent the fully-sampled k-space and image-domain data of a typical query/T1 modality, respectively. The k-space measurements of the query modality are acquired using aggressive Cartesian undersampling:$$\textrm{y}_{u}=\textrm{M}_{u}\textrm{y}=\textrm{M}_{u}\boldsymbol{F}(\textrm{x}),$$where $$$\boldsymbol{F}$$$ denotes 2D Fourier Transform, and $$$\textrm{M}_{u}$$$ is a center mask consecutively selecting $$$u=Nr$$$ ($$$r$$$ denotes the undersampling rate) lines from the central region of the underlying k-space along the phase-encoding direction. Here center mask is chosen according to the work of Xiang et al.2As shown in Fig. 1, our LapMRI consists of $$$\Lambda$$$ submodules: $$$\mathcal{L}_{1},\mathcal{L}_{2},\cdots,\mathcal{L}_{\Lambda}$$$, which progressively reconstruct the k-space data of the query modality: $$$\textrm{y}_{u_{1}},\textrm{y}_{u_{2}},\cdots,\textrm{y}_{u_{\Lambda}}$$$ ($$$\textrm{y}_{u_{\Lambda}}=\textrm{y}$$$) with the aid of multiscale T1 images $$$\textrm{x}_{u_{1}}^{\prime},\textrm{x}_{u_{2}}^{\prime},\cdots,\textrm{x}_{u_{\Lambda}}^{\prime} (\textrm{x}_{u_{\Lambda}}^{\prime}=\textrm{x}^{\prime})$$$. Here $$$u<u_{\lambda-1}<u_{\lambda}$$$, $$$\textrm{y}_{u_{\lambda}}=\textrm{M}_{u_{\lambda}}\textrm{y}$$$, and $$$\textrm{x}_{u_{\lambda}}^{\prime}=\boldsymbol{F}^{-1}\left(\textrm{y}_{u_{\lambda}}^{\prime}\right)$$$. The whole architecture of LapMRI adopts an interruption-and-restart structure. That is, the layer-by-layer feature extraction procedure is interrupted by the reconstruction operation at the end of each submodule and then restarts at the beginning of the next submodule. Such a structure is designed for integrating multiscale T1 information at multiple pyramid levels. To enhance information propagation, a data consistence (DC) layer3 is placed at the end of each submodule, so as to ensure the data in the central $$$u$$$ lines of the output of each submodule to have the same entries with $$$\textrm{y}_{u}$$$ and thus to wire all submodules together. In addition, to ensure progressively upsampling, partially zero-filling operator $$$U_{\lambda}\left(\cdot\right)$$$ is introduced and defined as follows$$U_{\lambda}\left(\textrm{y}_{u_{\lambda-1}}\right)\triangleq\boldsymbol{F}^{-1}\left(\textrm{M}_{u_{\lambda}}\textrm{M}_{u_{\lambda-1}}^{H}\textrm{y}_{u_{\lambda-1}}\right),$$where $$$\textrm{y}_{u_{\lambda}}$$$ is the output of $$$\mathcal{L}_{\lambda}$$$ ($$$1\le\lambda\le\Lambda$$$) and $$$\textrm{y}_{u_0}=\textrm{y}_{u}$$$. As $$$u_{\lambda-1}<u_{\lambda}$$$, $$$U_{\lambda}\left(\textrm{y}_{u_{\lambda-1}}\right)$$$ only fills $$$u_{\lambda}-u_{\lambda-1}$$$ zero-valued lines to the periphery region of $$$\textrm{y}_{u_{\lambda-1}}$$$.
Specifically, a submodule $$$\mathcal{L}_{\lambda}$$$ reconstructs $$$\textrm{y}_{u_{\lambda}}$$$ as follows$$\textrm{y}_{u_{\lambda}}=\mathsf{DC}\left(\textrm{y}_{u},\bar{\textrm{x}}_{u_{\lambda}}+R_{\lambda}\left(\bar{\textrm{x}}_{u_{\lambda}},\textrm{x}_{u_{\lambda}}^{\prime};\Theta_{\lambda}\right)\right),$$where $$$\bar{\textrm{x}}_{u_{\lambda}}=U_{\lambda}\left(\textrm{y}_{u_{\lambda-1}}\right)$$$, and $$$R_{\lambda}$$$ is a subnet parameterized by $$$\Theta_{\lambda}$$$ learning the residual between $$$\bar{\textrm{x}}_{u_{\lambda}}$$$ and $$$\textrm{x}_{u_{\lambda}}$$$ with the aid of $$$\textrm{x}_{u_{\lambda}}^{\prime}$$$. It is beyond the scope of this work to customize $$$R_{\lambda}$$$ for an optimal LapMRI. One can simply replace $$$R_{\lambda}$$$ by the state-of-the-art network for MRI reconstruction. For convenience, we denote by LapMRI(X-Net, $$$\Lambda$$$=$$$K$$$) a specific LapMRI-based network substituting $$$R_{\lambda}$$$ by X-Net and having $$$K$$$ pyramid levels.
Fig. 2 visually demonstrates the pyramid structure consisting of the inputs $$$\left(\bar{\textrm{x}}_{u_{\lambda}},\textrm{x}_{u_{\lambda}}^{\prime}\right)$$$ and the output $$$\tilde{\textrm{x}}_{u_{\lambda}}=\boldsymbol{F}^{-1}\left(\textrm{y}_{u_{\lambda}}\right)$$$ at each pyramid level. With pyramid level increasing, more and more artifacts are removed and details are recovered.
Results
We utilize the MSSEG dataset6 to demonstrate the capability of our LapMRI framework. We use fully-sampled T1 images to aid the reconstruction of undersampled T2 images. Training and test settings are the same with Xiang et al.1 Fig. 3 shows how the number of pyramid levels $$$\Lambda$$$ influences the reconstruction performance of LapMRI under different residual learning networks. Except for some special cases where UNet and DenseUNet are imposed, the performance curves climb up with the increase of $$$\Lambda$$$. Table 1 compares our results with the naive zero filling method and 5 CNN-based algorithms including UNet4, DenseUNet2, RefineGAN5, D5C5 and D5C153. LapMRI(D5C5,$$$\Lambda$$$=3) and D5C15 achieve the best and second best performance, respectively. Particularly, LapMRI(D5C5,$$$\Lambda$$$=3) gains more significant performance for higher undersampled ratios. Furthermore, it is worth noting that D5C15 is actually a variant of LapMRI(D5C5,$$$\Lambda$$$=3) by setting $$$\textrm{M}_{u_{\lambda}}=\textrm{M}_{u}$$$ for all $$$1\le\lambda\le\Lambda$$$. This indicates the significance of the pyramid structure and the multiscale priors of T1 images. Fig. 4 further demonstrates the superiority of LapMRI by visualizing the resultant images reconstructed by different methods for comparison. .Discussion and Conclusion
By leveraging both Laplacian pyramid architecture and multiscale T1 priors, the proposed LapMRI outperforms the state-of-the-art methods and gains more significant performance for higher undersampled ratios (Table 1). With the proposed LapMRI, the acquisition of the T2-weighted images can be accelerated up to 12 folds without evident sacrifice of image quality. Future studies will focus on further improvement of LapMRI, for example, optimizing the design of $$$R_{\lambda}$$$, and evaluating the method with prospectively accelerated data.Acknowledgements
No acknowledgement found.References
- Xiang L, Chen, Y, et al. Ultra-fast T2-weighted MR reconstruction using complementary T1-weighted information. International Conference on Medical Image Computing and Computer-Assisted Intervention. 2018; 215–223.
- Xiang L, Chen, Y, et al. Deep-learning-based multi-modal fusion for fast MR reconstruction. IEEE Transactions on Biomedical Engineering. 2019; 66(7): 2105–2114.
- Schlemper J, Caballero J, et al. A deep cascade of convolutional neural networks for dynamic MR image reconstruction. IEEE transactions on Medical Imaging. 2018; 37(2): 491–503.
- Quan TM, Nguyen-Duc T, et al. Compressed sensing MRI reconstruction using a generative adversarial network with a cyclic loss. IEEE Transactions on Medical Imaging. 2018; 37(6): 1488–1497.
- Ronneberger O, Fischer P, et al. U-Net: Convolutional networks for biomedical image segmentation. In: International Conference on Medical Image Computing and Computer-Assisted Intervention. 2015; 234–241.
- Commowick, O, Cervenansky F, et al. MSSEG Challenge Proceedings: Multiple Sclerosis Lesions Segmentation Challenge Using a Data Management and Processing Infrastructure. International Conference on Medical Image Computing and Computer-Assisted Intervention. 2016.
Figures
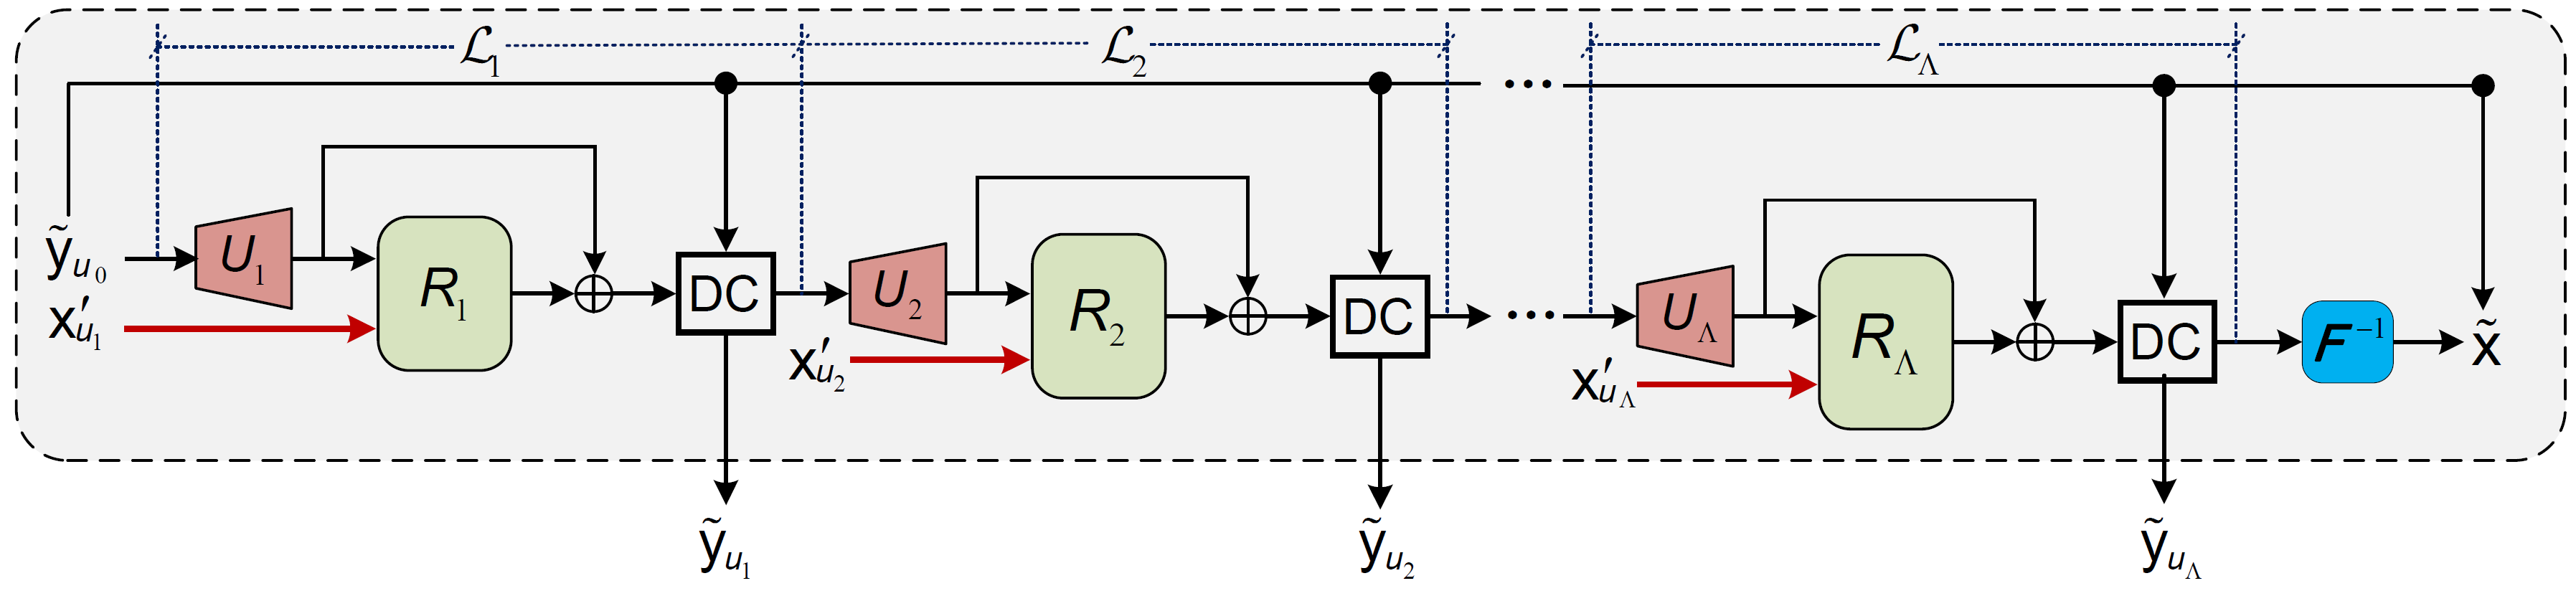
Figure 1: Schematic overview of the proposed LapMRI framework.
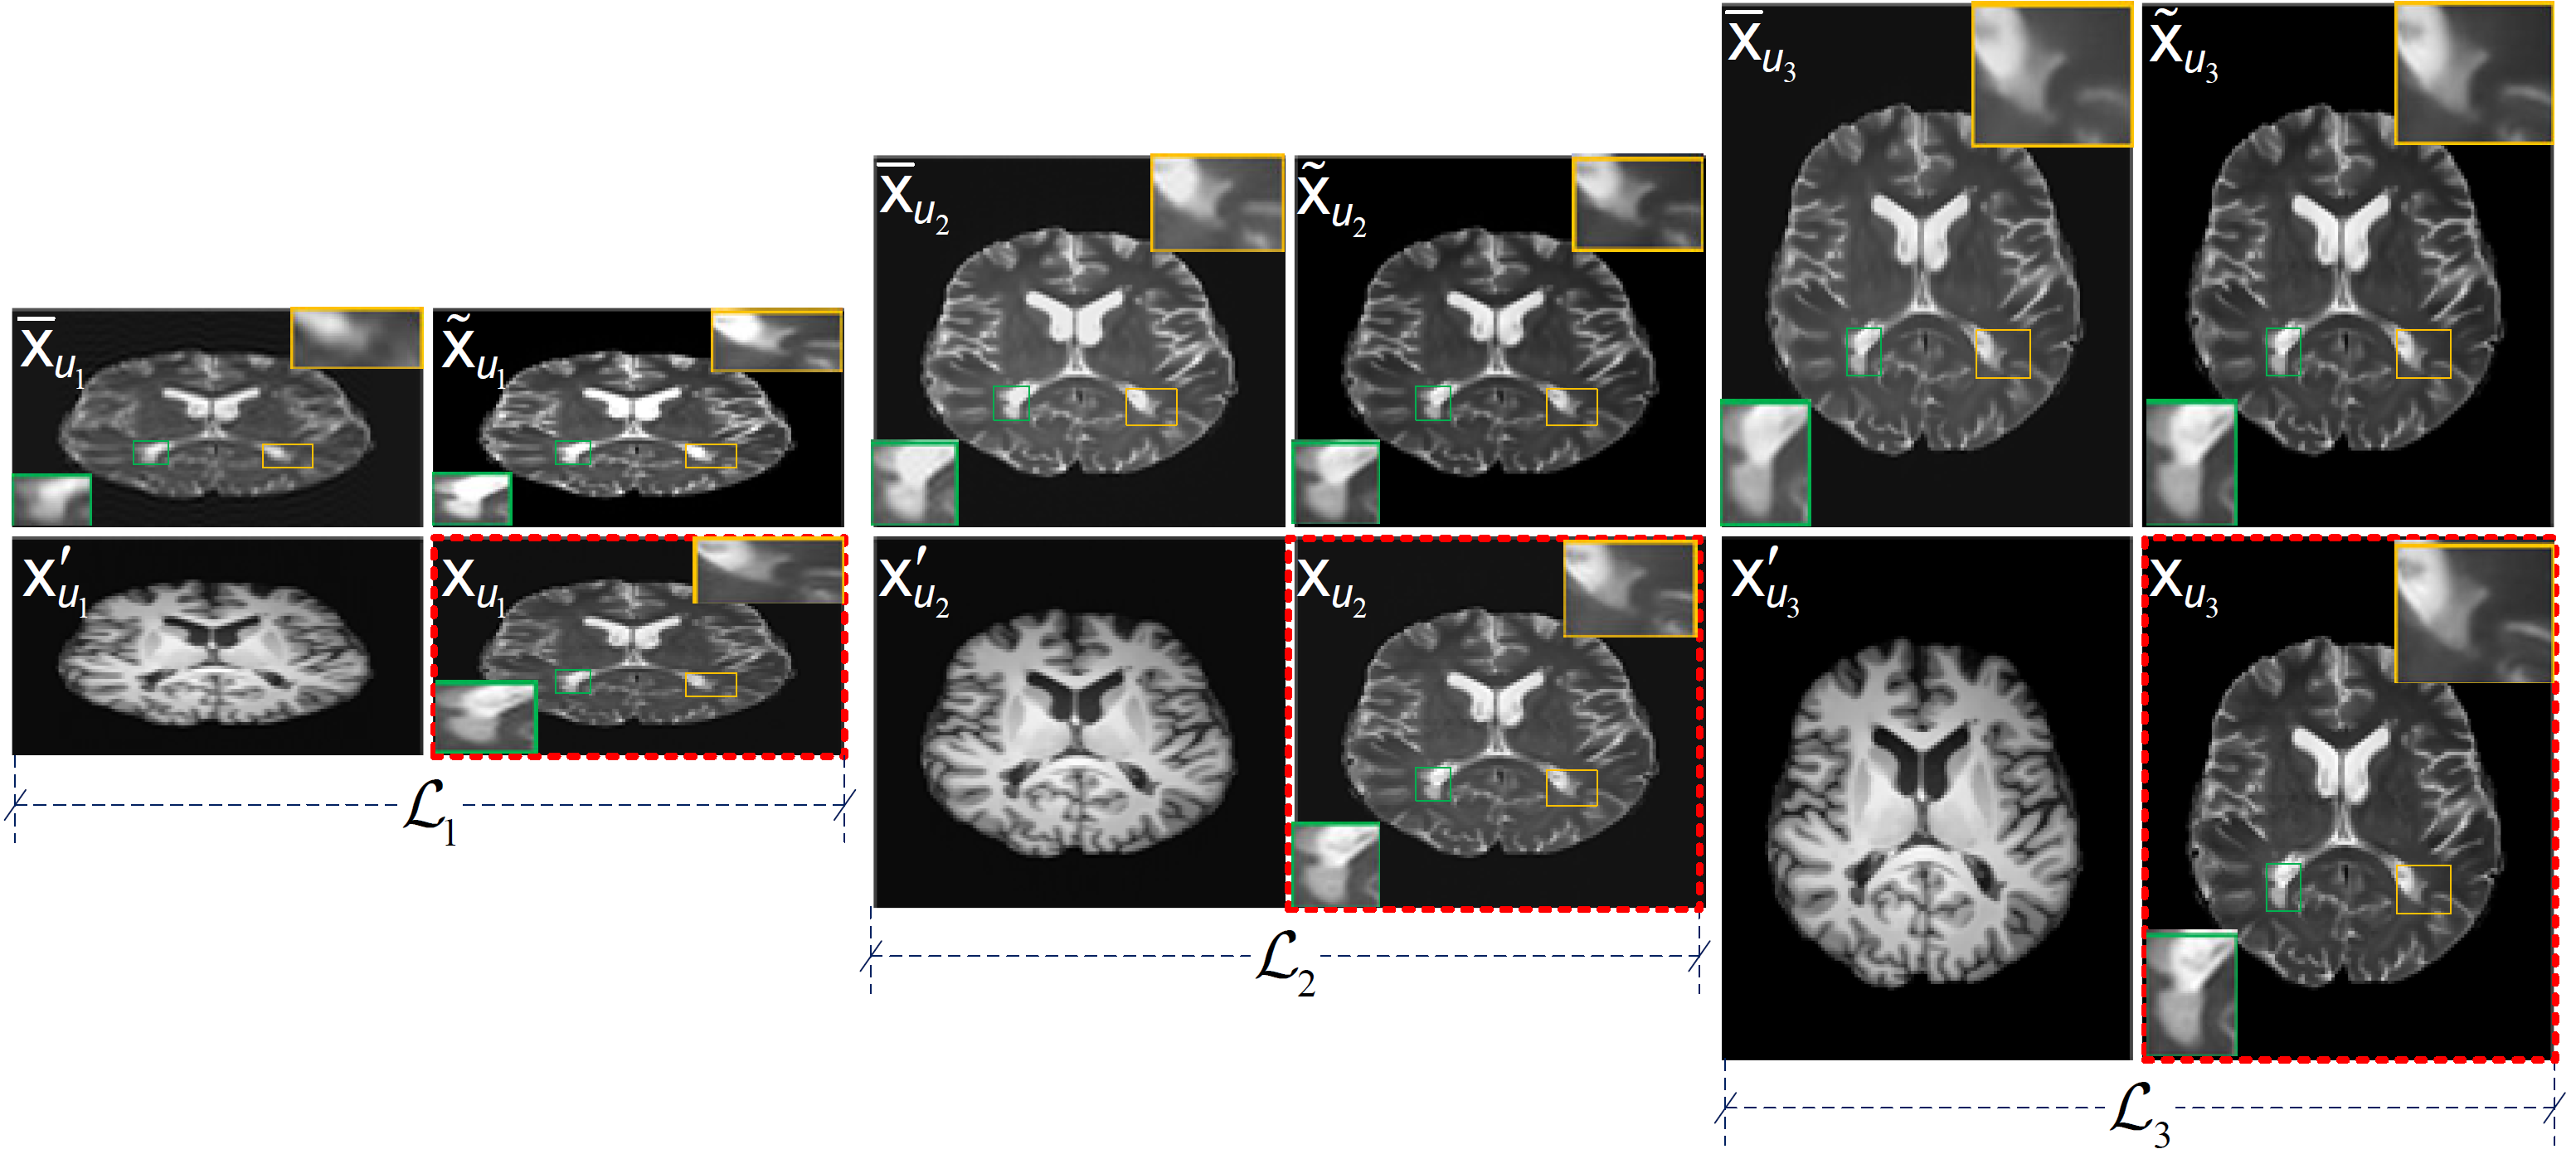
Figure 2: The inputs and outputs of LapMRI(D5C5, Λ=3) at three pyramid levels. For each pyramid level, the two images in the left column are the inputs, and the two images in the right column are the output and the respective ground-truth image, respectively. For visual understanding, the output of each pyramid level is displayed in the image domain, while the respective ground-truth image is framed with a red dotted box.
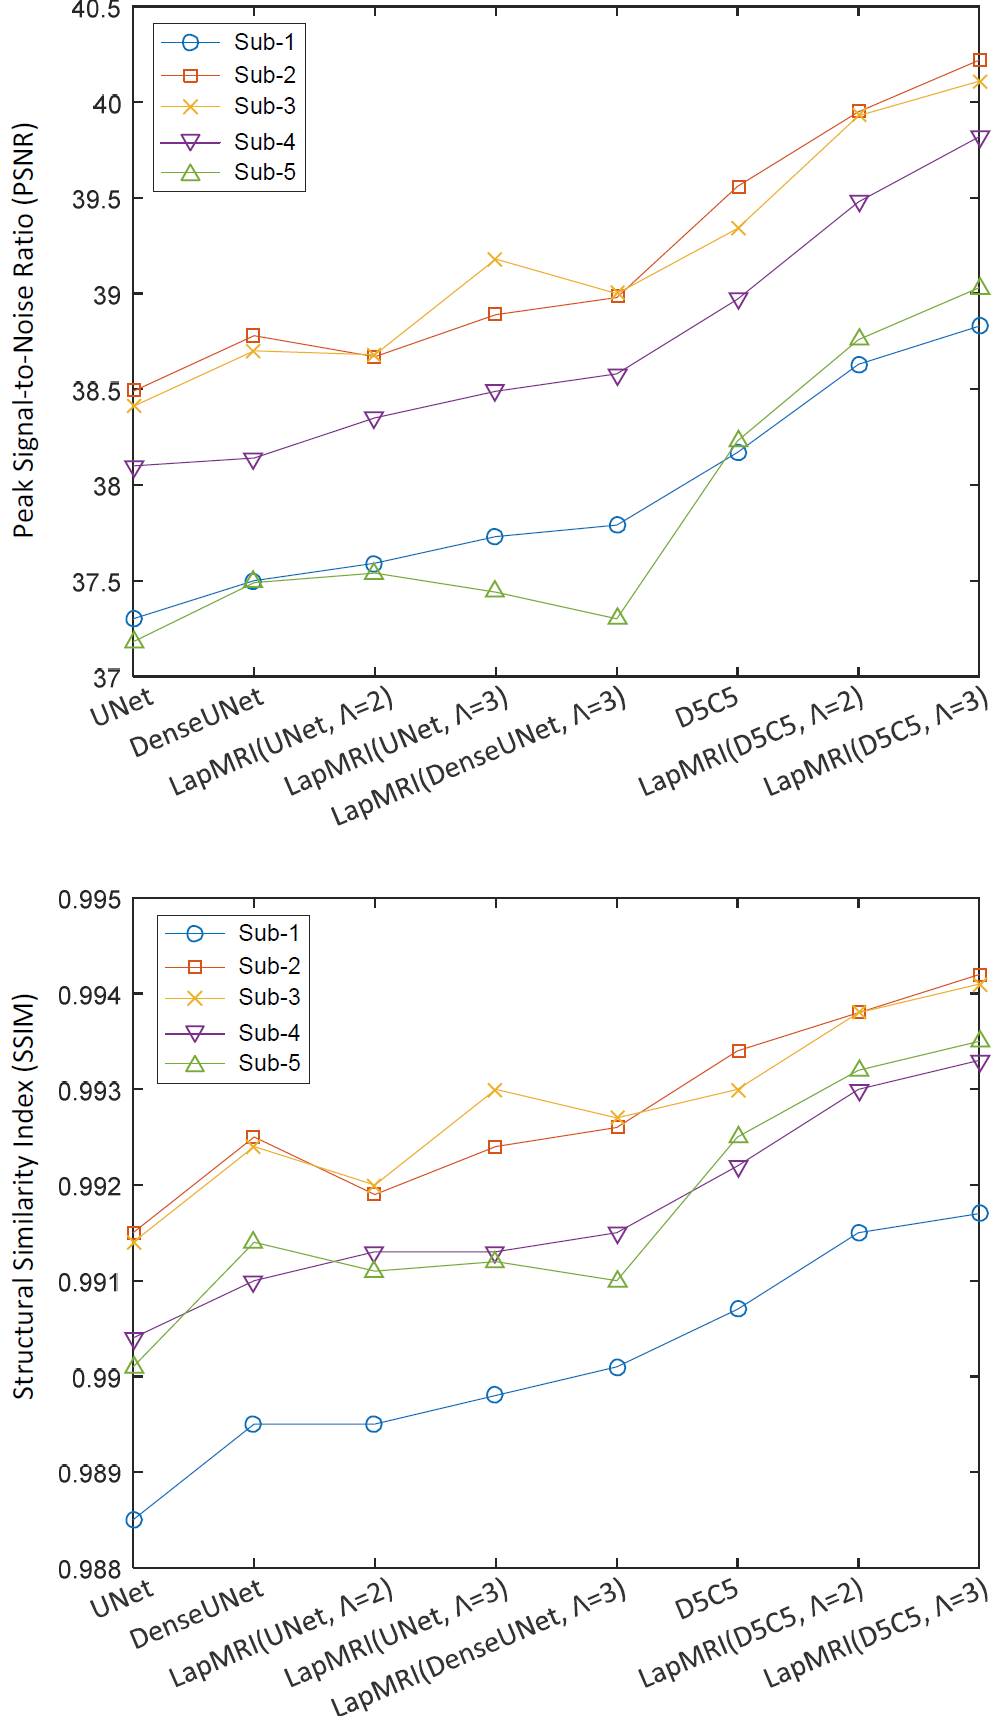
Figure 3: The effect of the number of pyramid levels Λ of LapMRI on the reconstruction performance under different residual learning networks. Except for some special cases where UNet and DenseUNet are imposed, the performance curves climb up with the increase of Λ.
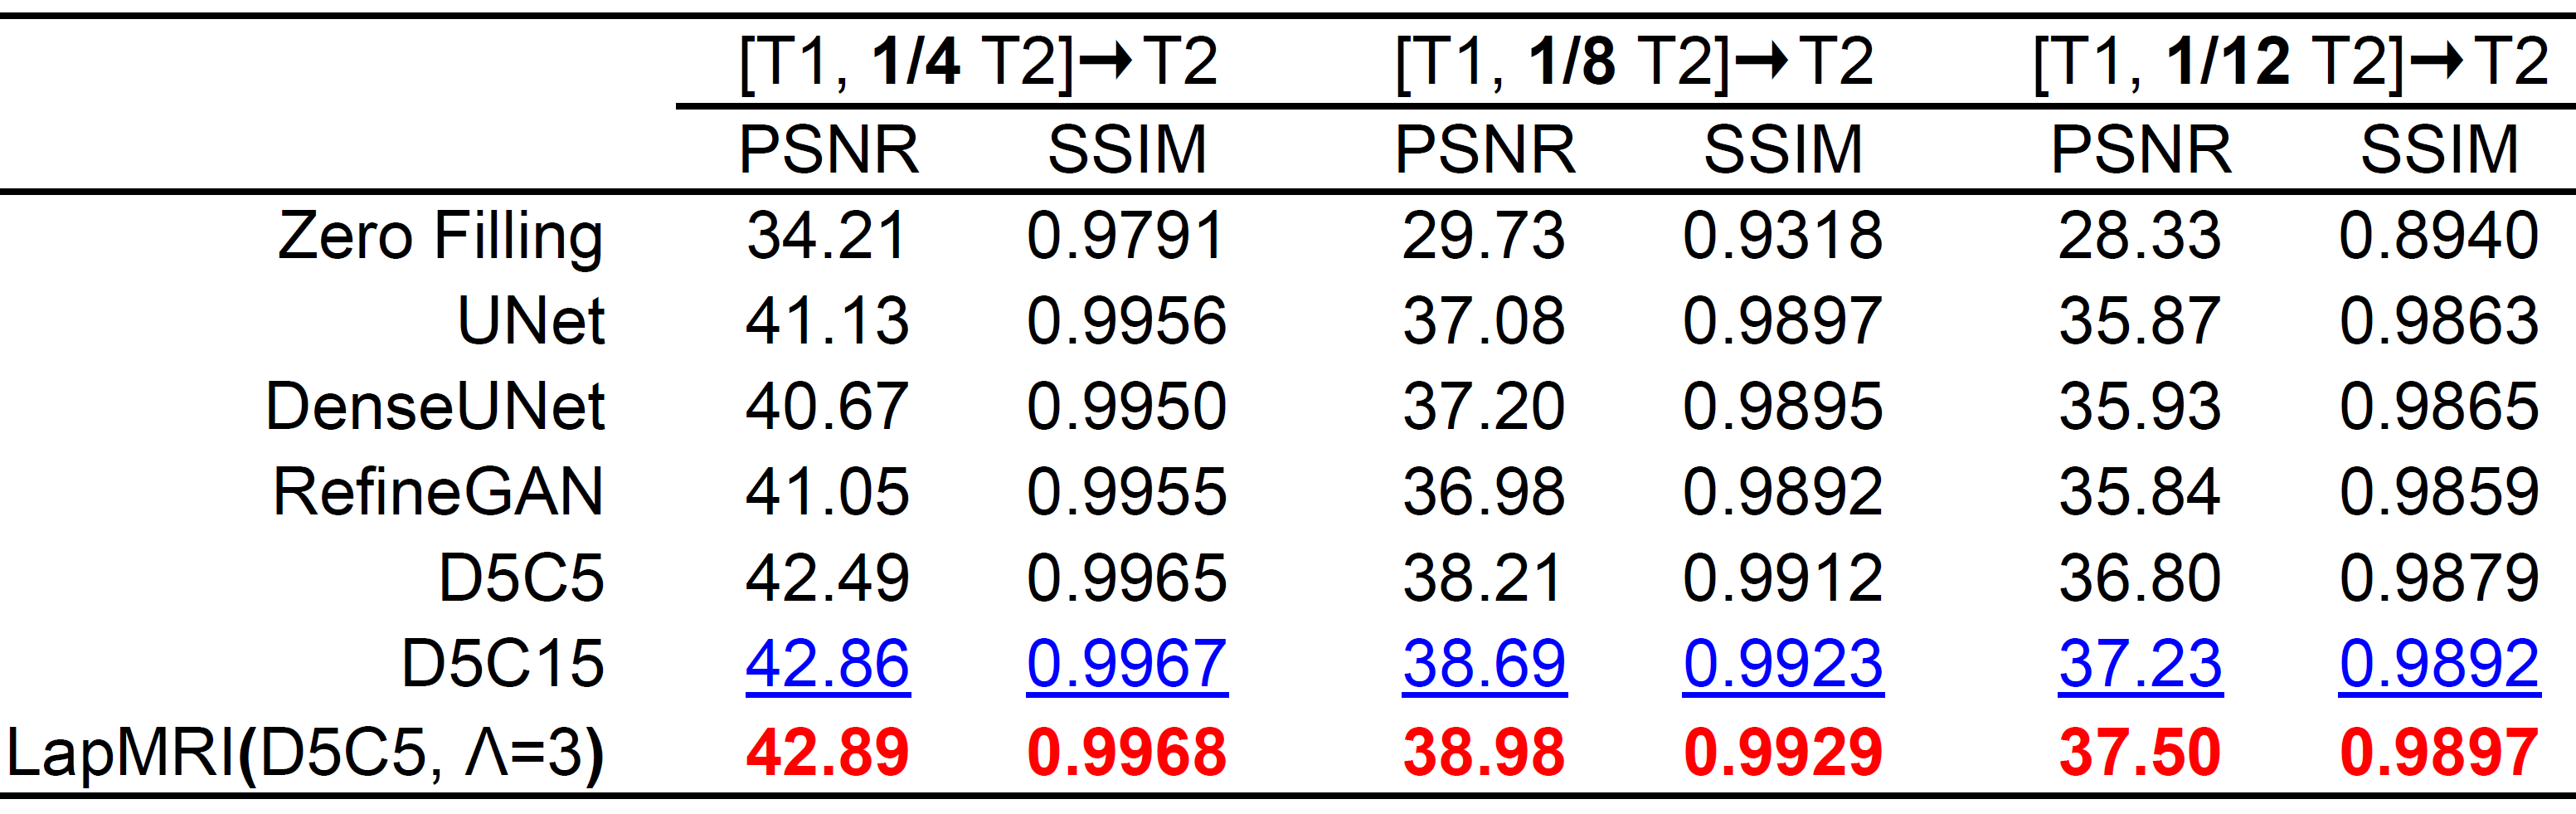
Table 1: Quantitative evaluation of state-of-the-art methods. Average Peak Signal-to-Noise Ratio (PSNR) and Structural Similarity Index (SSIM) are used for evaluating the reconstruction performance of 1/4, 1/8, and 1/12 undersampled T2 images with the aid of T1 images. Numbers in red and blue correspond
to the methods that achieved the best and the second-best performance, respectively.
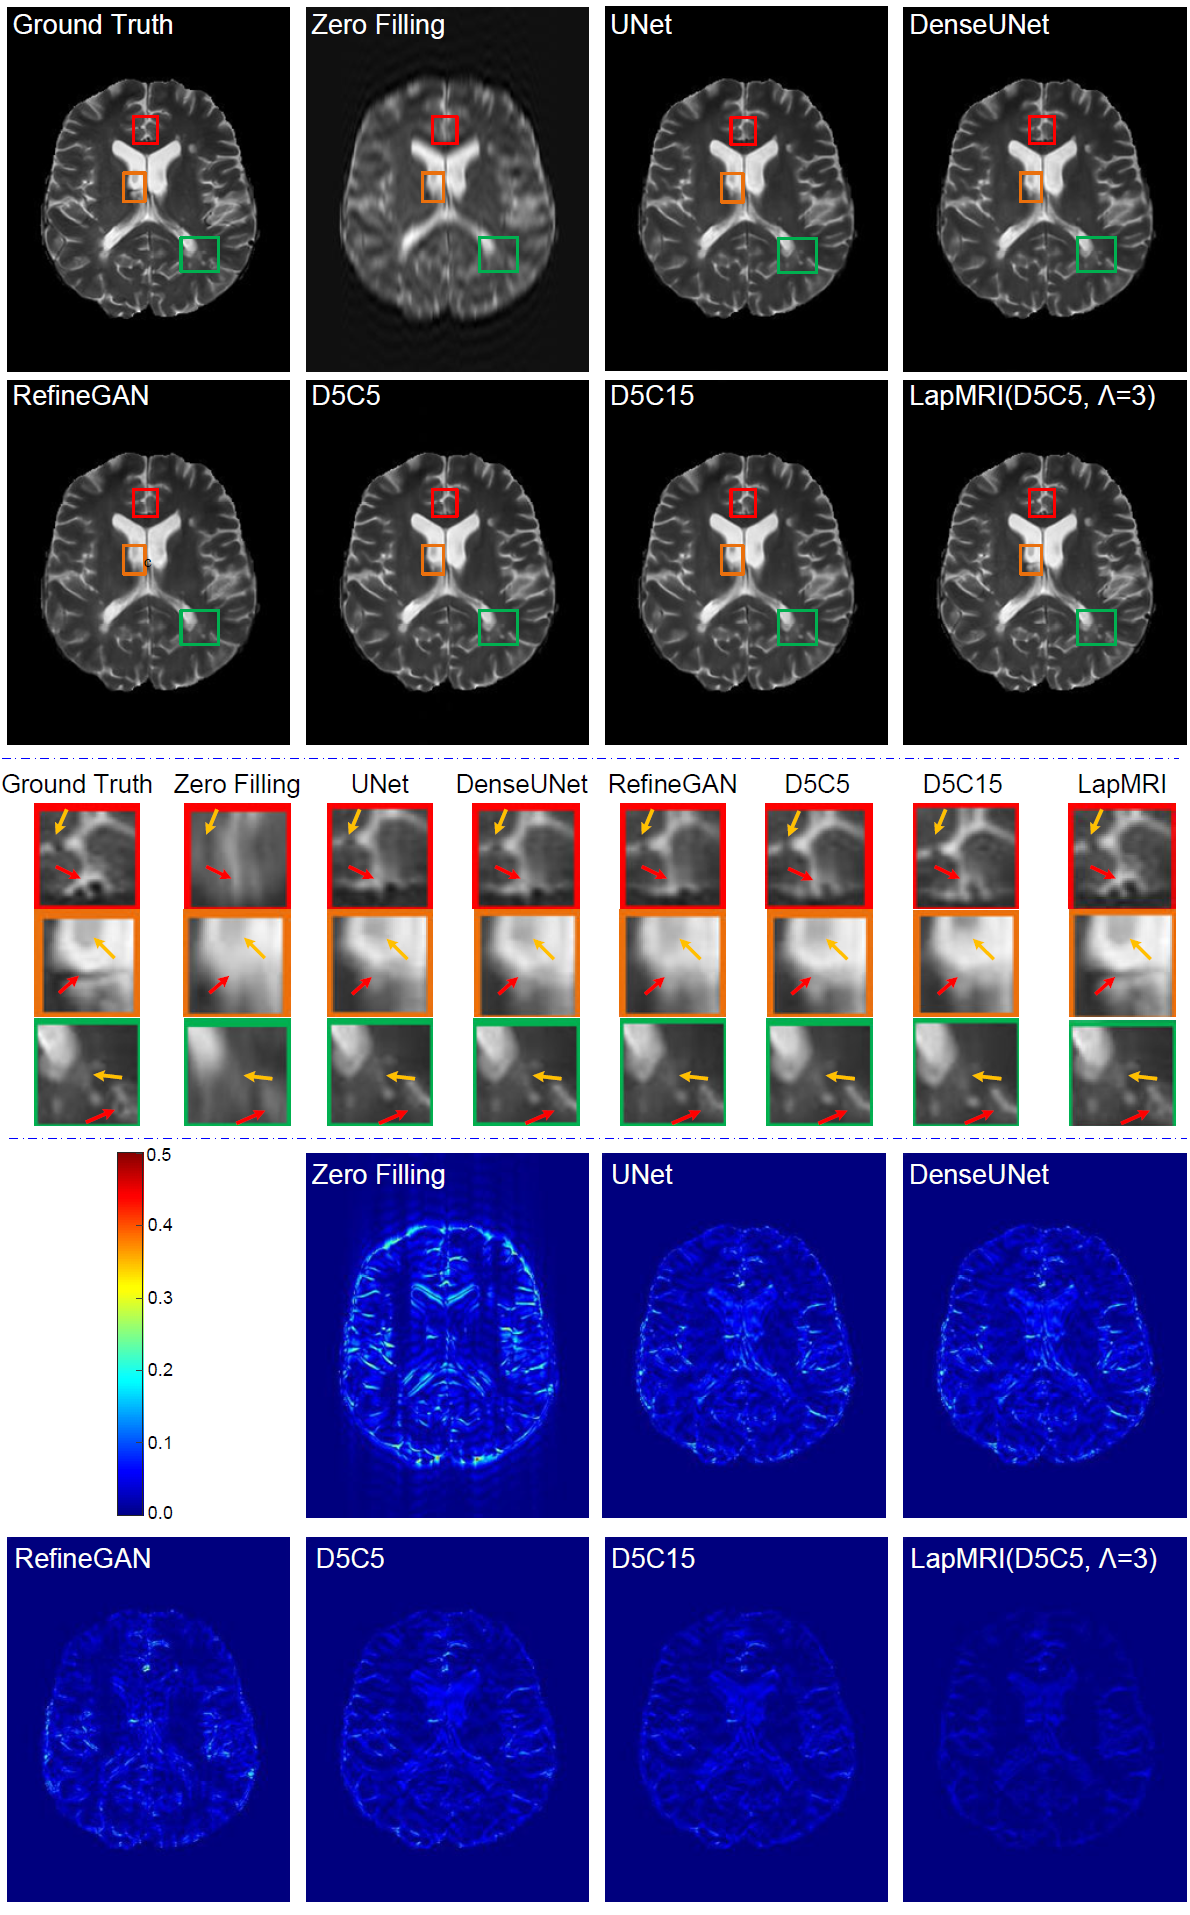
Figure 4: Visual comparison of the reconstruction results (top row) of the seven compared methods for 12-fold undersampled T2 images. Three enlarged subregions of each reconstructed image and the error maps are shown in the middle row and the bottom row, respectively.