1951
A Custom Loss Function for Deep Learning-Based Brain MRI Reconstruction
Abhinav Saksena1, Makarand Parigi1, Nicole Seiberlich2, and Yun Jiang2
1EECS, University of Michigan, Ann Arbor, MI, United States, 2Department of Radiology, University of Michigan, Ann Arbor, MI, United States
1EECS, University of Michigan, Ann Arbor, MI, United States, 2Department of Radiology, University of Michigan, Ann Arbor, MI, United States
Synopsis
The purpose of this work is to test and evaluate a number of candidate loss functions for the reconstruction of diagnostic quality brain MRI images using undersampled k-space data and CNNs. We investigate both per-pixel (L1) and perceptual based (SSIM) loss functions, before developing a custom loss function that incorporates elements of both. We train these loss functions implemented in a UNet architecture on both 4x and 8x undersampled 16-coil MRI data. The custom loss function is shown to produce both the best quantitative results and also sharper and more detailed reconstructions across a number of image contrasts.
Introduction
The goal of this work is to develop a custom loss function for reconstructing MR images using a deep neural network. Deep learning has become an increasingly promising method to improve image quality of accelerated MR images1. A loss function is a crucial aspect in this application, as it should mimic as closely as possible the perceived difference between the ground truth and a reconstructed image from the perspective of a radiologist2. In this paper, we propose a variant of the $$$L_{mix}$$$ function3 and evaluate the performance of the proposed loss function against a selection of pixel-wise and perceptual loss functions (L1, SSIM, MS-SSIM) implemented with the UNet architecture using the FastMRI Dataset1Methods
Undersampled k-space data is obtained by extracting data from the FastMRI repository1 and applying an equispaced mask with 4-fold and 8-fold acceleration on the fully sampled k-space data. An inverse Fourier Transform is applied to these data to obtain a zero-filled image, which is inputted to a 32-channel UNet architecture. The model outputs a reconstructed MRI image $$$x$$$, which is compared to a fully-sampled ground-truth image $$$y$$$ in each of the candidate loss functions during backpropagation.This proposed loss function is inspired by the Mix-Loss function created by Zhao et. al3. It preserves desirable properties of both pixel wise and perceptual losses by linearly combining them. By comparing each individual pixel, L1 is better able to preserve properties such as luminance, while MS-SSIM is superior at preserving the overall structure and contrast of the image3. MS-SSIM is preferred over SSIM because it iteratively applies M low-pass Gaussian filters while computing the contrast and structural components of SSIM, and is thus not dependent on a single filter4.
$$$L_{custom}=\alpha\cdot L_{msssim}+(1-\alpha)\cdot L_{l1}$$$, where
$$$L_{msssim}=1-(l_{M}(x,y)+\prod_{j=1}^Mc_{j}(x,y)\cdot s_{j}(x,y))$$$
$$$l_{M}$$$ represents the comparison between the luminance at the final iteration of $$$M$$$. $$$c_{j}$$$ and $$$s_{j}$$$ represent the contrast and structural comparisons using the $$$j$$$th filter4.
A grid search was used to fine tune the value of $$$\alpha$$$, where multiple values of $$$\alpha$$$ between 0 and 1 inclusive were tested with increments of 0.15. It was found that $$$\alpha = 0.75$$$ provided optimal results in terms of SSIM scores. Each loss function was trained with the UNet on a modified version of the fastMRI brain dataset which only included 16-coil data (29215 image slices). The training was done using two NVIDIA Teslas over 35 epochs for 4-fold acceleration and 12 epochs for 8-fold, with a learning rate of 0.001. The final reconstructions will be evaluated on quantitative metrics such as SSIM, Peak Signal-to-Noise Ratio (PSNR) and Normalized Mean Squared Error (NMSE). They will also be assessed qualitatively on sharpness and accuracy relative to the ground truth.
Results
As seen for reconstructed images from both 4-fold and 8-fold acceleration in Figures 1-2, the family of perceptual loss functions (particularly $$$L_{custom}$$$) produce sharper and more accurate image reconstructions across various image contrasts as compared to $$$L_{l1}$$$. Despite their lower SSIM scores and poorer reconstruction quality, the FLAIR contrast images in Figures 1-2 were specifically selected to highlight the relative improvement from one loss function to the other. This is best illustrated in the 8-fold FLAIR reconstruction in Figure 2, where $$$L_{custom}$$$ produces a significantly improved reconstruction over $$$L_{l1}$$$. Tables 1 and 2 illustrate that $$$L_{custom}$$$ achieves the highest SSIM score (0.9402) for both 4x and 8x accelerations. For 4x, $$$L_{l1}$$$ marginally outperforms the other loss functions on every other evaluation metric. This includes it outperforming $$$L_{ssim}$$$ and $$$L_{msssim}$$$ on the SSIM metric ($$$L_{l1}$$$ gets an SSIM score of 0.9398, while $$$L_{ssim}$$$ and $$$L_{msssim}$$$ both get 0.9395), which is most commonly used for MRI benchmarking. On the other hand, for 8x acceleration, $$$L_{custom}$$$ outperforms the other loss functions in every metric except for PSNR, where $$$L_{l1}$$$ produces a slightly higher score of 33.08.Conclusion and Discussion
With both its superior SSIM score and image quality, $$$L_{custom}$$$ improves performance over existing loss functions for MRI reconstruction. A weighted $$$L_{l1}$$$ inclusion in however still provides some useful properties, such as preserving luminance3. However, given the superior quantitative performance of $$$L_{l1}$$$ over the other perceptual loss functions in certain metrics for 4-fold acceleration despite poorer image quality, it is shown that these evaluation metrics, especially SSIM, could be misleading if used alone to determine reconstruction quality. Further research could possibly identify or create a quantitative evaluation metric that more closely matches the perspective of radiologists.Acknowledgements
We would like to thank Facebook AI and NYU Langone Health for providing support on the fastMRI repository.References
- Zbontar, Jure, et al. “FastMRI: An Open Dataset and Benchmarks for Accelerated MRI.” ArXiv:1811.08839 [Physics, Stat], Dec. 2019. arXiv.org, http://arxiv.org/abs/1811.08839.
- Ghodrati, Vahid, et al. “MR Image Reconstruction Using Deep Learning: Evaluation of Network Structure and Loss Functions.” Quantitative Imaging in Medicine and Surgery, vol. 9, no. 9, Sept. 2019, pp. 1516–27. PubMed Central, doi:10.21037/qims.2019.08.10.
- Zhao, Hang, et al. “Loss Functions for Neural Networks for Image Processing.” ArXiv:1511.08861 [Cs], Apr. 2018. arXiv.org, http://arxiv.org/abs/1511.08861.
- Wang, Z., et al. “Multiscale Structural Similarity for Image Quality Assessment.” The Thrity-Seventh Asilomar Conference on Signals, Systems Computers, 2003, vol. 2, 2003, pp. 1398-1402 Vol.2. IEEE Xplore, doi:10.1109/ACSSC.2003.1292216.
- Sriram, Anuroop, et al. “End-to-End Variational Networks for Accelerated MRI Reconstruction.” ArXiv:2004.06688 [Cs, Eess], Apr. 2020. arXiv.org, http://arxiv.org/abs/2004.06688.
- Hammernik, Kerstin, Jo Schlemper, et al. “$\Sigma$-Net: Systematic Evaluation of Iterative Deep Neural Networks for Fast Parallel MR Image Reconstruction.” ArXiv:1912.09278 [Cs, Eess], Dec. 2019. arXiv.org, http://arxiv.org/abs/1912.09278.
- Hammernik, Kerstin, Teresa Klatzer, et al. “Learning a Variational Network for Reconstruction of Accelerated MRI Data.” ArXiv:1704.00447 [Cs], Apr. 2017. arXiv.org, http://arxiv.org/abs/1704.00447.
- Johnson, Justin, et al. “Perceptual Losses for Real-Time Style Transfer and Super-Resolution.” ArXiv:1603.08155 [Cs], Mar. 2016. arXiv.org, http://arxiv.org/abs/1603.08155.
- Schlemper, Jo, et al. “$\Sigma$-Net: Ensembled Iterative Deep Neural Networks for Accelerated Parallel MR Image Reconstruction.” ArXiv:1912.05480 [Cs, Eess, Stat], Dec. 2019. arXiv.org, http://arxiv.org/abs/1912.05480.
Figures
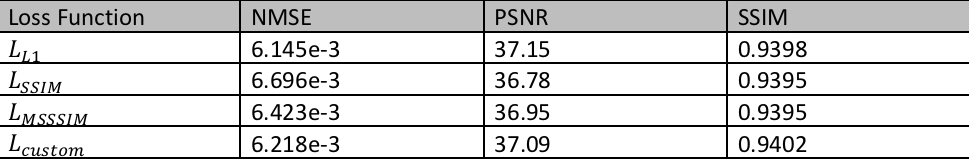
Table 1: 4-fold acceleration results averaged across the 16-coil only FastMRI validation dataset. For PSNR and SSIM, the higher the score the better, and vice-versa for NMSE.
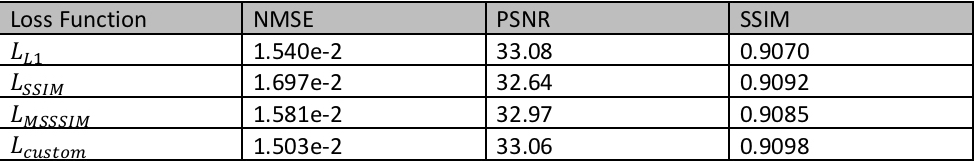
Table 2: 8-fold acceleration results averaged across the 16-coil only FastMRI validation dataset. For PSNR and SSIM, the higher the score the better, and vice-versa for NMSE.
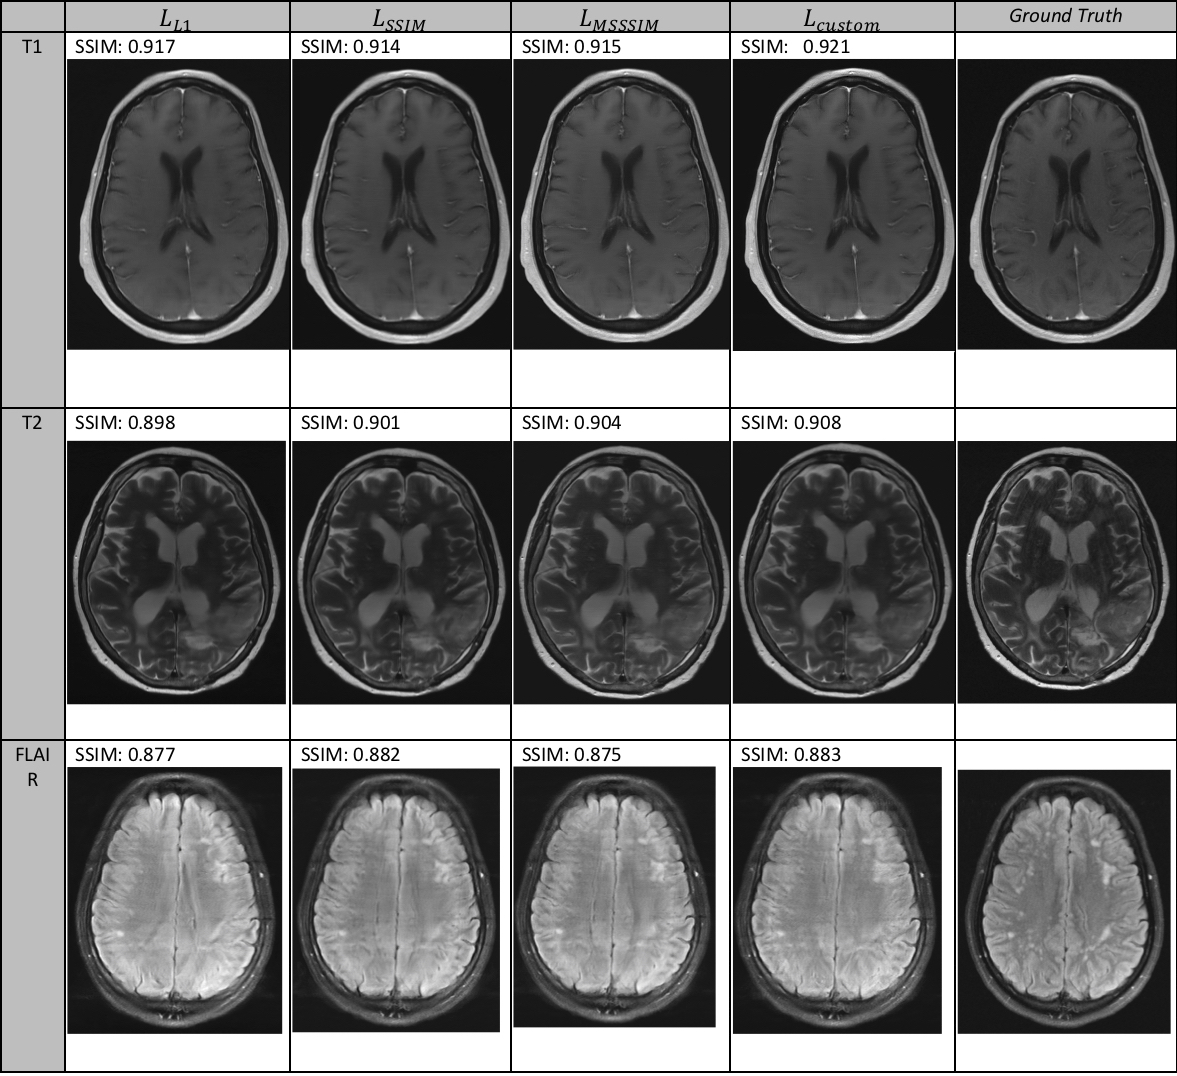
Figure 1: Sample reconstructions for the different loss functions with 4-fold acceleration. Each row represents a different image contrast.
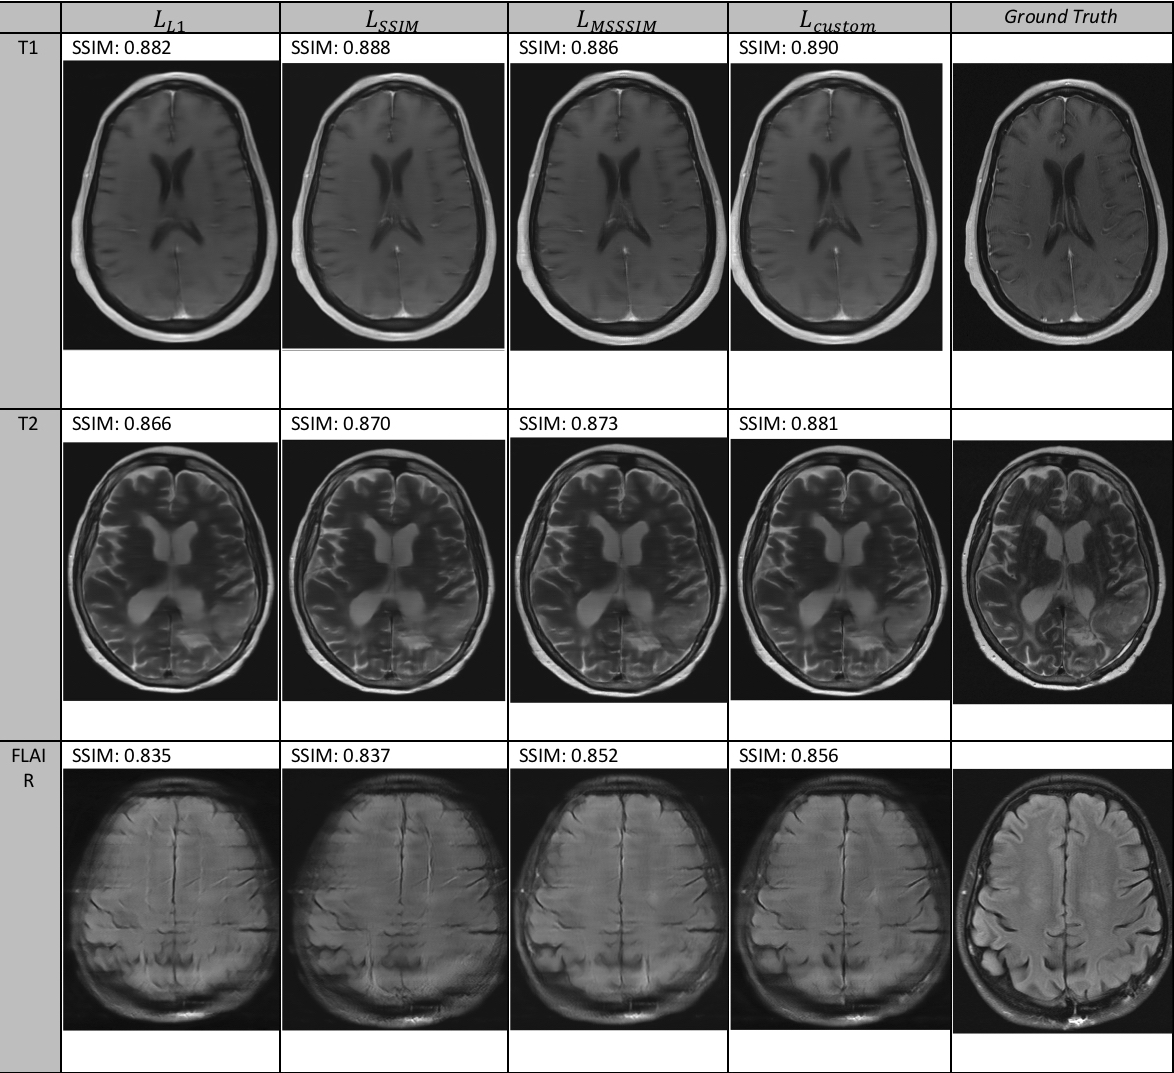
Figure 2: Sample reconstructions for the different loss functions with 8-fold acceleration. Each row represents a different image contrast.