1942
Early Stage Diagnosis of Alzheimer’s Disease Employing DTI-Derived Biomarkers1Quantitative MR Imaging and Spectroscopy Group, Research Center for Cellular and Molecular Imaging, Tehran University of Medical Sciences, Tehran, Iran (Islamic Republic of), 2Department of Medical Physics and Biomedical Engineering, School of Medicine, Tehran University of Medical Sciences, Tehran, Iran (Islamic Republic of), 3Department of Electrical Engineering, Iran University of Science and Technology, Tehran, Iran (Islamic Republic of), 4Memory and Behavioral Neurology Department, Roozbeh Hospital, Tehran University of Medical Sciences, Tehran, Iran (Islamic Republic of), 5Department of Medical Physics and Biomedical Engineering, School of Medicine, Tehran, Iran (Islamic Republic of)
Synopsis
Morphologic alterations of AD have been conventionally associated with the cerebral cortex; however, it is clear that other areas of the brain, especially the hippocampus are also involved. These structures, together with white matter structures including fornix constitute the limbic system, which is anatomic substrate of the memory system. Neurodegeneration in these areas lead to clinical manifestation of AD. In this study, we evaluated integrity of the limbic-associated areas in three groups using DTI. Findings yielded that the DTI-derived indices of the limbic-associated areas offer potential biomarkers for early and differential diagnosis of AD.
INTRODUCTION
Dementia is the major healthcare issue in the 21st century(1) causing a progressive cognitive decline in the aging population. Alzheimer’s disease (AD) is the most frequent neurodegenerative disorder(2). Mild Cognitive Impairment (MCI) usually represents a transitional phase between normal aging and AD(3). In spite of vast investigations; there is still no reliable cure for AD(4) mainly because the etiopathogenesis of AD still remains unclear due to its multifactorial nature. The limbic system consisting of Gray Matter (GM) structures and their White Matter (WM) connections, play key roles in memory(5). Literature regarding structural Magnetic Resonance Imaging (MRI) has highlighted atrophy in GMs, including the hippocampus. Diffusion Tensor Imaging (DTI) is a variant of MRI sensitive to microscopic WM changes not detectable with standard MRI. DTI-based WM studies indicated widespread alterations including cingulum bundle(6). Studies have shown that WM damage has been correlated with atrophy in anatomically connected GM areas in AD patients(7). Despite growing diffusion imaging evidence of AD-related WM changes, it is not clear which of the brain's systems and related DTI measures are the most sensitive for differential diagnosis. In this study, we employ a system-based evaluation and hypothesis that the alterations of the DTI metrics of the limbic-associated GMs and WMs can differentiate AD.METHODS
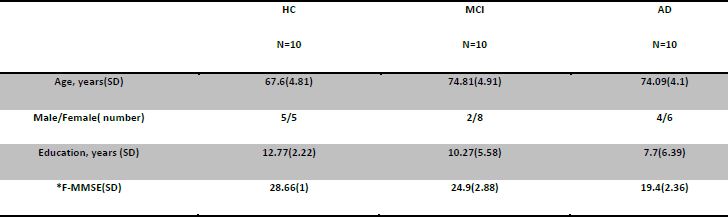
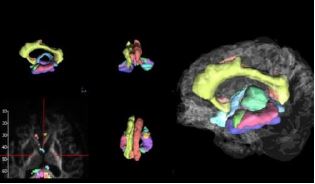
Subjects: A total number of 30 subjects, including 10 old cognitively normal controls, 10 patients with amnestic MCI, and 10 patients with mild AD were recruited from Yaadmaan Institute for Brain, Cognition & Memory Studies (Tehran, Iran). All subjects underwent neuropsychological screening (Tab. 1).MRI protocol: Participants underwent an imaging protocol that included three-dimensional (3D) T1-weighted and DTI, using a 3.0 T Prisma MR imager (Siemens, Germany) at the National Brain Mapping Laboratory (Tehran, Iran), with a 64-channel head coil. DTI images were acquired using an Echo-Planar Imaging (EPI) sequence: 64 directions, TR= 8400 ms, TE= 90 ms, Voxel size= 2.04 × 2.04 × 2, 65 slices; slice thickness= 2 mm, FOV= 245mm, matrix size= 120 × 120 × 64.Image processing: Data analysis and preprocessing were performed with Explore DTI software version 4.8.6(8). The atlas-based analysis was performed. The parcellation map which includes both GMs and WMs associated with the limbic system, automatically overlaid on the images normalized to the atlas space in order to measure parameters including Fractional Anisotropy (FA), Mean Diffusivity (MD), Axial Diffusivity (AxD), and Radial Diffusivity (RD) in each ROI (Fig. 1). Statistical Analysis: The one way ANOVA was used to compare three groups. P-value of <0.05 was determined as a significant level.
RESULTS
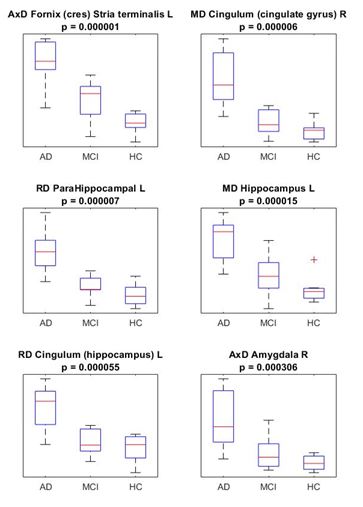
ROI analyses revealed widespread group differences including fornix, MD of the right cingulate gyrus, RD of left hippocampal cingulum bundle, RD of the left parahippocampal gyrus, MD of the left hippocampus, and AxD of the right amygdala. The most significant measure was the AxD of the left fornix (p-value= 0.01E-3) (Fig. 2).DISCUSSION
The increase in MD and AxD in GMs are assumed to reflect the breakdown of microstructural barriers and axonal damage. The increases in RD have been specifically associated with myelin degeneration. The decrease in FA shows WM integrity loss. The altered fornix DTI-measures have been said to be hippocampal atrophy predictor(9) may be an important biomarker of AD progression in our study. Our DTI findings show degeneration of the fornix and cingulum bundle, which are the major input and output pathways of the hippocampal formation. Limbic-associated GMs diffusion alterations including the hippocampus, leading to memory impairment(5). To our knowledge, few studies have tested limbic-associated structures with just DTI.CONCLUSION
In conclusion, our findings indicate that the DTI-derived metrics of the limbic-associated areas can distinguish among groups. In this work AxD, MD and RD seem to be more sensitive markers of AD-related white matter pathology than FA. Degenerative changes in the limbic system likely have a role in the genesis of AD and maybe serve as a potential biomarker. In addition, our results might explain the structure-specific alterations hypothesis in AD (10). Future longitudinal studies of the relations between DTI-derived metrics and the limbic system in AD are required to determine whether the limbic system DTI has the potential to evaluate the progression of MCI to AD.Acknowledgements
No acknowledgement found.References
1. Prince M, Guerchet M, Prina M. The Global Impact of Dementia 2013 – 2050 Policy Brief for Heads of Government. Policy Br Heads Gov [Internet]. 2013;1–8. Available from: https://www.alz.co.uk/research/GlobalImpactDementia2013.pdf
2. Barragán Martínez D, García Soldevilla MA, Parra Santiago A, Tejeiro Martínez J. Alzheimer’s disease. Med. 2019;12(74).
3. Petersen RC. Mild Cognitive Impairment. Contin Lifelong Learn Neurol [Internet]. 2016 Apr [cited 2019 Jul 7];22(2, Dementia):404–18. Available from: http://www.ncbi.nlm.nih.gov/pubmed/27042901
4. Cummings J, Lee G, Ritter A, Sabbagh M, Zhong K. Alzheimer’s disease drug development pipeline: 2019. Alzheimer’s Dement Transl Res Clin Interv [Internet]. 2019;5:272–93. Available from: https://doi.org/10.1016/j.trci.2019.05.008
5. RajMohan V, Mohandas E. The limbic system. Indian J Psychiatry [Internet]. 2007 [cited 2020 Nov 22];49(2):132. Available from: https://www.ncbi.nlm.nih.gov/pmc/articles/PMC2917081/
6. Oishi K, Lyketsos CG. Alzheimer’s disease and the fornix. Front Aging Neurosci. 2014;6(SEP).
7. Agosta F, Pievani M, Sala S, Geroldi C, Galluzzi S, Frisoni GB, et al. White matter damage in Alzheimer disease and its relationship to gray matter atrophy. Radiology [Internet]. 2011 Mar 1 [cited 2020 Nov 23];258(3):853–63. Available from: http://radiology.rsna.org/lookup/suppl/doi:10.1148/radiol.10101284/-/DC1
8. Leemans A, Jeurissen B, Sijbers J, Jones DK. ExploreDTI: a graphical toolbox for processing, analyzing, and visualizing diffusion MR data [Internet]. [cited 2019 Oct 28]. Available from: http://www.exploredti.com.
9. Mielke MM, Okonkwo OC, Oishi K, Mori S, Tighe S, Miller MI, et al. Fornix integrity and hippocampal volume predict memory decline and progression to Alzheimer’s disease. Alzheimer’s Dement [Internet]. 2012 Mar [cited 2020 Nov 30];8(2):105–13. Available from: https://pubmed.ncbi.nlm.nih.gov/22404852/
10. Liu Y, Spulber G, Lehtimäki KK, Könönen M, Hallikainen I, Gröhn H, et al. Diffusion tensor imaging and Tract-Based Spatial Statistics in Alzheimer’s disease and mild cognitive impairment. Neurobiol Aging. 2011 Sep 1;32(9):1558–71.
Figures