1940
Longitudinal Characterization of Volumetric Changes During Healthy Aging and Between Sexes in the Fischer 344 Rat Brain1McGill University, Montreal, QC, Canada, 2Centre d'Imagerie Cérébrale, Douglas Mental Health University Institute, Montreal, QC, Canada, 3Center for Translational Neuroimaging, Northeastern University, Boston, MA, United States
Synopsis
In order to design effective interventions for age-related diseases, it is necessary to first understand the biological processes associated with healthy aging. In this way, physiological changes during aging can be distinguished from those arising due to pathology. To this end, we present a comprehensive analysis of MRI-derived volumetric brain changes during healthy aging in a mixed-sex cohort of 27 Fischer 344 wildtype rats. These findings contribute to our understanding of the baseline neuroanatomical changes associated with healthy aging in both sexes, critical for the proper identification and management of age-related diseases, which frequently present in sexually dimorphic ways.
Introduction
Normal aging is associated with altered cognition and behaviour, features that are often further exacerbated in neurodegenerative diseases such as Alzheimer’s Disease. These age-related diseases may have roots in altered brain structure but disentangling pathology from healthy aging can be challenging, particularly in the early phases of the disease when features may be subclinical. Therefore, a detailed understanding of baseline neuroanatomical change with age is crucial before one can identify how the brain is altered in the context of pathology.We describe a mixed-sex, longitudinal analysis of neuroanatomy in the Fischer 344 wildtype rat over the majority of their lifespan1. Though authors have previously performed volumetric analyses of the rodent brain2-5, to the best of our knowledge no study has investigated age- and sex-related related morphometric changes to the extent we report here. We present a comprehensive examination of longitudinal morphometric change over the majority of the adult rat lifespan, as well as between sexes, within 71 brain regions, providing new insight into neuroanatomical trajectories during healthy aging.
Methods
Animals:Homozygous Fischer 344/NHsd wildtype (WT) rats were obtained from Envigo Laboratories. MRI scans were acquired longitudinally, with scans at 4-, 10-, 16-, and 20-months of age, covering the majority of the adult rat lifespan. 27 rats (12M/15F) were included in the study after quality controlling.
Data Acquisition:
MRI data were acquired using a 7 Tesla Bruker Biospec 70/30 scanner. High-resolution 3D anatomical MR images were acquired using a RARE sequence with parameters: TR=325ms, echo spacing=10.8ms, RARE factor=6, effective echo time=32.4 ms, FOV=20.6×17.9×29.3mm, matrix size=256×180×157, slice thickness=17.9mm, scanner resolution=114μm isotropic.
Data Processing:
All images were processed in MINC2.0. Preprocessing consisted of a custom, iterative process with N4BiasFieldCorrection from ANTs6, and mask generation from registration to a template7. After preprocessing, images were quality controlled for motion artefacts and image anomalies, resulting in the removal of four scans. The 83 remaining scans were then co-registered to each other using Pydpiper twolevel_model_building.py pipeline8. Pydpiper uses deformation-based morphometry to generate relative (local changes) and absolute (local + global changes) Jacobian deformation fields for each image which are used to estimate the voxelwise Jacobian determinant. This reflects the amount of change required to deform the initial anatomical image to the consensus average. The resulting Jacobians were blurred with a Gaussian kernel with FWHM 200 μm. In this study, the relative Jacobians were used for analysis to show how regions are changing in the Fischer brain with respect to each other.
Analysis:
Using a Fischer atlas7 (see Figure 1) resampled into common space, volumes for 71 regions were estimated in RMINC9 with anatGetAll(). This function takes a set of Jacobian images and integrates all voxels with a given regional label (as defined by the atlas) to generate the volume for each region in the atlas. The following linear mixed effects model was then applied to each region, where ns represents a natural spline function, FDR corrected to 5%.
$$RelativeVolume\sim ns(age,2)\times sex+(1|subject)$$
Results and Discussion
The main structural findings are visually summarized in Figure 2. Each column represents a different term of the linear model described in the Methods section, and regions are defined as per the atlas shown in Figure 1.Grey Matter: With age, most grey matter regions show a relative decrease in volume. As the left two columns in Figure 2 indicate, there are typically both linear and second order changes with age. These effects are particularly strong in the cortex. As Figure 3 shows, the right cortical hemispheres of males and females show similar age-related changes. Specifically, the cortex displays a linear decrease early on in development followed by curvilinear changes by 16 months. A main effect of sex is also present, wherein females display a consistently larger cortical volume. The right Caudoputamen and right Hippocampus also decrease with age but in the presence of an age by sex interaction.
White Matter: In contrast with the generally decreasing relative fraction of grey matter throughout healthy aging, white matter tracts such as the Corpus Callosum, Fimbria, and Commissure of the Inferior Colliculus, consistently display a strong positive linear effect of age on relative volume (Figure 4). The contrasting grey and white matter age-dependent trends are consistent with literature descriptions of age-dependent paring of unnecessary neurons and an increase in interregional connections10. In addition to a positive effect of age, the Commissure of the Inferior Colliculus also displays a linear and second order age by sex interaction.
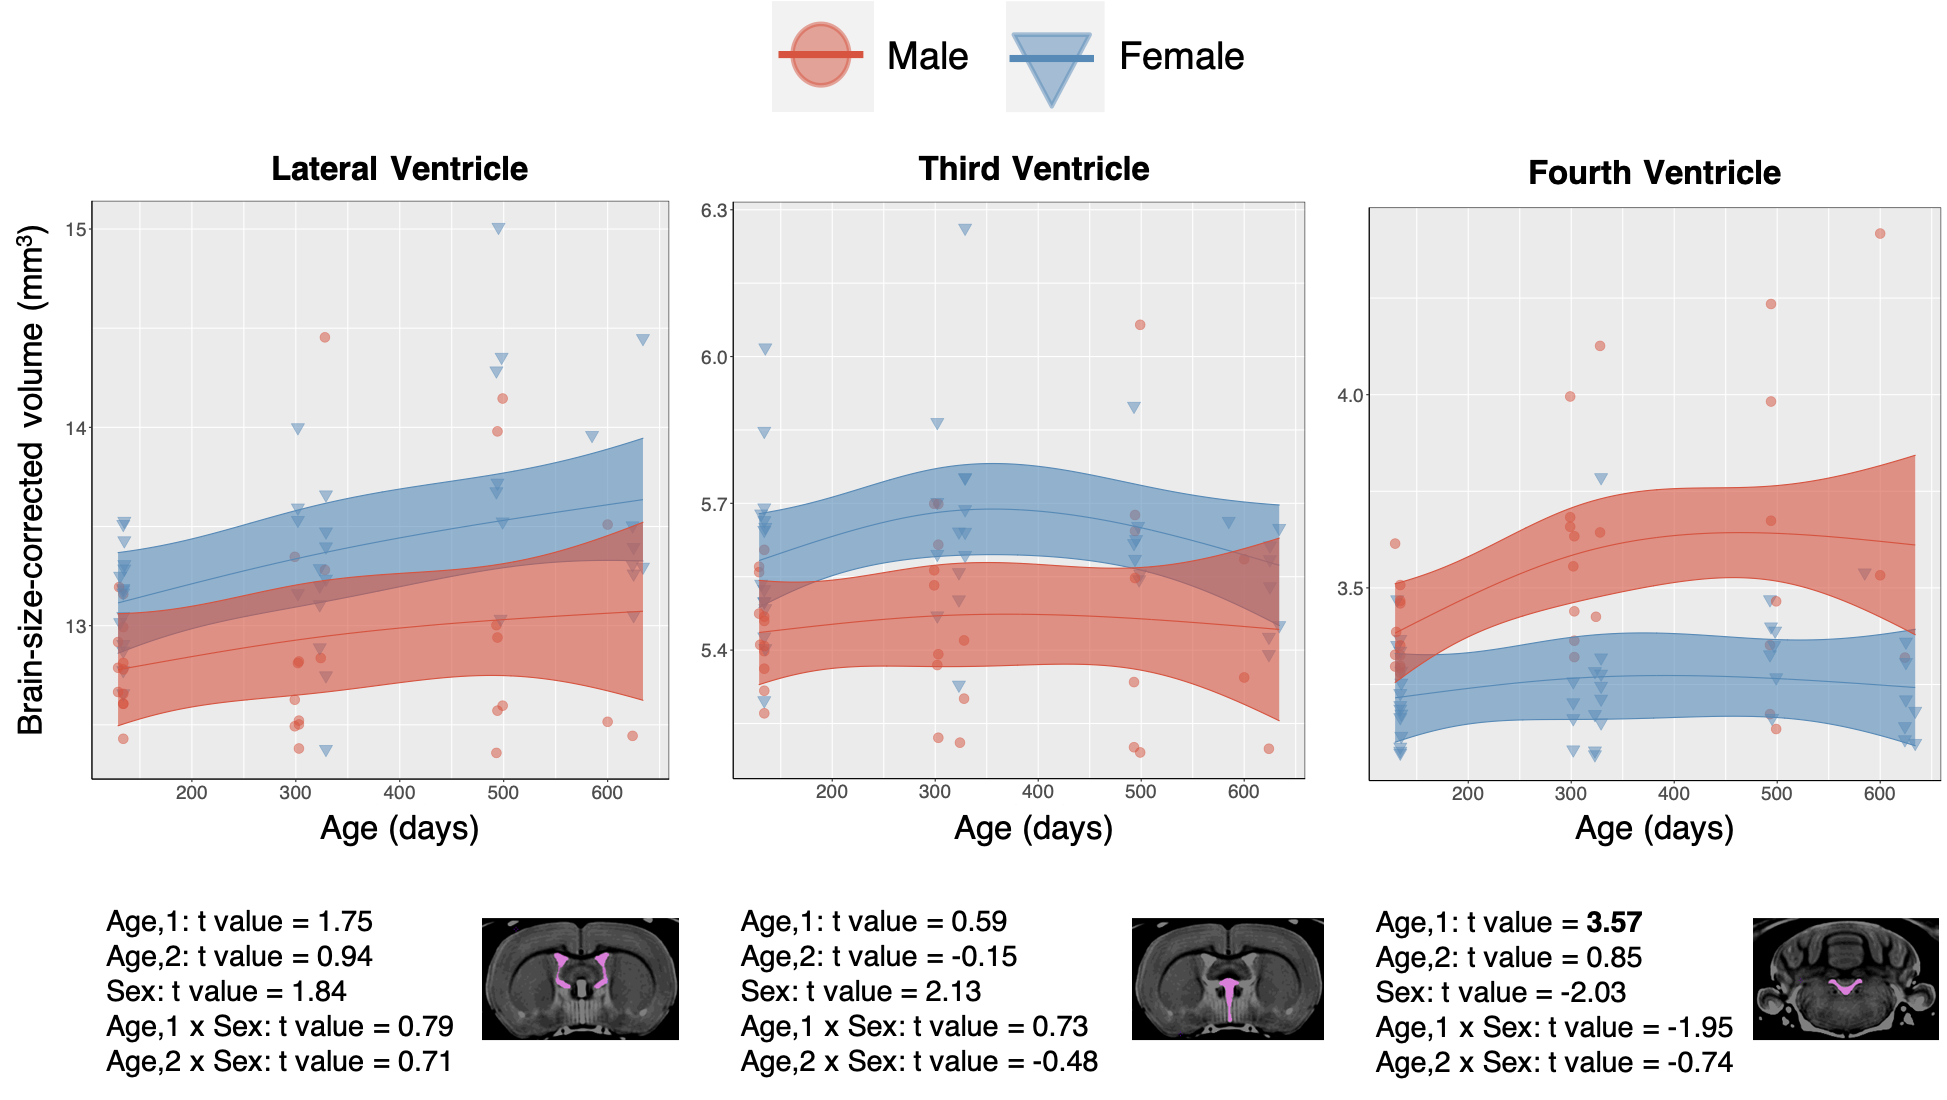
CSF: Structures comprising the CSF do not show consistent or significant trends in volumetric change. There is a slight trend towards increased CSF volume with age as well as increased variability in the data (Figure 5), but these trends are not consistent across regions.
Conclusion
In order to design effective interventions for age-related diseases, it is necessary to understand the biological processes associated with healthy aging. To this end, we present a comprehensive analysis of MRI-derived brain changes during healthy aging in a mixed-sex cohort of 27 Fischer wildtype rats. These findings contribute to our understanding of the neuroanatomical changes associated with healthy aging in both sexes, critical for the proper identification and management of age-related diseases, which frequently present in sexually dimorphic ways.Acknowledgements
This research was supported by the Canadian Institutes of Health Research (PJT-148751) and the Fonds de la Recherche en Santé du Québec (Chercheur boursiers # 0000035275).
C.F.F. is supported in part by funding provided by McGill University’s Faculty of Medicine Internal Studentship.
References
1. Chesky, J. A., & Rockstein, M. (1976). Life span characteristics in the male Fischer rat. Experimental aging research, 2(5), 399-407.
2. Qiu, L. R. et al. Hippocampal volumes differ across the mouse estrous cycle, can change within 24hours, and associate with cognitive strategies. NeuroImage 83, 593–598, https://doi.org/10.1016/j.neuroimage.2013.06.074 (2013).
3. Hamezah, H. S., Durani, L. W., Ibrahim, N. F., Yanagisawa, D., Kato, T., Shiino, A., ... & Tooyama, I. (2017). Volumetric changes in the aging rat brain and its impact on cognitive and locomotor functions. Experimental gerontology, 99, 69-79.
4. Alexander, G. E., Lin, L., Yoshimaru, E. S., Bharadwaj, P. K., Bergfield, K. L., Hoang, L. T., ... & Trouard, T. P. (2020). Age-related regional network covariance of magnetic resonance imaging gray matter in the rat. Frontiers in aging neuroscience, 12, 267.
5. Lau, J. C., Lerch, J. P., Sled, J. G., Henkelman, R. M., Evans, A. C., & Bedell, B. J. (2008). Longitudinal neuroanatomical changes determined by deformation-based morphometry in a mouse model of Alzheimer's disease. Neuroimage, 42(1), 19-27.
6. Avants BB, Tustison NJ, Song G, Cook PA, Klein A, Gee JC. A reproducible evaluation of ANTs similarity metric performance in brain image registration. Neuroimage. 2011 Feb 1;54(3):2033-44. doi: 10.1016/j.neuroimage.2010.09.025. Epub 2010 Sep 17. PMID: 20851191; PMCID: PMC3065962.
7. Goerzen, D., Fowler, C., Devenyi, G.A., Germann J., Madularu D., Chakravarty M.M., & Near J. An MRI-Derived Neuroanatomical Atlas of the Fischer 344 Rat Brain. Sci Rep 10, 6952 (2020). https://doi.org/10.1038/s41598-020-63965-x
8. Friedel, M., van Eede, M. C., Pipitone, J., Chakravarty, M. M. & Lerch, J. P. Pydpiper: a flexible toolkit for constructing novel registration pipelines. Frontiers in Neuroinformatics 8, 67, https://doi.org/10.3389/fninf.2014.00067 (2014).
9. Lerch J, Hammill C, van Eede M, Cassel D (2017). RMINC: Statistical Tools for Medical Imaging NetCDF (MINC) Files. R package version 1.5.2.1, http://mouse-imaging-centre.github.io/RMINC.
10. Semple, B. D., Blomgren, K., Gimlin, K., Ferriero, D. M., & Noble-Haeusslein, L. J. (2013). Brain development in rodents and humans: Identifying benchmarks of maturation and vulnerability to injury across species. Progress in neurobiology, 106-107, 1–16. https://doi.org/10.1016/j.pneurobio.2013.04.001
Figures
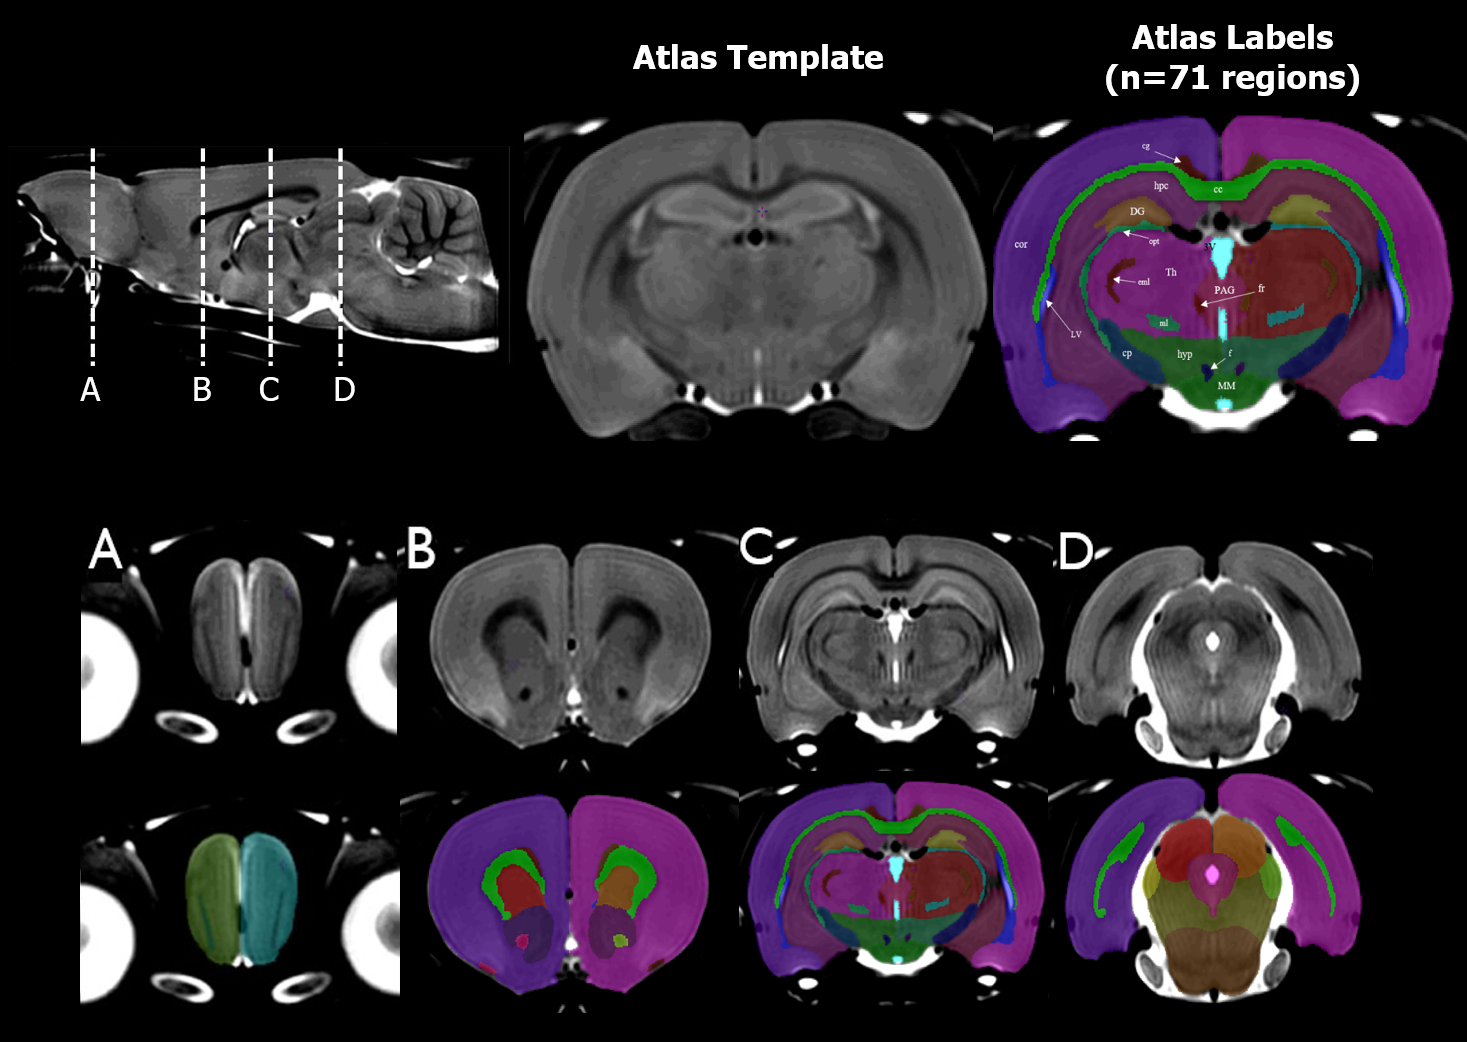
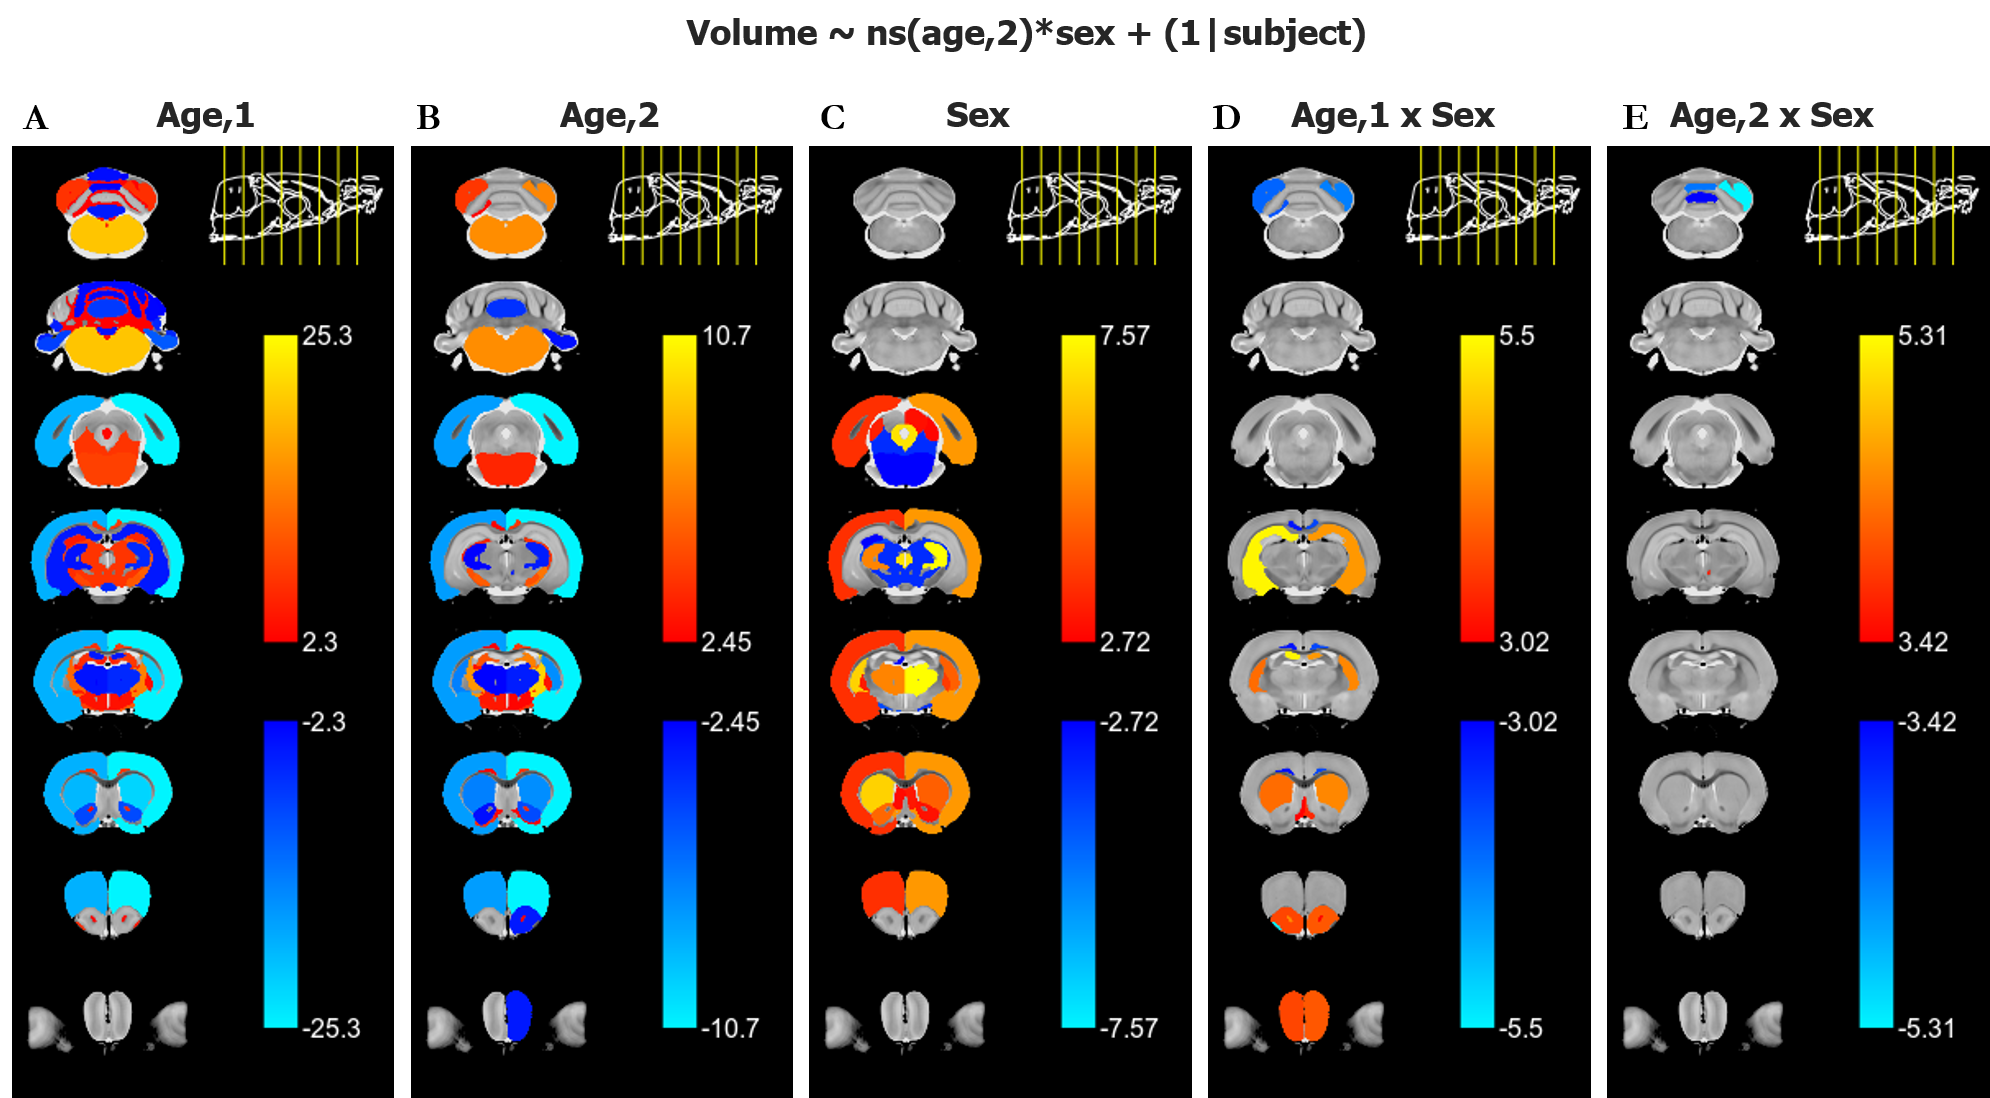
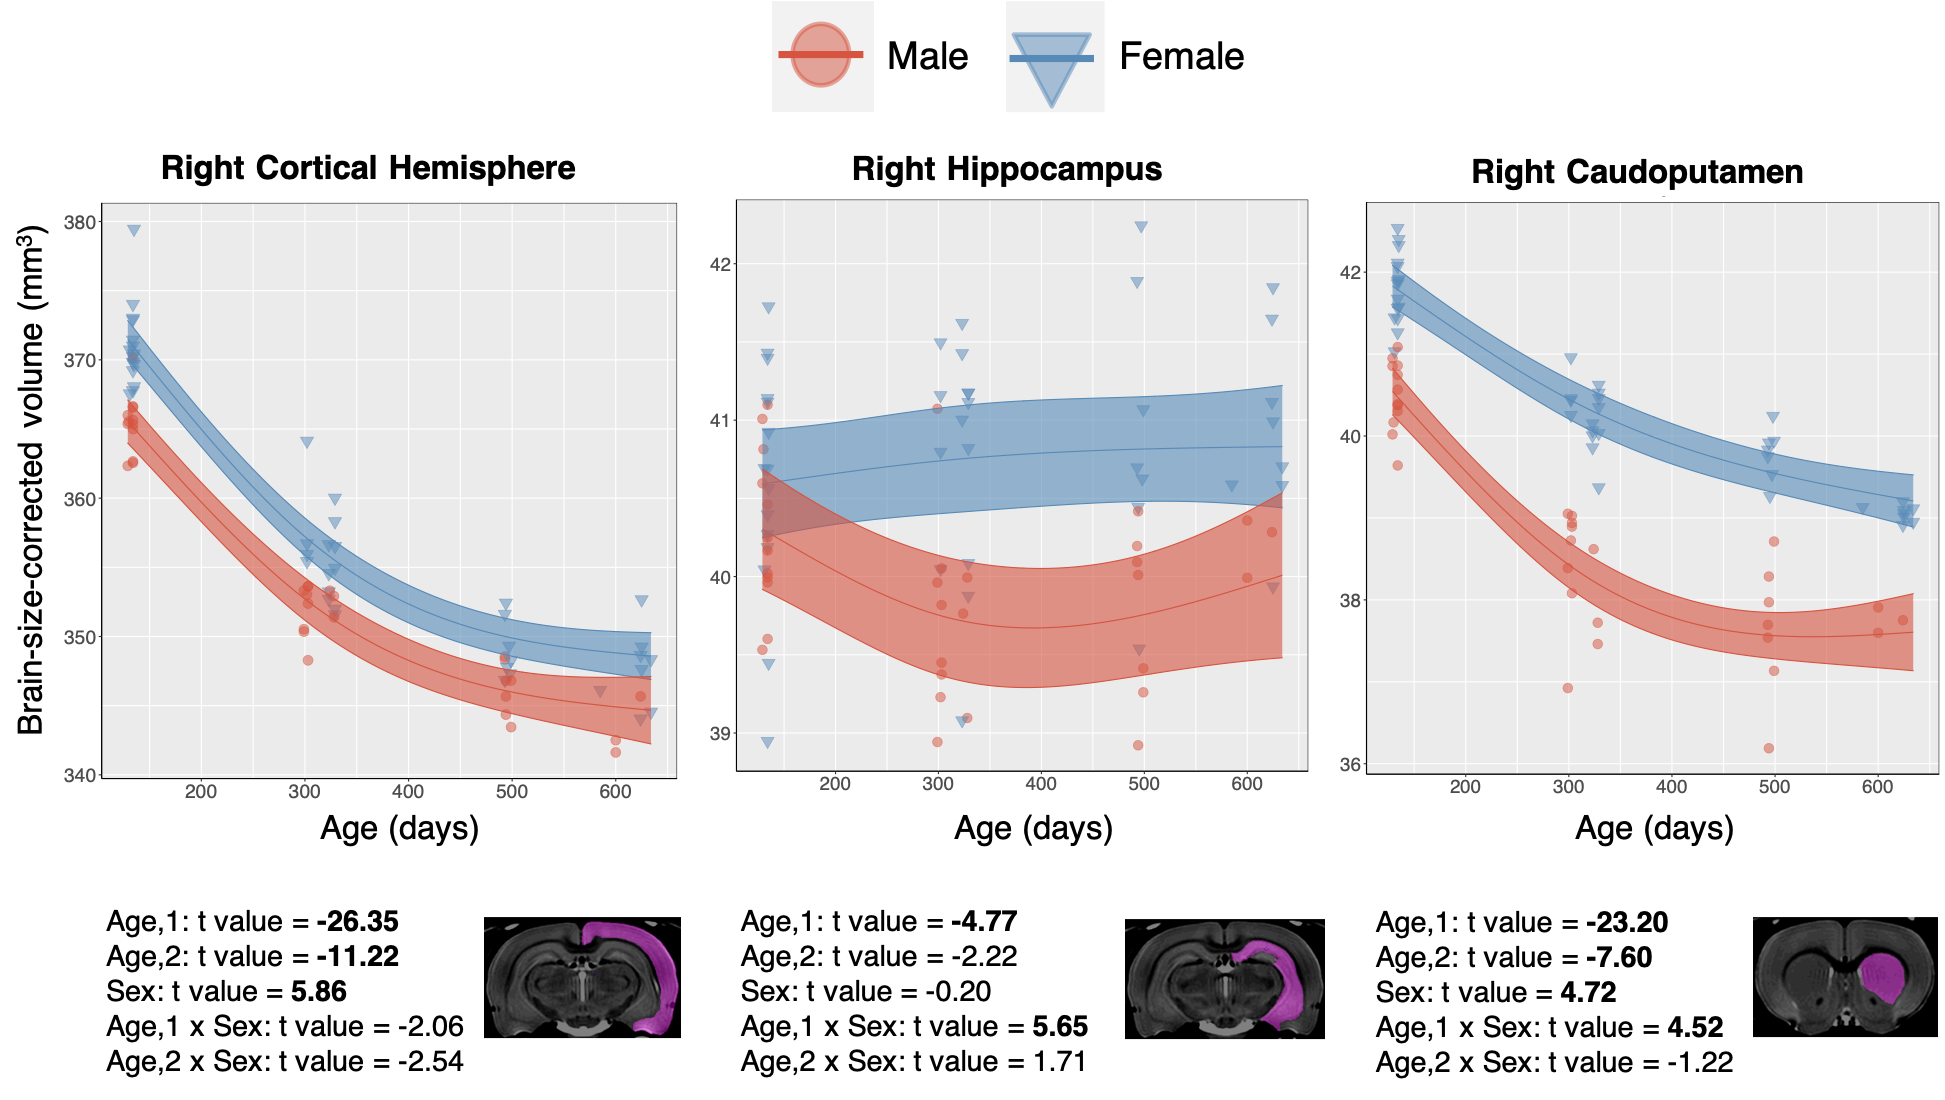
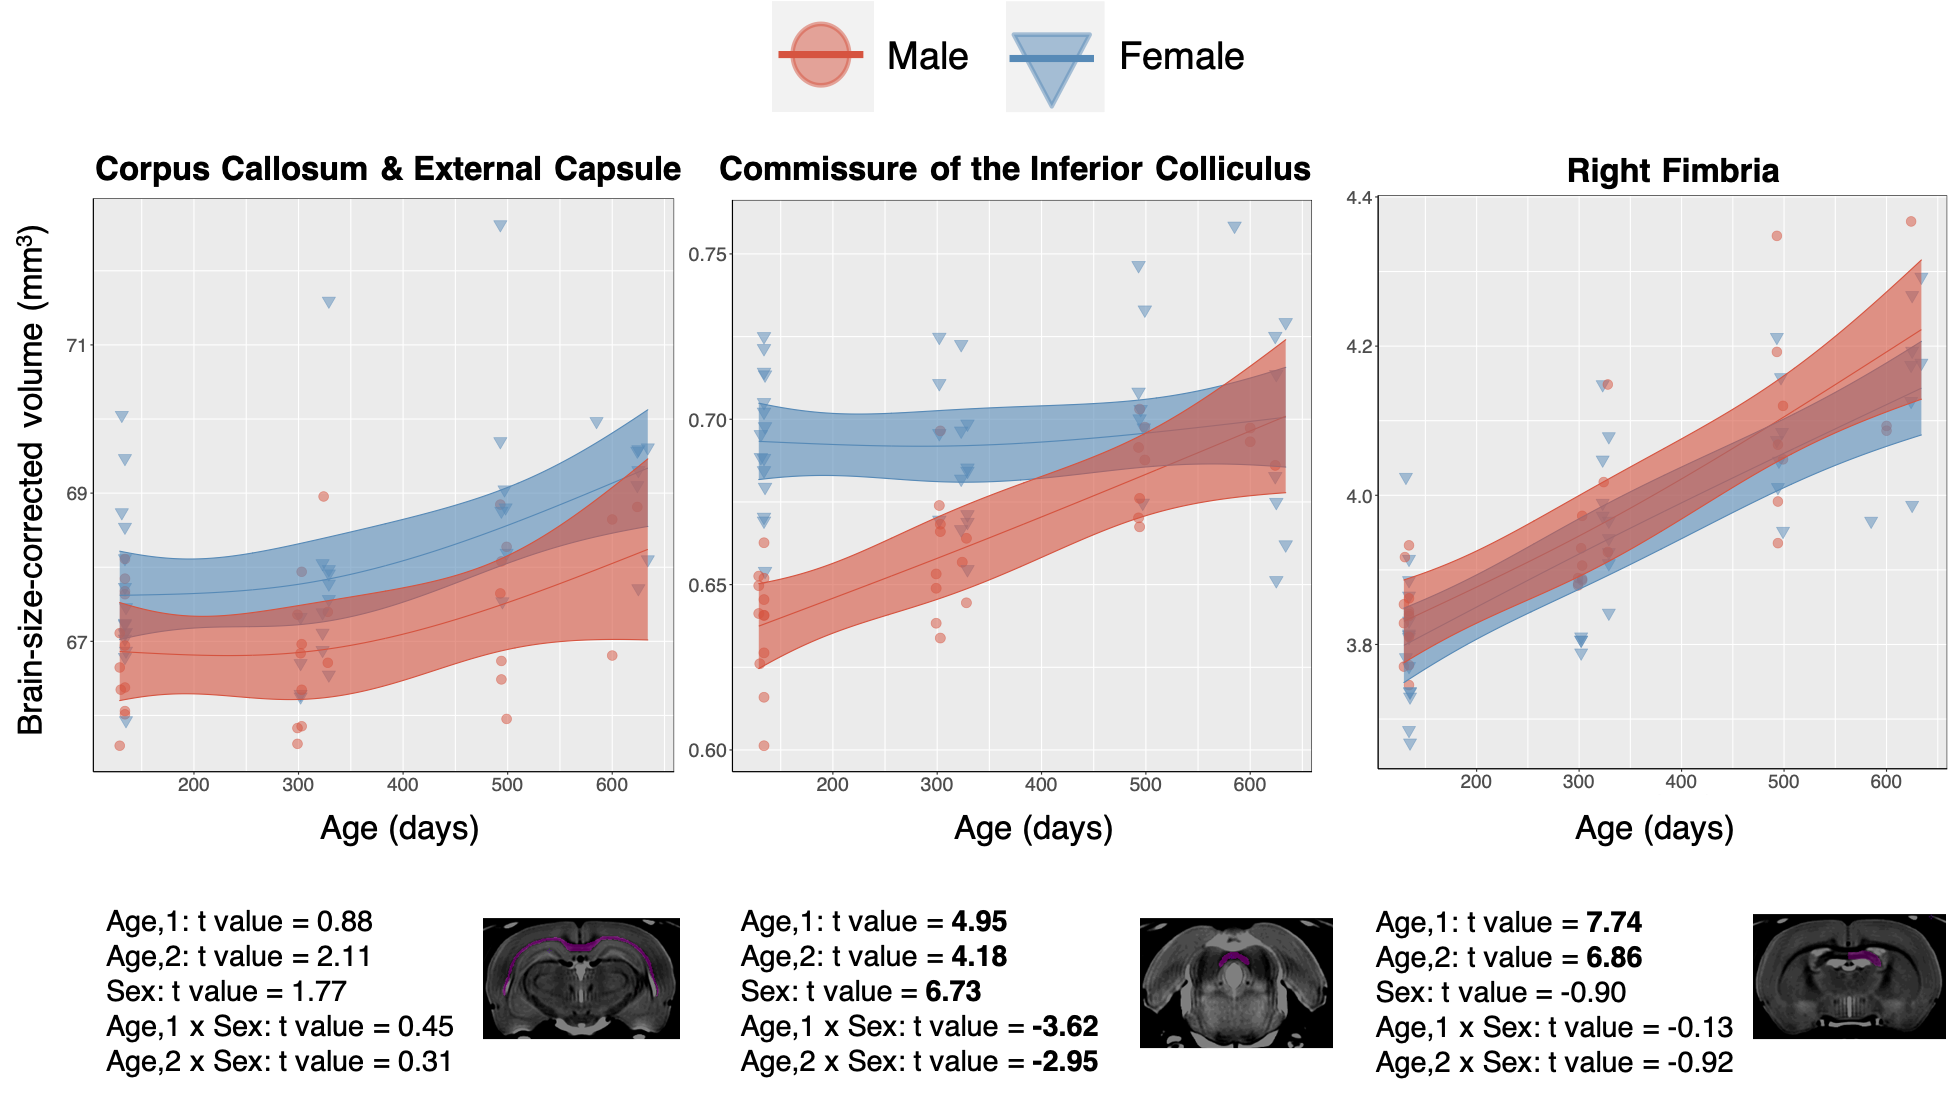
Figure 4. Data from selected white matter regions is shown with individual data points shown and the overall model as with confidence intervals as described in Methods overlaid. T-values for each region and model term are shown on bottom, with significant terms after 5% FDR correction given in bold.