1938
DGE-MRI detects the therapeutic effect of IL-33 in Alzheimer’s mice by assessing cerebral glucose uptake and clearance at 3T1Biomedical Engineering, City University of Hong Kong, Hong Kong, Hong Kong, 2Russell H. Morgan Department of Radiology and Radiological Science, The Johns Hopkins University School of Medicine, Baltimore, MD, United States, 3City University of Hong Kong Shenzhen Research Institute, Shenzhen, China
Synopsis
We have demonstrated that D-glucose kinetics detected by dynamic glucose-enhanced (DGE)-MRI can be used to assess D-glucose uptake and clearance alterations in Alzheimer’s disease (AD) mice at 3T. Interleukin (IL)-33 treatment has been shown to promote Aβ clearance. Here, we applied our established DGE-MRI to detect changes of brain clearance after IL-33 treatment in cerebrospinal fluid (CSF) and brain parenchyma in AD mice. A significant increased D-glucose clearance from CSF, but not brain parenchyma, was observed after treatment. DGE-MRI provides a non-invasive evaluation of IL-33 treatment in AD, and further affirm its potential to assess brain lymphatic system in AD.
Introduction
A reliable prognostic and diagnostic imaging biomarkers are needed to facilitate the evaluation of Alzheimer's disease (AD) treatments. As a brain-wide pathway for fluid transport contributing to the clearance of interstitial solutes, named brain lymphatic system has been proposed.1-3 Within this lymphatic system, β-amyloid (Aβ), a peptide thought to be pathogenic in AD, can be cleared in the cerebrospinal fluid (CSF) through the brain interstitial spaces.4 Glucose can be sensitively detected by CEST MRI.5-8 We and collaborators have recently demonstrated a non-invasive method to assess the CSF and brain parenchyma clearance by dynamic glucose-enhanced (DGE) MRI.9,10 In this study, we used APP/PS1 mice as the AD animal model. DGE-MRI was performed to assess the brain lymphatic system in the AD mice before and after treatment of interleukin IL-33, which showed ability to facilitate the clearance of Aβ in the brain and was believed to have therapeutic effect in AD.11 Studying the clearance of glucose in CSF and brain parenchyma could be an effective approach to examine the function of lymphatic system, which could serve as a potential imaging biomarker.Methods
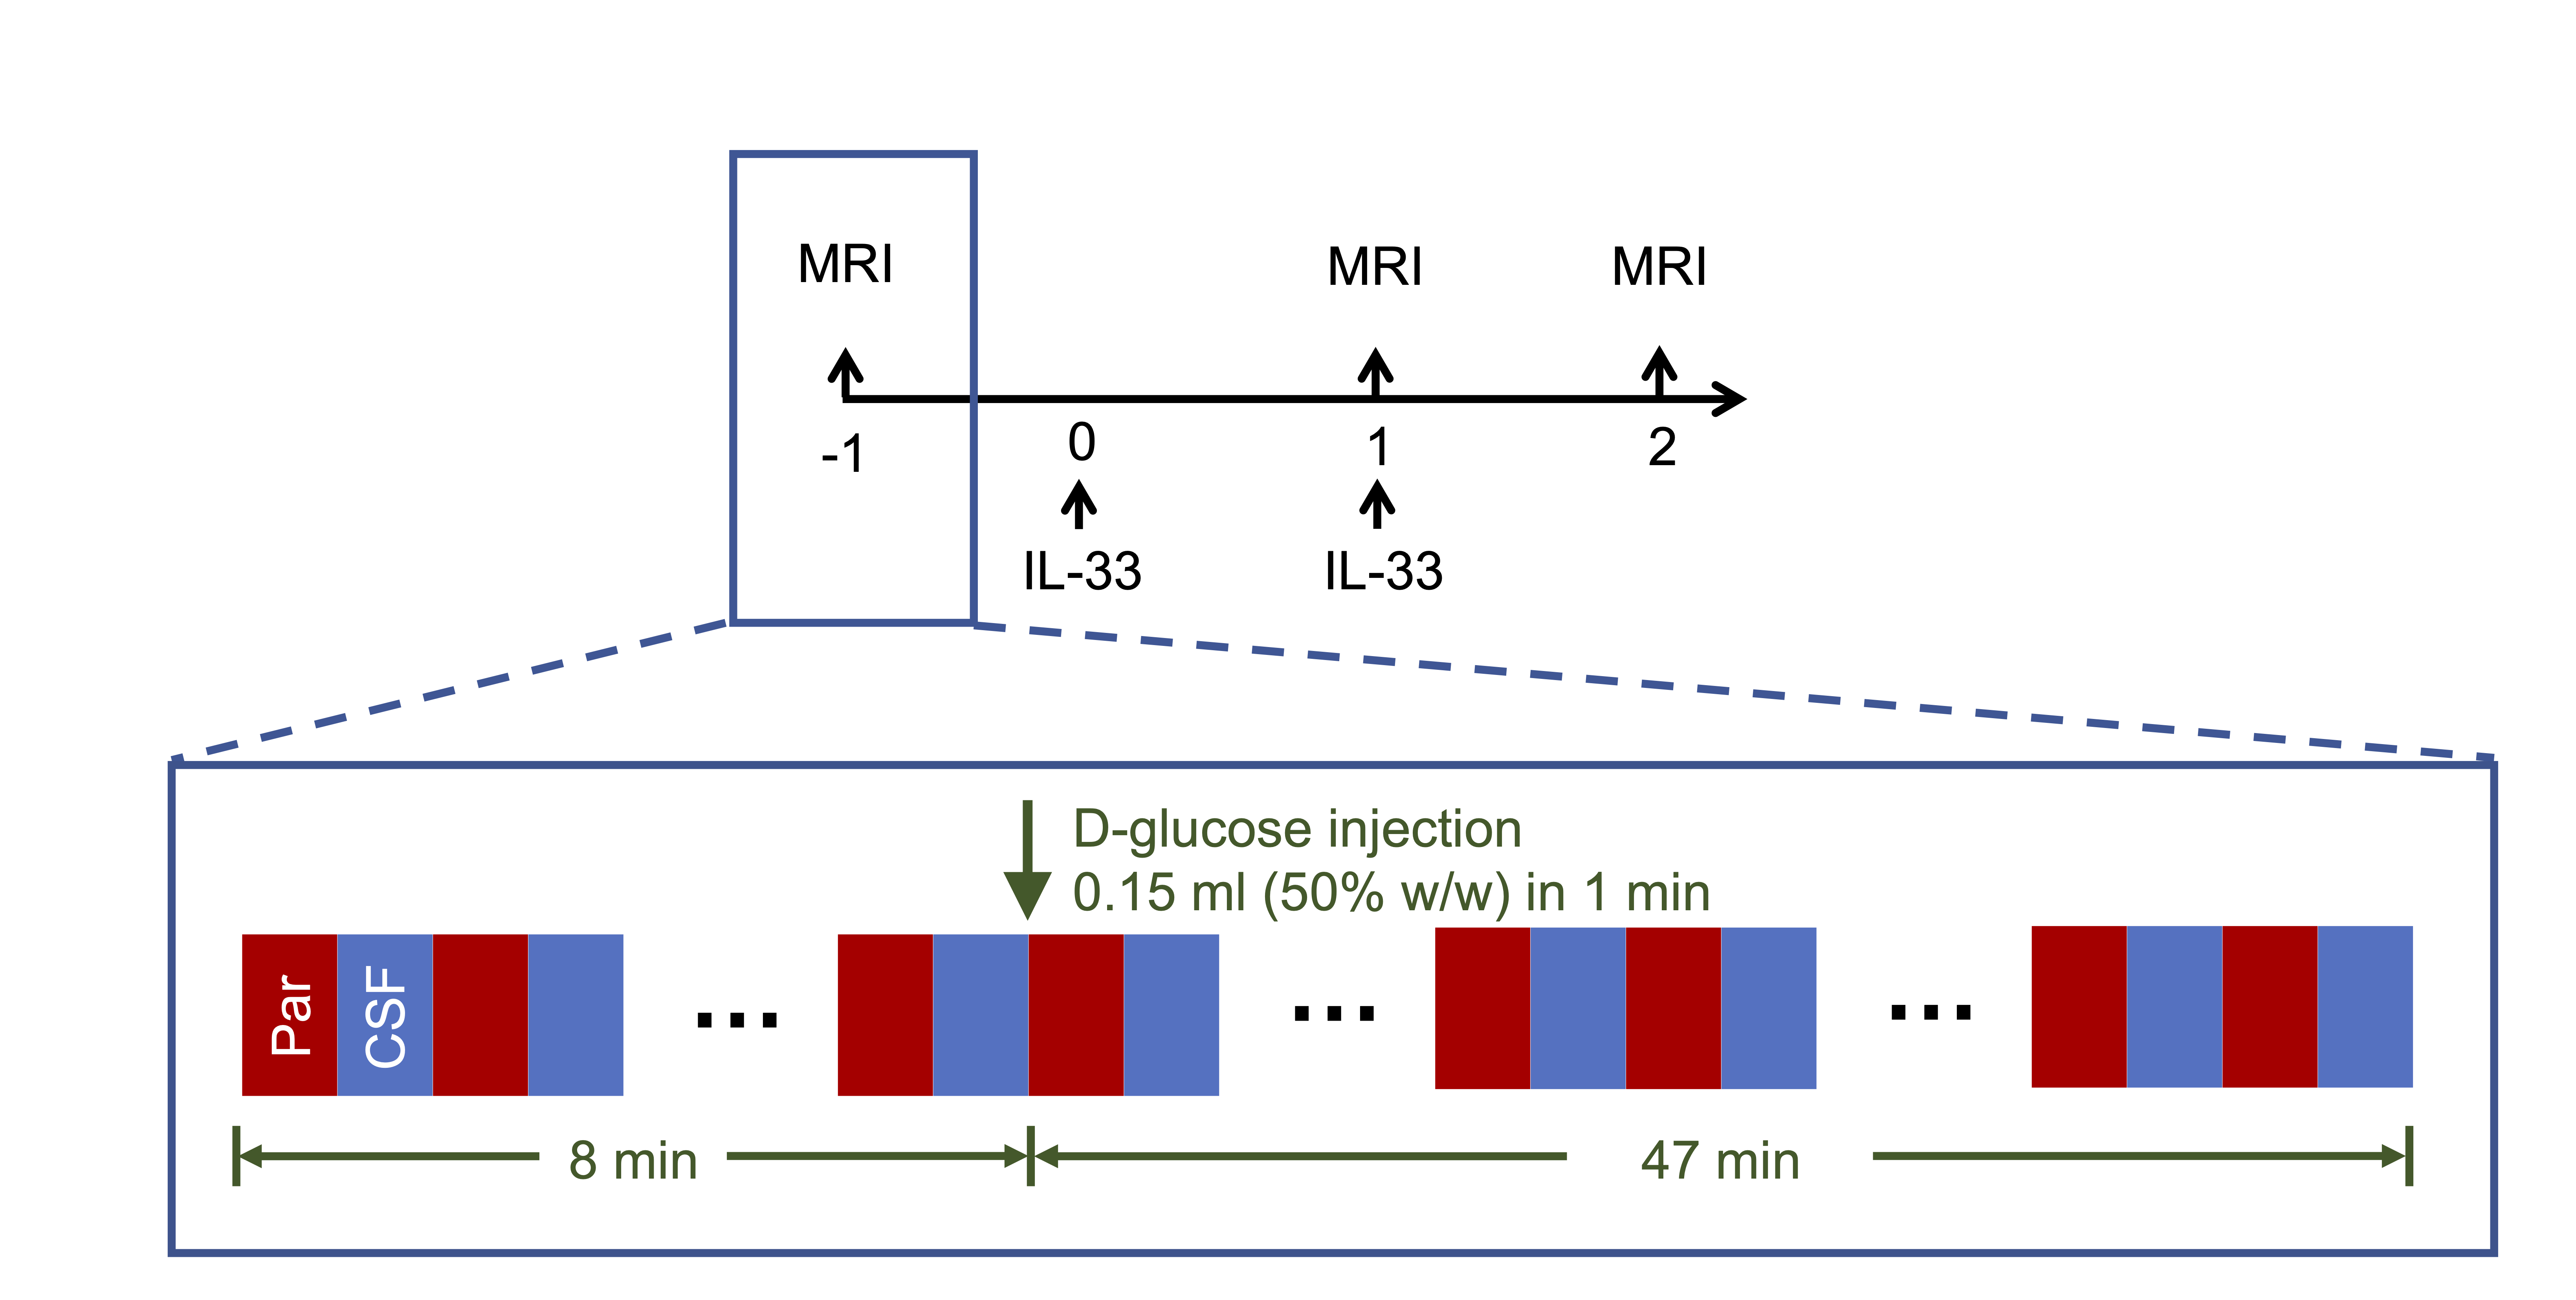
Four APP/PS1 mice (20-29 months old, male, Jackson Laboratory) were used in this study. Mice were injected intraperitoneally with recombinant mouse IL-33 (200 ng/mouse) on day 0 and day 1. MRI experiments were performed pre-treatment, day 1 and day 2 post treatment on a horizontal bore 3T Bruker BioSpec system (Bruker, Germany). DGE-MRI was performed as we reported previously.9 Mice were injected intravenously with 50% D-glucose at 8 min using a MRI-compatible syringe pump and be monitored by MRI for 47 min (Fig. 1). The DGE kinetic curve were constructed as:$$∆S(t)=\frac{S_{base}-S(t)}{S_{base}}$$Results and discussion
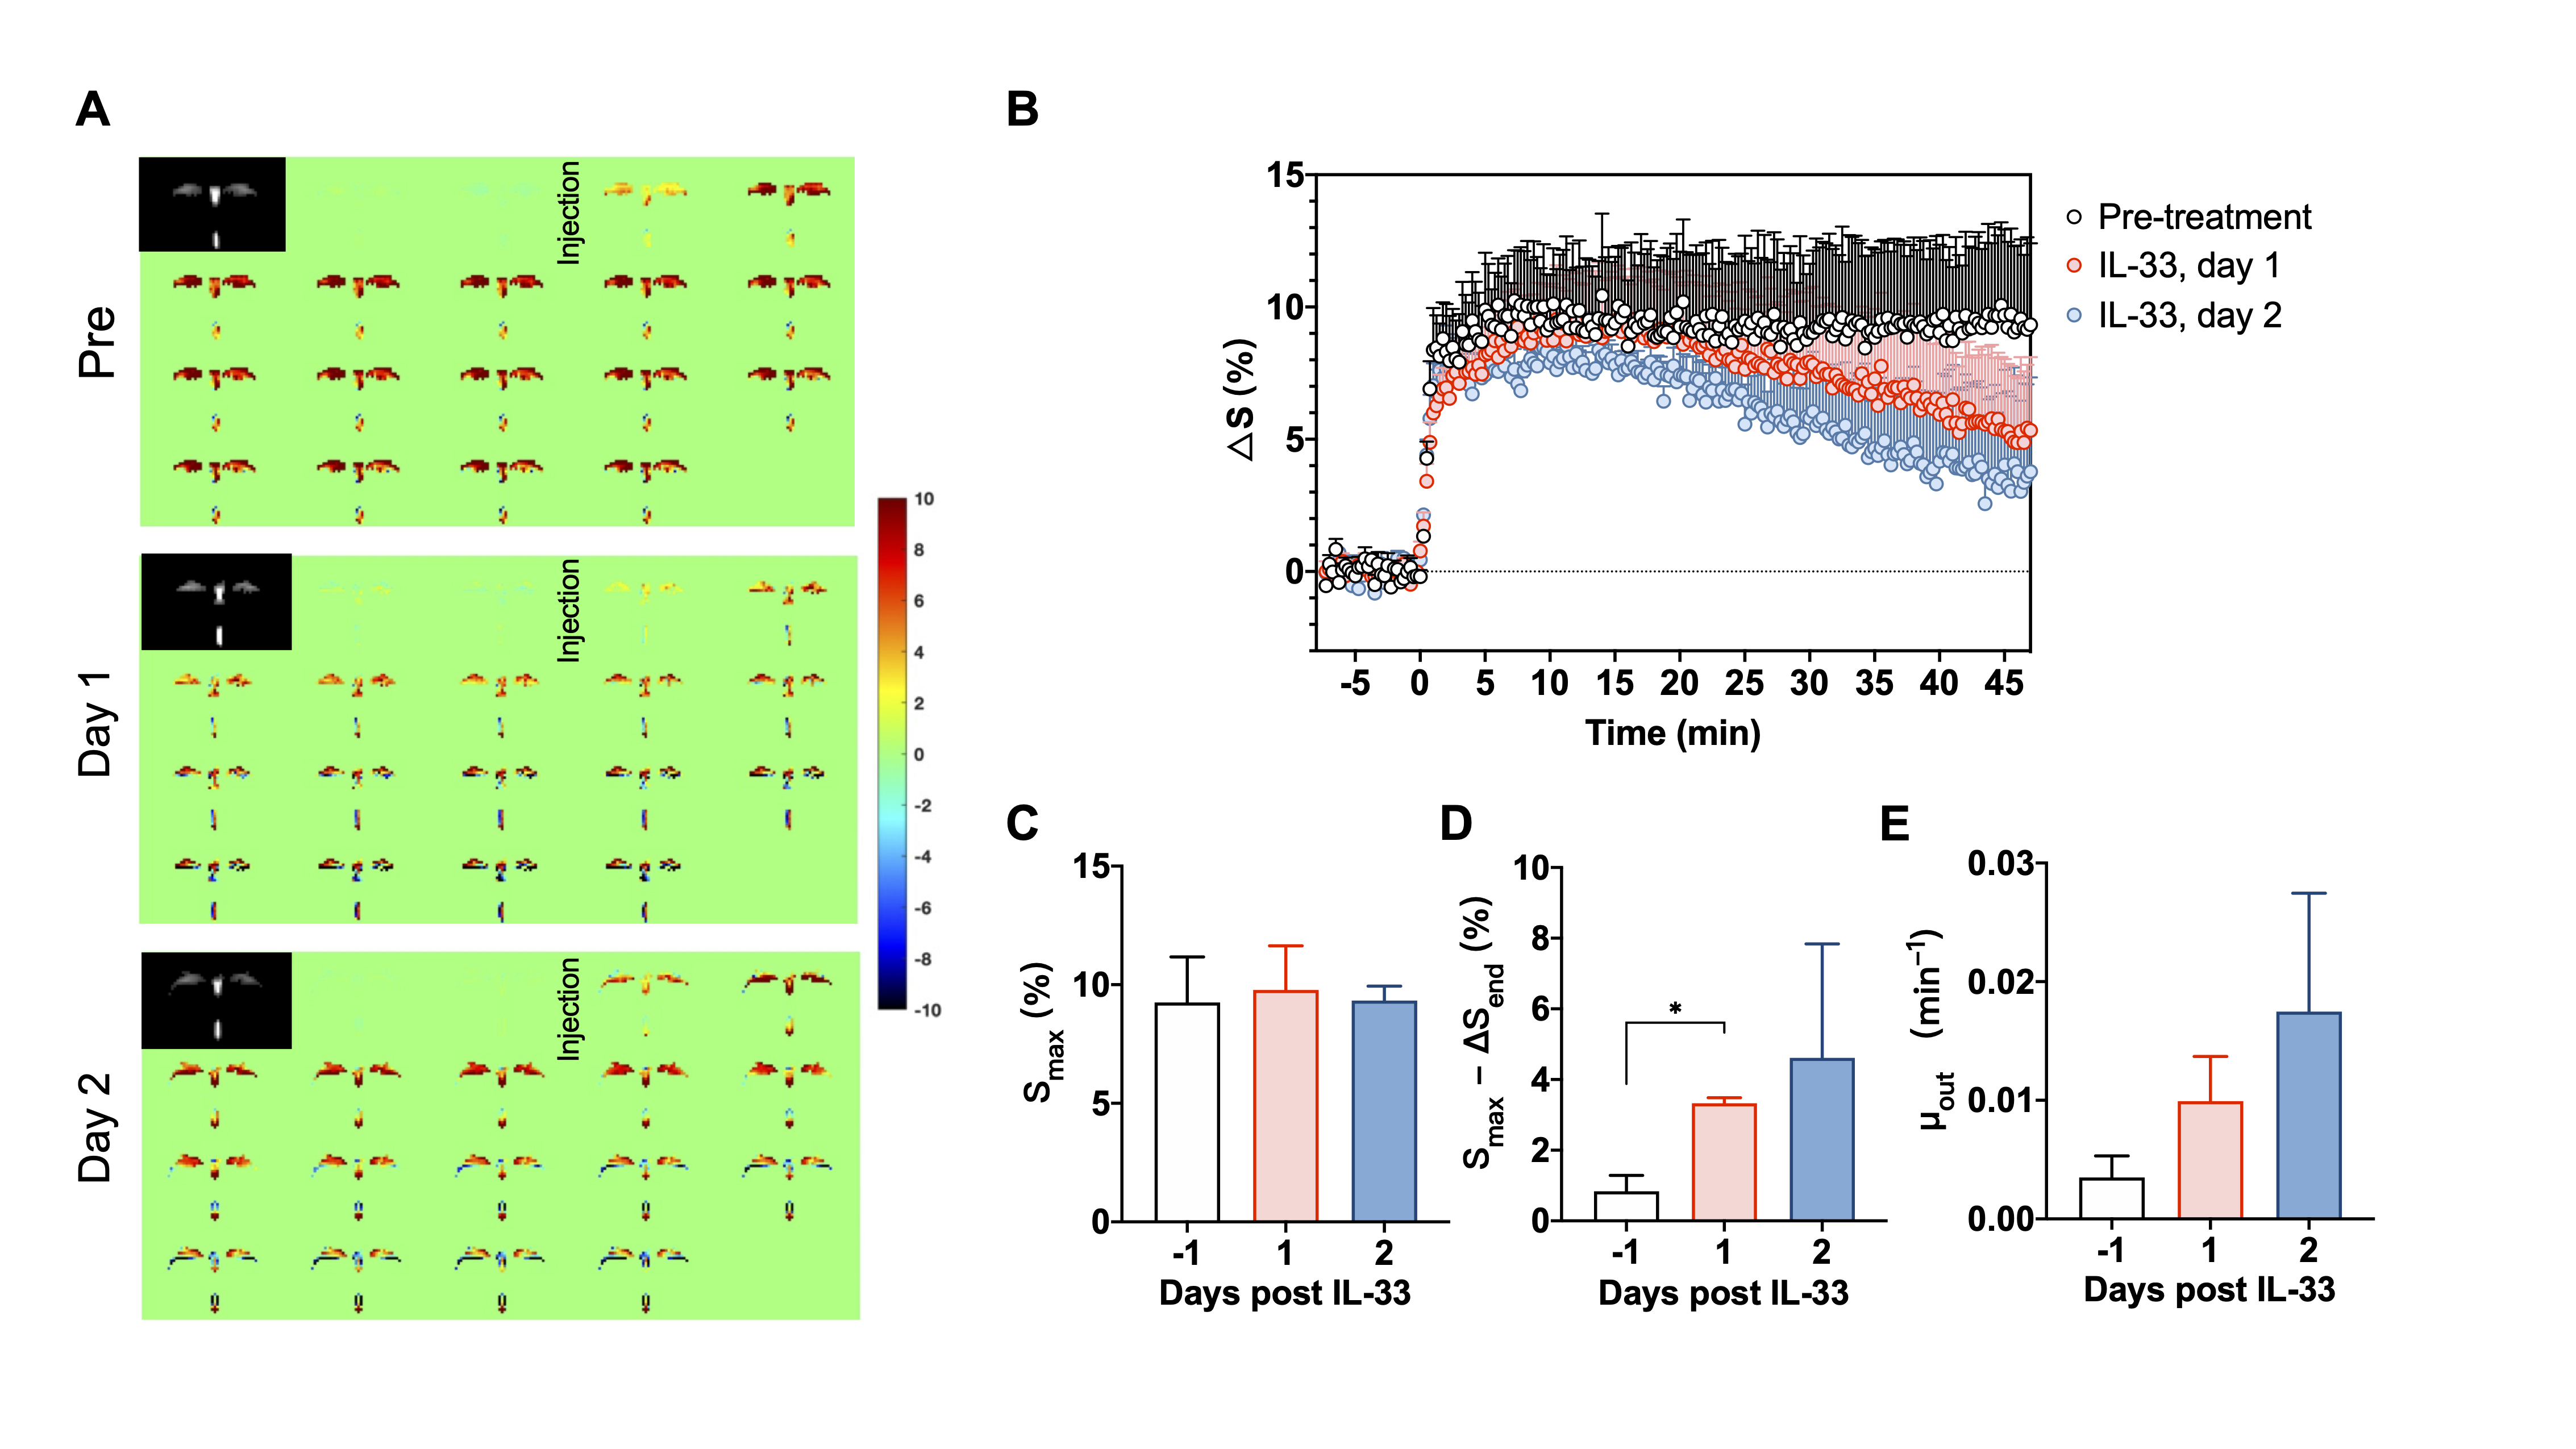
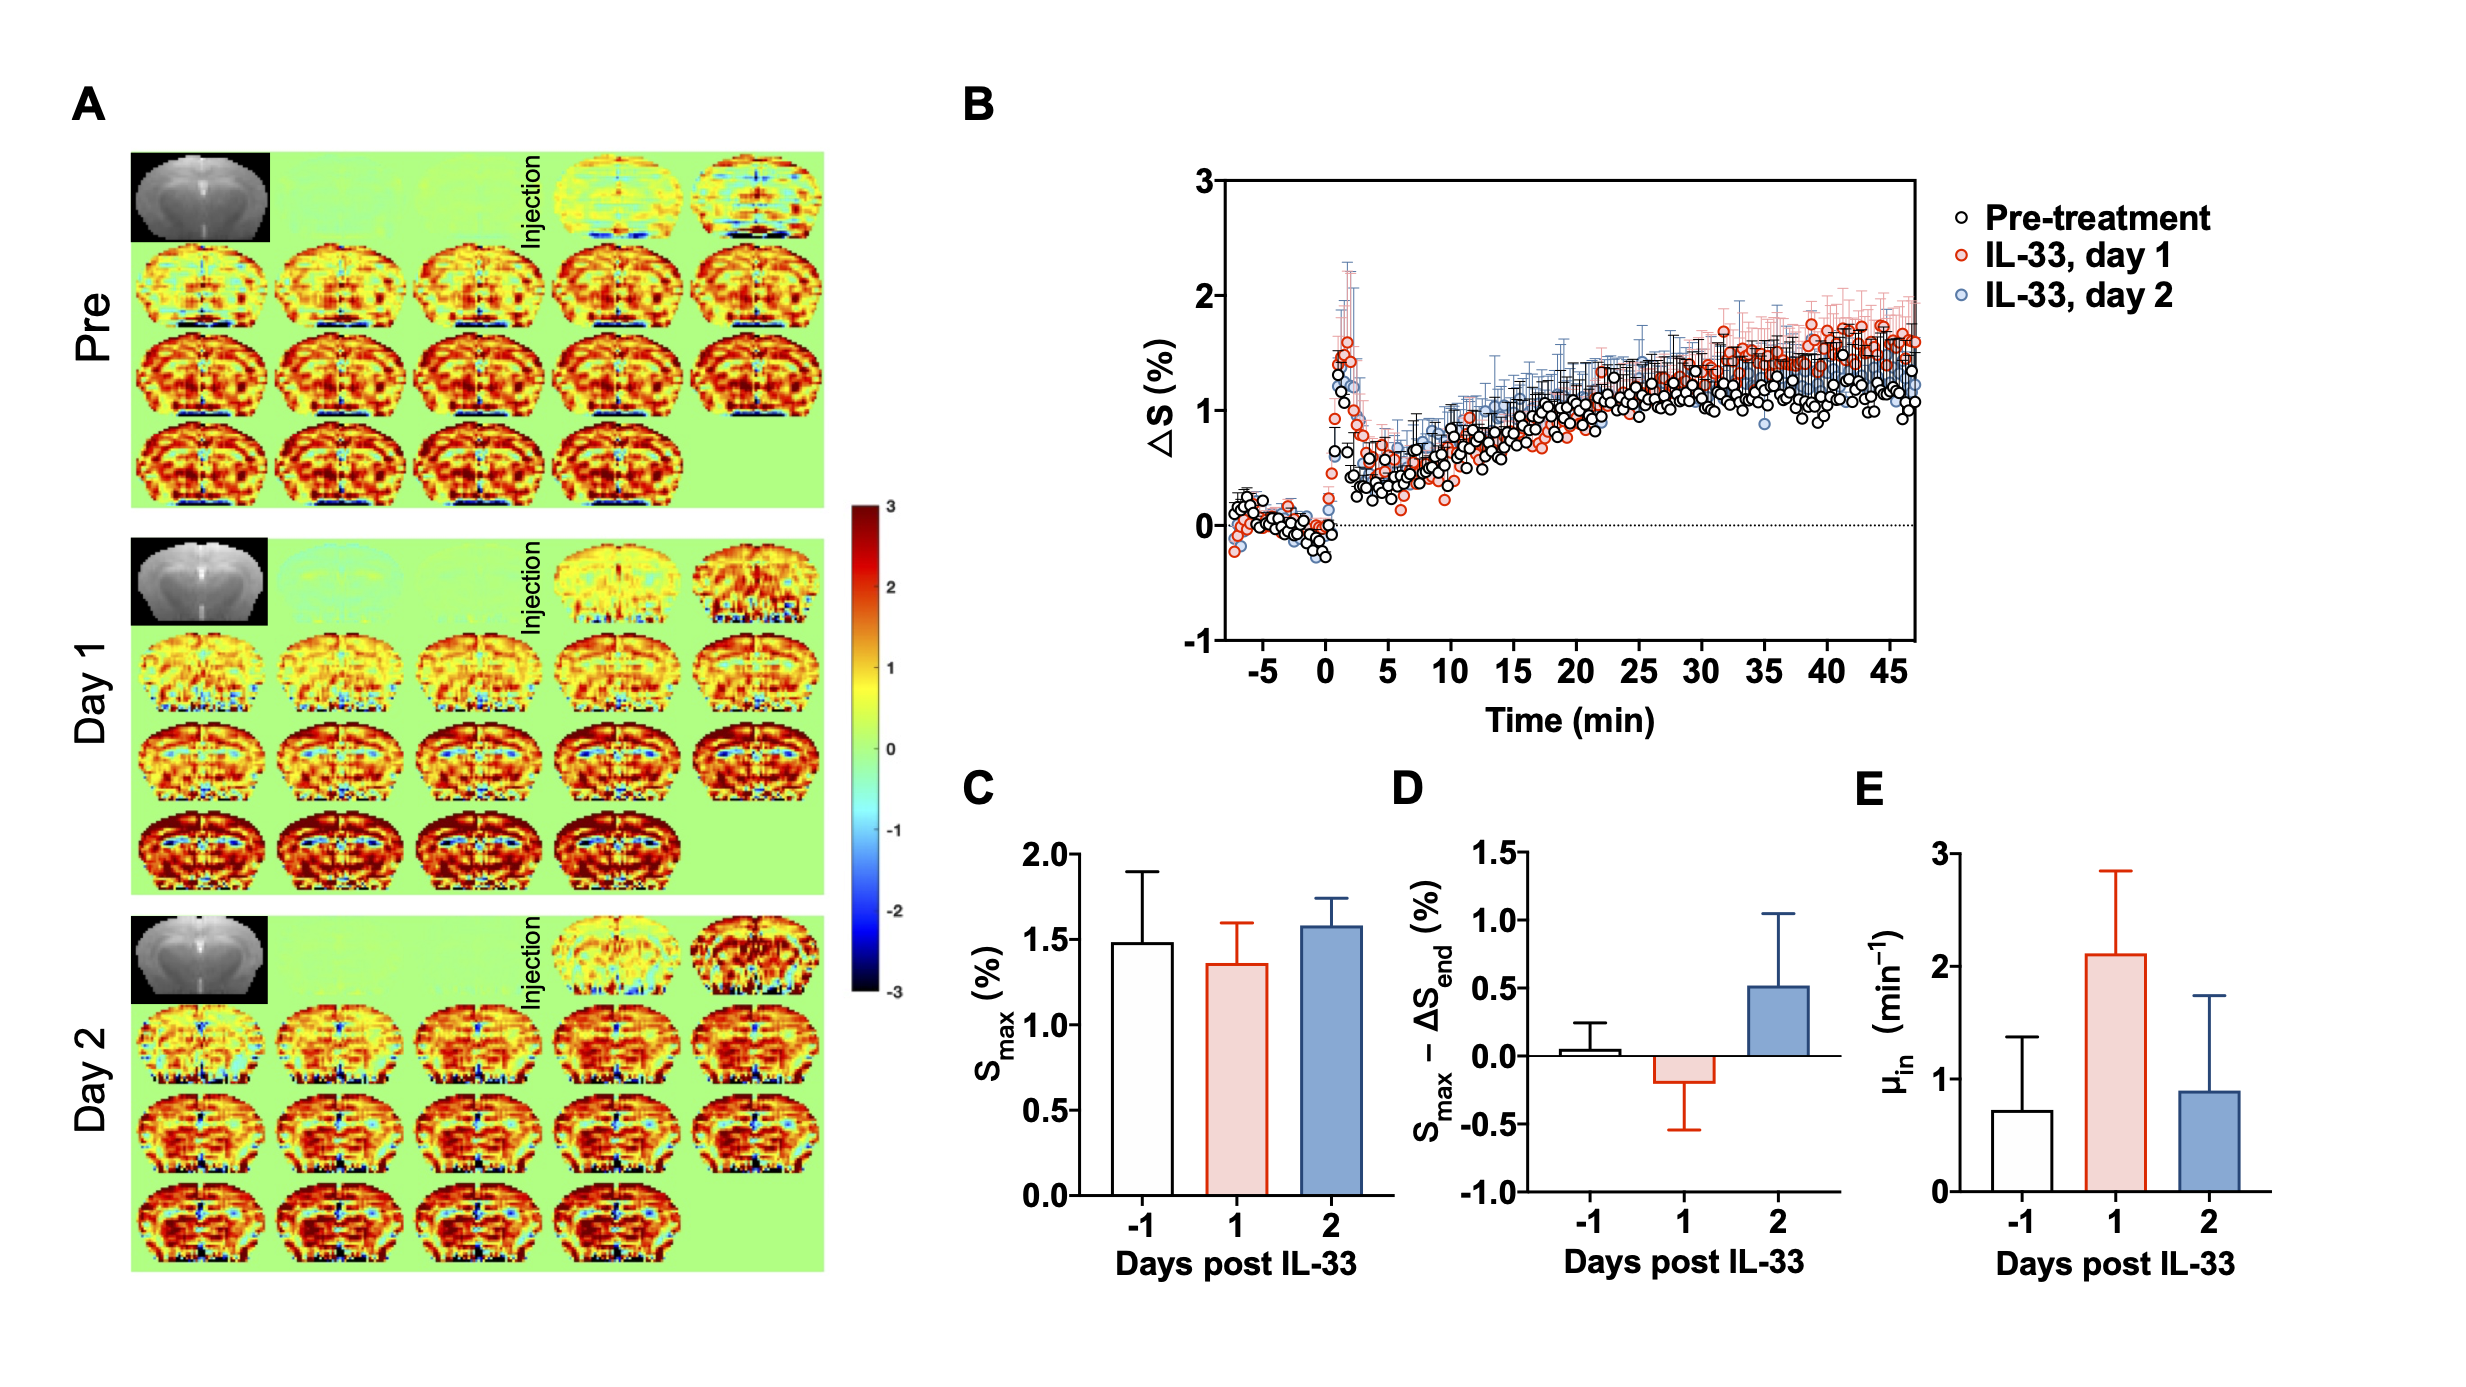
The DGE images and curves for CSF are shown in Fig. 2 (A, B), providing detailed dynamic information about the D-glucose uptake and clearance. In CSF, the D-glucose uptakes were initially comparable in all three groups with similar maximal signal intensity (Smax, pre: 9.25±1.92% vs day 1: 9.78±1.86% vs day 2: 9.33±0.61%, Pday1=0.881, Pday2=0.999 ) (Fig. 2C). Before IL-33 treatment, the DGE signal of 20-29 months old APP/PS1 mice maintained at a high level with minor D-glucose clearance (Fig. 2A and B), which was in line with our previous study in 16 months old AD mice 9. Dramatically, the clearance significantly enhanced after IL-33 treatment, illustrated by the increasing pattern between Smax and ∆Send (Smax-∆Send, pre: 0.84±0.45% vs day 1: 3.33±0.16% vs day 2: 4.61±3.23%, Pday1<0.05, Pday2=0.278) (Fig. 2D). Though the washout rate increase was not significant (μout, pre: 0.0035±0.0018 vs day 1: 0.0099±0.0038 vs day 2: 0.0175±0.0100, Pday1=0.249, Pday2=0.376) (Fig. 2E) , we did observe the trend which would be further validated by more experiments.For brain parenchyma, different from CSF, low DGE signal intensity and minor changes in glucose level could be observed (Fig. 3A and B). D-glucose uptake were comparable between groups (Smax, pre: 1.48±0.41% vs day 1: 1.36±0.23% vs day 2: 1.58±0.16%, Pday1=0.874, Pday2=0.983 ) (Fig. 3C). Also, there is no differences of the uptake rate (μin, pre: 0.73±0.65 vs day 1: 2.12±0.73 vs day 2: 0.90±0.84, Pday1=0.194, Pday2=0.989) and clearance (Smax-∆Send, 0.053±0.19% vs day 1: -0.20±0.34% vs day 2: 0.52±0.53%, Pday1=0.785, Pday2=0.436) before and after IL-33 treatment (Fig. 3D and E).
According to the IL-33 studies, IL-33 plays a key role Aβ clearance in the brain and ameliorates AD-like pathology.11 Our results revealed that glucose clearance in AD mice significantly increased after IL-33 treatment (P<0.05), suggesting that the therapeutic effect of IL-33 in reducing plaques in the brain, an increase in CSF clearance could play a role.
Conclusion
Our DGE-MRI approach in assessing glucose clearance in CSF in AD mice can reflect the functioning of brain lymphatic system as demonstrated after IL-33 treatment, implying therapies that could improve lymphatic clearance could be effectively monitored using our DGE readouts. Thus, this approach has the potential to serve as a diagnostic tool for AD and related treatments.Acknowledgements
Research Grants Council: 11102218; City University of Hong Kong: 7005210, 9680247, 9667198 and 6000660; National Natural Science Foundation of China: 81871409.
References
- Iliff JJ, Wang M, Liao Y, et al. A paravascular pathway facilitates CSF flow through the brain parenchyma and the clearance of interstitial solutes, including amyloid β. Sci Transl Med. 2012;4(147):147ra111.
- Iliff JJ, Lee H, Yu M, et al. Brain-wide pathway for waste clearance captured by contrast-enhanced MRI. J Clin Invest. 2013;123(3):1299-1309.
- Louveau A, Smirnov I, Keyes TJ, et al. Structural and functional features of central nervous system lymphatic vessels [published correction appears in Nature. 2016 May 12;533(7602):278]. Nature. 2015;523(7560):337-341.
- Rasmussen MK, Mestre H, Nedergaard M. The glymphatic pathway in neurological disorders. Lancet Neurol. 2018;17(11):1016-1024.
- Chan KW, McMahon MT, Kato Y, et al. Natural D-glucose as a biodegradable MRI contrast agent for detecting cancer. Magn Reson Med. 2012;68(6):1764-1773.
- Walker-Samuel S, Ramasawmy R, Torrealdea F, et al. In vivo imaging of glucose uptake and metabolism in tumors. Nat Med. 2013;19(8):1067-1072.
- Xu X, Xu J, Chan KWY, et al. GlucoCEST imaging with on-resonance variable delay multiple pulse (onVDMP) MRI. Magn Reson Med. 2019;81(1):47-56.
- Xu X, Sehgal AA, Yadav NN, et al. d-glucose weighted chemical exchange saturation transfer (glucoCEST)-based dynamic glucose enhanced (DGE) MRI at 3T: early experience in healthy volunteers and brain tumor patients. Magn Reson Med. 2020;84(1):247-262.
- Huang J, van Zijl PCM, Han X, et al. Altered d-glucose in brain parenchyma and cerebrospinal fluid of early Alzheimer's disease detected by dynamic glucose-enhanced MRI. Sci Adv. 2020;6(20):eaba3884. Published 2020 May 13.
- Chen L, Wei Z, Chan KW, et al. D-Glucose uptake and clearance in the tauopathy Alzheimer's disease mouse brain detected by on-resonance variable delay multiple pulse MRI [published online ahead of print, 2020 Jul 16]. J Cereb Blood Flow Metab. 2020;271678X20941264.
- Fu AK, Hung KW, Yuen MY, et al. IL-33 ameliorates Alzheimer's disease-like pathology and cognitive decline. Proc Natl Acad Sci U S A. 2016;113(19):E2705-E2713.
Figures