1937
Does basal forebrain volume reduction in MRI indicate cholinergic degeneration? A validation study in mouse model of Alzheimer’s Disease1QBI/SBMS, The University of Queensland, Brisbane, Australia, 2SBMS/QBI, The University of Queensland, Brisbane, Australia, 3SBMS, The University of Queensland, Brisbane, Australia, 4QBI/CAI, The University of Queensland, Brisbane, Australia
Synopsis
3xTg mouse model of AD have smaller basal forebrain volume measured by MRI
MRI-detected volume changes do not correlate with cholinergic neurons
Introduction
It has been well established that Alzheimer's disease (AD) is associated with cell loss of the cholinergic basal forebrain nuclei in early clinical stages1,2. The animal studies also revealed a reduction in choline acetyltransferase positive cells in the basal forebrain of the aged AD mouse models 3. MRI-based volumetric and morphometric studies have shown a consistent pattern of cholinergic basal forebrain atrophy in AD 4 and prodromal at-risk stages of AD, such as amnestic mild cognitive impairment (MCI) 5 or individuals with amyloid positive MCI 6. Based on these findings, basal forebrain volume has the potential to predict a cognitive change in patients with AD or prodromal AD. However, MRI volume measure is not specific to cholinergic neurons. It is not clear how the MRI reading is correlated with cholinergic neurons, neither is known whether MRI-detected volume decrease indicates cholinergic degeneration. In this study, we assessed the association of basal forebrain volumes with cholinergic neuron number to determine whether and to what extent the MRI readout is related to cholinergic neuron number.Methods
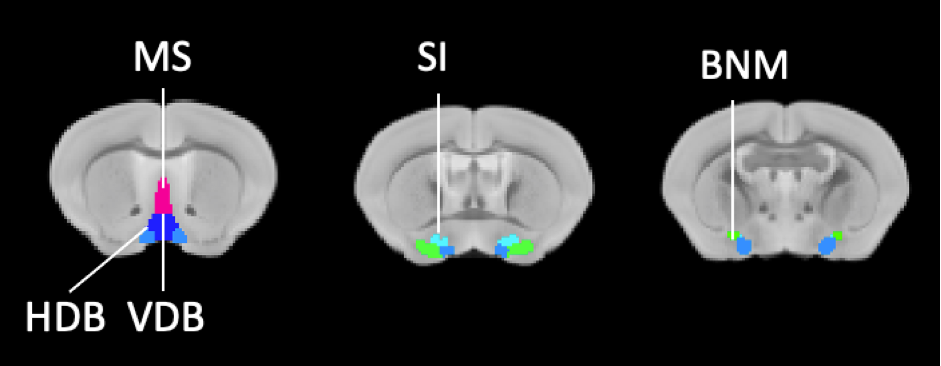
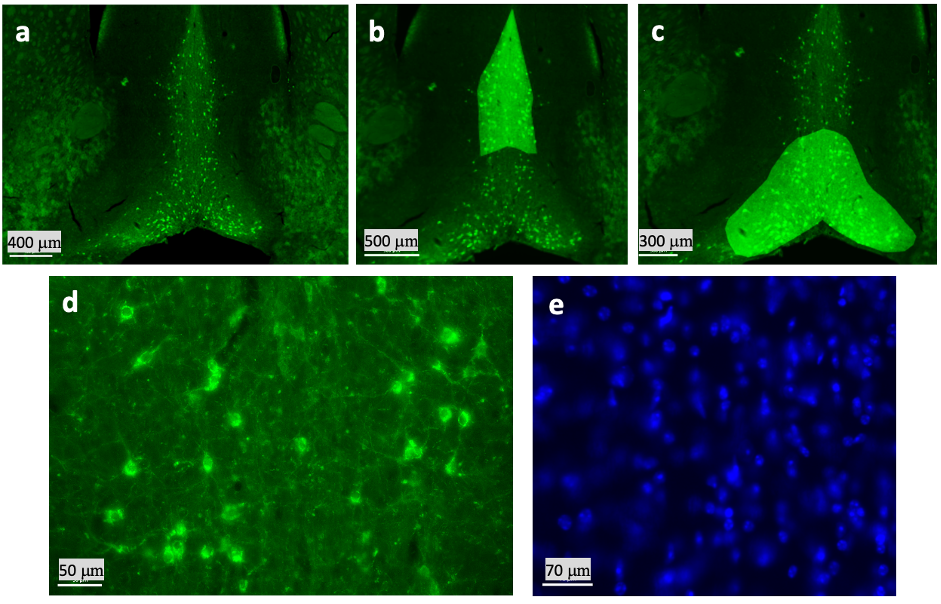
The study was approved by the animal ethics committee of the University of Queensland. C57BL/6 mice (N = 7, female, age = 14-month-old) and triple transgenic (3xTg-AD) mice (N = 10, female, age = 14-month-old) mice were sedated under 0.1mg/kg/h medetomidine and 0.25-0.5% isoflurane anesthesia for MRI. MRI was conducted on a 9.4T preclinical scanner (Bruker BioSpin MRI GmbH, Ettlingen, Germany). Structural MRI of 0.1x0.1x0.3 mm3 resolution was acquired using a fast spin-echo with TR/TE = 5500/40 ms with five averages. The total acquisition time was 10 minutes 18 seconds. Tensor-based morphometry (TBM) was processed with Matlab and FSL (v5.0.11, https://www.fmrib.ox.ac.uk/fsl) by coregistering to the AMBMC template (https://imaging.org.au/AMBMC/AMBMC). Basal forebrain nuclei volumes were derived based on AMBMC atlas (Fig.1). They were also manually measured based on the Paxinos atlas in the native space. Brains were harvested and serial brain coronal sections were cut at a thickness of 40 mm and placed in a six-series configuration. All sections were placed in PBS, washed, and stored at 4°C in PBS + 0.01% sodium azide until used. Brain tissue sections were processed and labeled for the detection of P75 and DAPI. The differences in volume were compared using two-sample t-tests. A p-value<0.05 was considered significant. Multiple test comparisons of ROIs were accounted for with false discovery rate (FDR) corrections with q value<0.05. All the values are represented by mean ± SEMResults
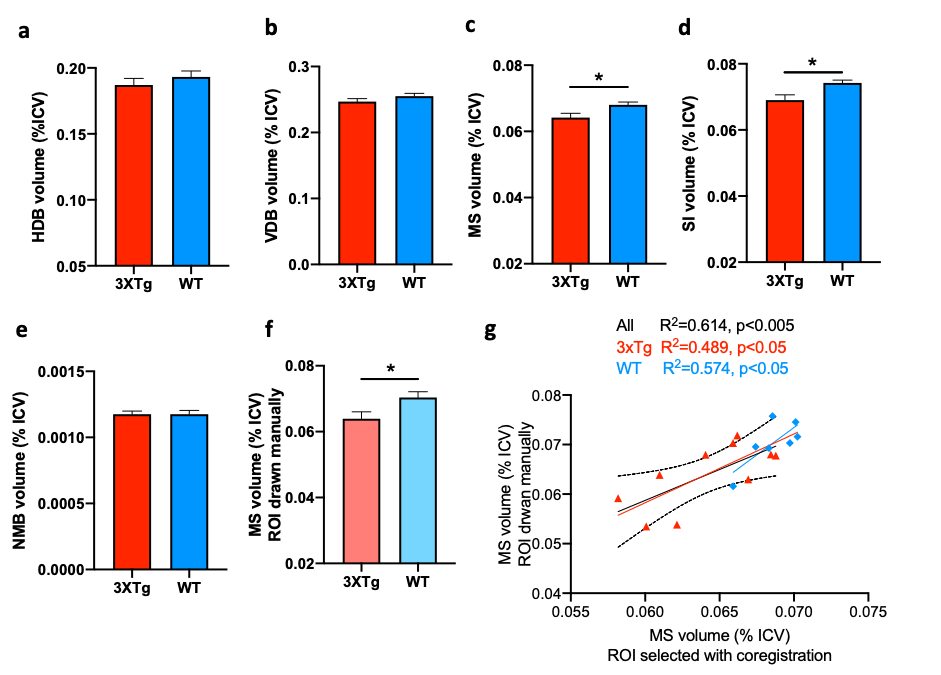
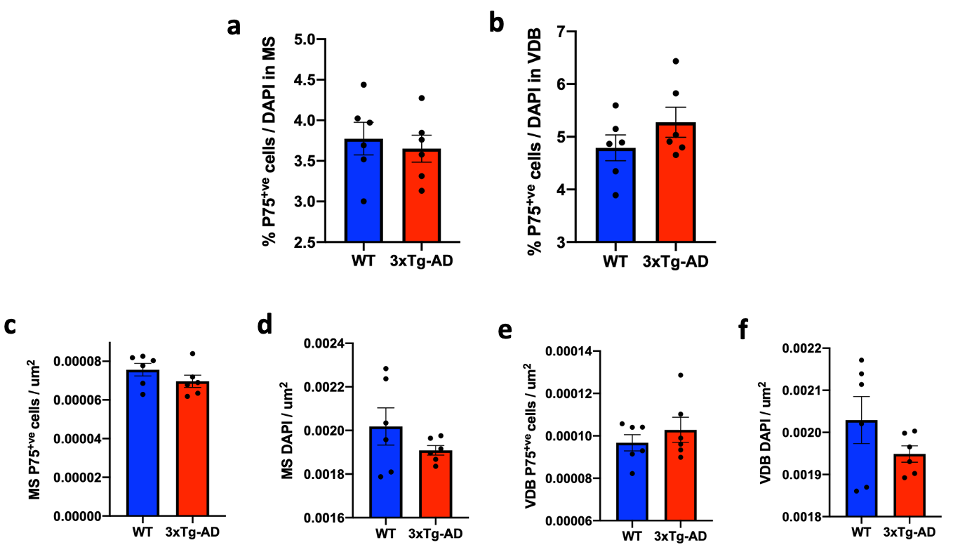
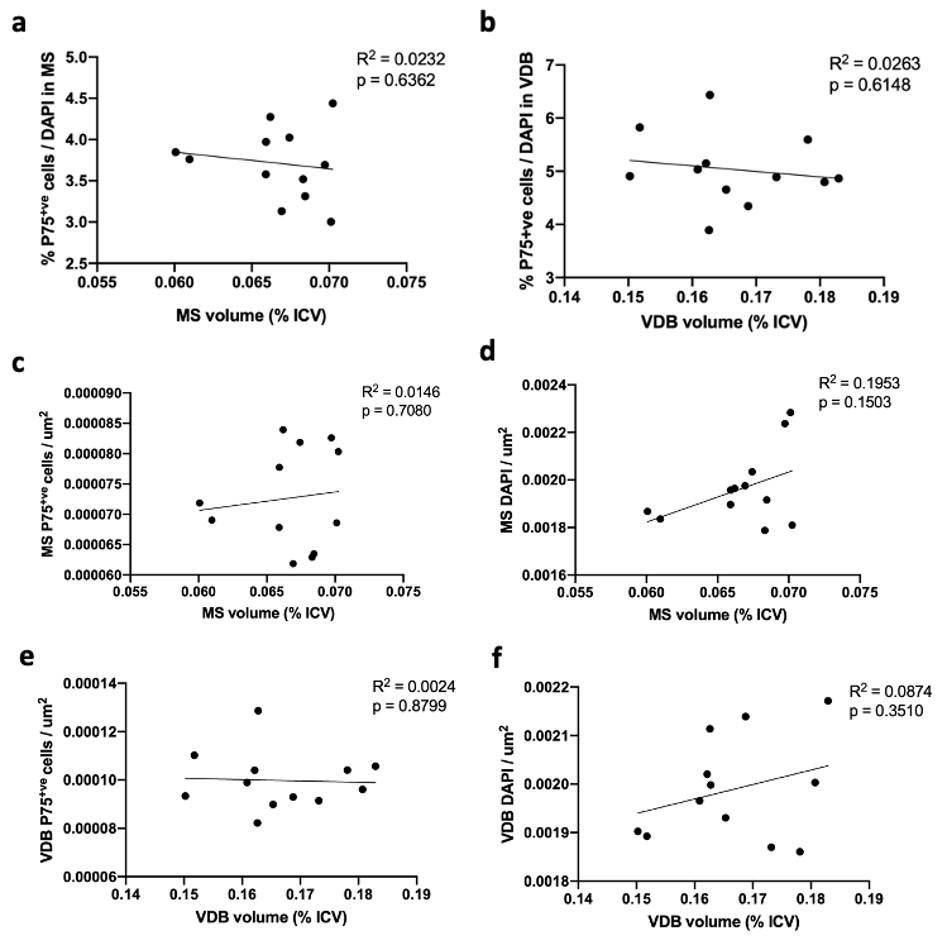
TBM analysis revealed a significant volume decrease in the medial septum (MS) and substantia innominate (SI) (Fig. 2c-d) whereas other parts of the basal forebrain were not affected (Fig. 2a-b, 2e). To verify the results of TBM, manual ROIs were drawn for the MS. The results indicate that the two methods show high consistency (Fig. 2f-g). Next, we performed immunofluorescence to quantify the cholinergic neurons (Fig. 3). p75NGFR-positive cells within the MS and ventral diagonal band (VDB) of basal forebrain revealed no significant difference in both cell proportion and cell density between 3xTg-AD and control mice (Fig. 4). Figure 5 shows the linear regression between MRI-detected volume with cholinergic cell proportion and density in MS and VDB. No correlation was found. Although MS and VDB total cell (DAPI) density shows the slight correlation with MRI-detected volume (Fig. 5d, f), the result is insignificant.Discussion and conclusion
We show that the MRI-detected volume changes in the basal forebrain are not associated with cholinergic neurons in 3xTg-AD animals. However, this study has some limitations. First, the sample size is small (n=12), which reduces the power of the study and increases the margin of error. Second, significant degeneration of basal forebrain cholinergic neurons was reported in much older 3xTg-AD mice (around 18-20 months old) 3. This may explain the similar cholinergic neuron proportion and density between WT and 3xTg-AD mice.Acknowledgements
No acknowledgement found.References
1. Sassin, I. et al. Evolution of Alzheimer’s disease-related cytoskeletal changes in the basal nucleus of Meynert. Acta Neuropathol. 100, 259–269 (2000).
2. Mesulam, M., Shaw, P., Mash, D. & Weintraub, S. Cholinergic nucleus basalis tauopathy emerges early in the aging-MCI-AD continuum. Ann. Neurol. 55, 815–828 (2004).
3. Perez, S. E. et al. Cholinotrophic basal forebrain system alterations in 3xTg-AD transgenic mice. Neurobiol. Dis. 41, 338–352 (2011).
4. Teipel, S. J. et al. Measurement of basal forebrain atrophy in Alzheimer’s disease using MRI. Brain 128, 2626–2644 (2005).
5. Grothe, M. et al. Reduction of basal forebrain cholinergic system parallels cognitive impairment in patients at high risk of developing alzheimer’s disease. Cereb. Cortex 20, 1685–1695 (2010).
6. Teipel, S. et al. Cholinergic basal forebrain atrophy predicts amyloid burden in Alzheimer’s disease. Neurobiol. Aging 35, 482–491 (2014).
Figures