1936
Cardiovascular fitness does not influence relationships between cortical thickness and obesity in aging1INDI Department, Concordia University, Montreal, QC, Canada, 2Centre de Recherche de l'Institut Universitaire de Geriatrie, Montreal, QC, Canada, 3Centre de Recherche, l'Institut de Cardiologie de Montréal, Montreal, QC, Canada, 4Physics Department, Concordia University, Montreal, QC, Canada, 5Department of Neurology and Neurosurgery, McGill University, Montreal, QC, Canada, 6PERFORM Centre, Concordia Univeristy, Montreal, QC, Canada, 7Départment de Médicine, Université de Montréal, Montreal, QC, Canada
Synopsis
Cortical thinning occurs during aging and has been reported to worsen with increased adiposity, although this relationship seems dependent on sex. Increased cortical thickness is related to greater cardiovascular fitness in aging, but previous work has not explored if fitness moderates these conflicting relationships between overweight and cortical thinning. Here, we investigated if fitness moderates relationships between overweight status and cortical thickness in older women and men. Results revealed overweight women had greater cortical thickness than overweight men, but fitness did not moderate this. Future work should investigate sex hormones to further understand these sex differences in overweight individuals.
Summary of main findings
Cardiovascular fitness did not moderate the relationship between increased adiposity and cortical thickness in overweight males and females, nor in those with normal weight.Introduction
Cortical thinning is frequently reported in aging. These declines in cortical thickness have been shown to be attenuated by lifestyle factors such as increased cardiovascular fitness (CVF)1, whereas increased adiposity (i.e. greater body mass index (BMI)) has been reported to accentuate deterioration of cortical thickness2. However, the consistency of these findings changes when considering sex. For example, it has been observed that increased BMI was related to greater cortical thickness in men, whereas in females there was no relationship3. Conversely, others have shown men to have no association between BMI and cortical thickness, but that higher BMI in women is related to cortical thinning4. Yet, in these studies CVF was not reported, thus it is unclear if, knowing its positive effects on the brain, it might have an influential role and potentially aid in explaining these paradoxical findings among sex, BMI and cortical thickness. Thus, we aimed to identify if being normal weight versus overweight/obese had a differential effect on cerebral structure depending on sex, and if so, whether there is a moderating role of CVF.Methods
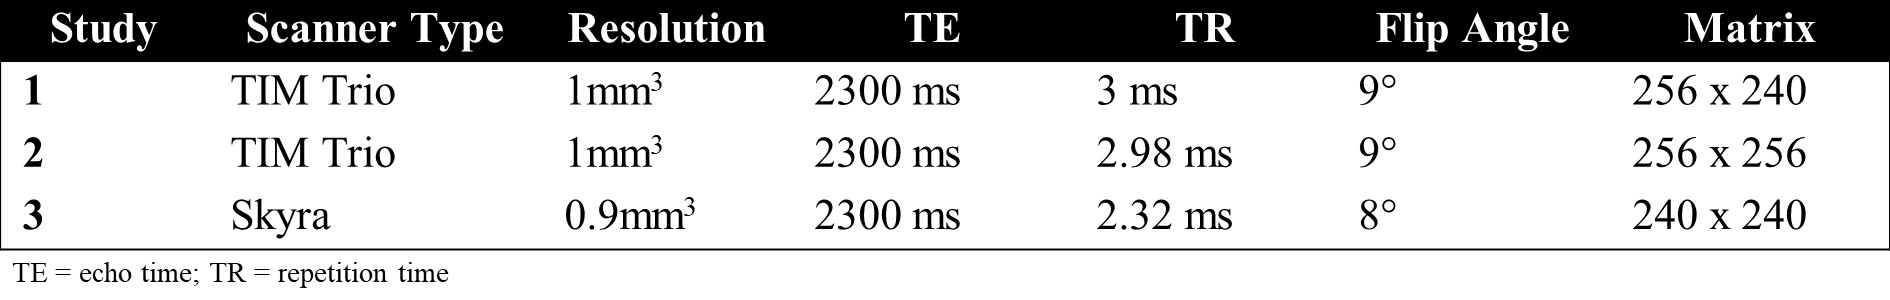
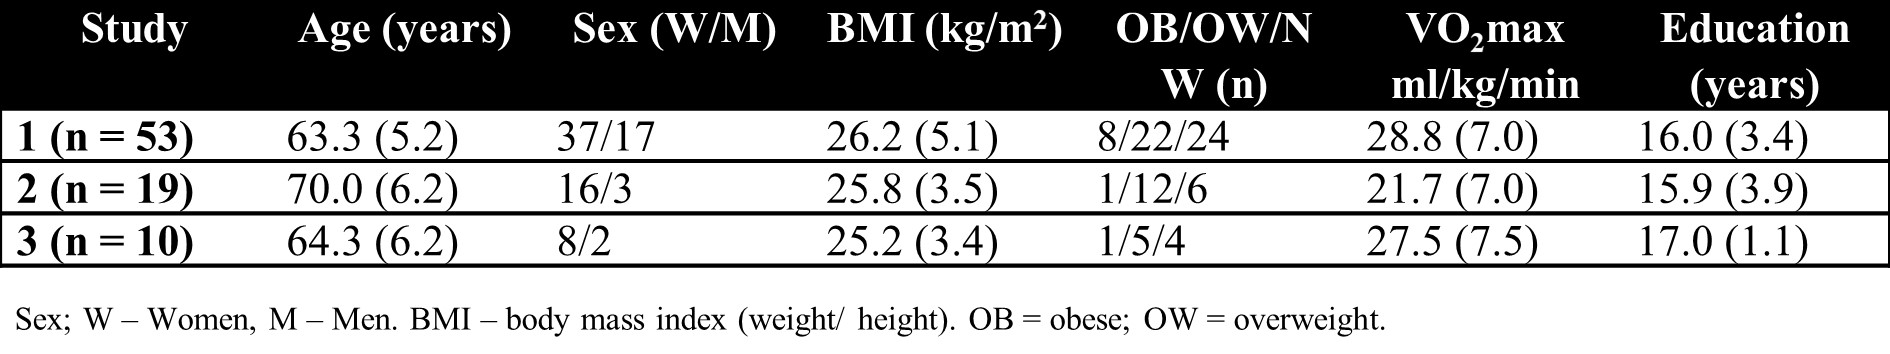
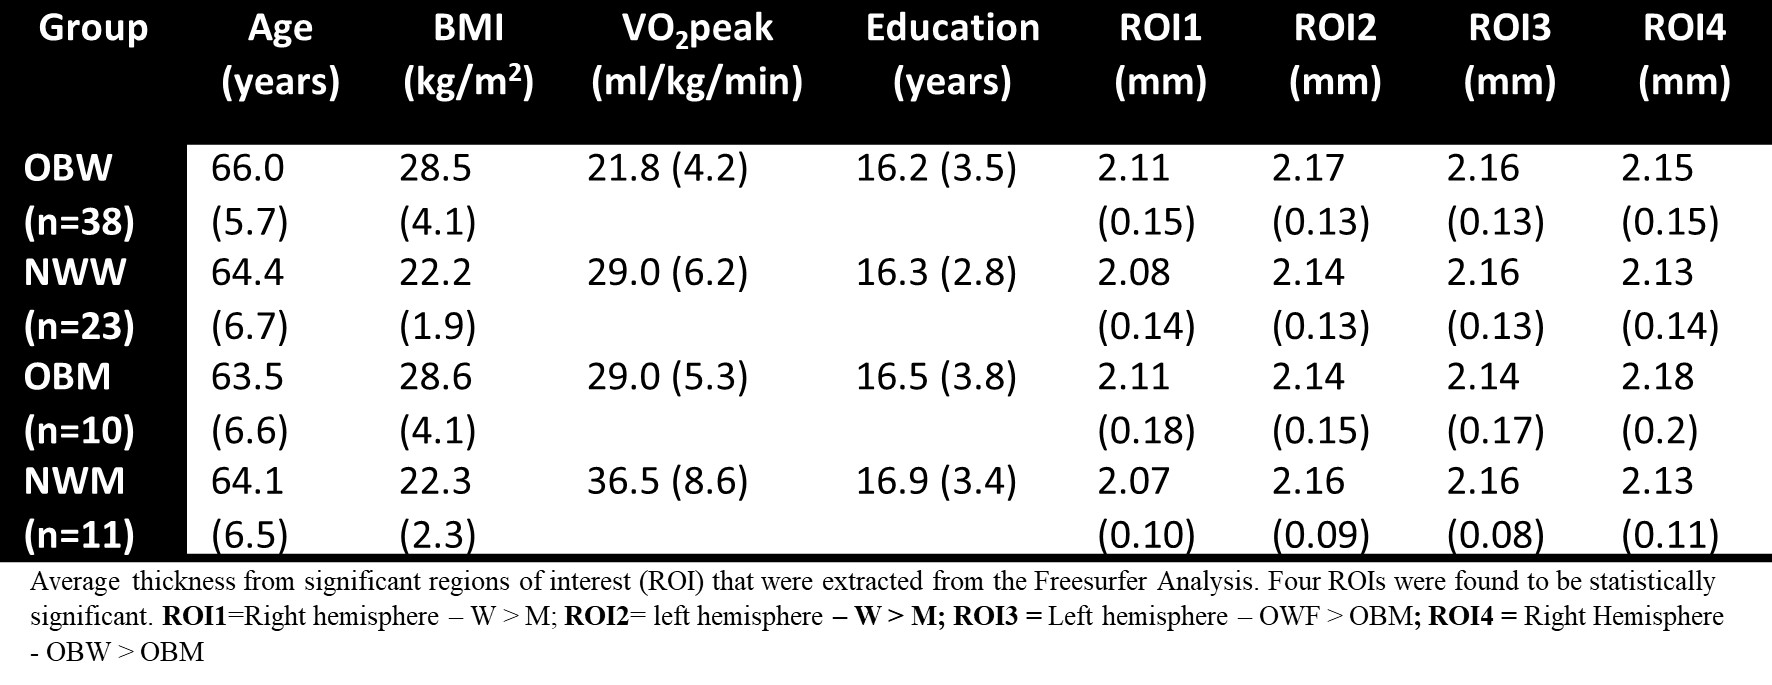
Data from three unique study datasets were pooled, providing a total of 82 older adults with MRI acquisitions, all on 3T Siemens MRI scanners (n=3). An anatomical MPRAGE was acquired in all participants (see Table 1 for the unique imaging parameters for each study). Participants also completed a peak oxygen consumption (VO2 peak) test, the gold standard for measuring fitness levels, outside of the scanner, as well as demographics about height, weight, education and age.The MPRAGE images were used to calculate cortical parcellations using the FreeSurfer software package (v6.0) processing pipeline (http://surfer.nmr.mgh.harvard.edu). We used standard parameter settings for this study as reported in 5. Part of this includes registration of data to Talairach common template, and a smoothing kernel of 15 mm was used. Differences in cortical thickness among overweight men (OBM), women (OBW), and normal weight men (NWM) and women (NWW) (4 groups) was the primary objective. A general linear model was defined, and these groups were used as predictors. We then defined age, education and dataset as nuisance covariates in the model. All statistical tests with FreeSurfer were corrected for multiple comparisons with a Monte Carlo method. Regions of interest (ROI) that were significant, were extracted to investigate the potential influence of VO2peak using SPSS and SPSS PROCESS software.
Results
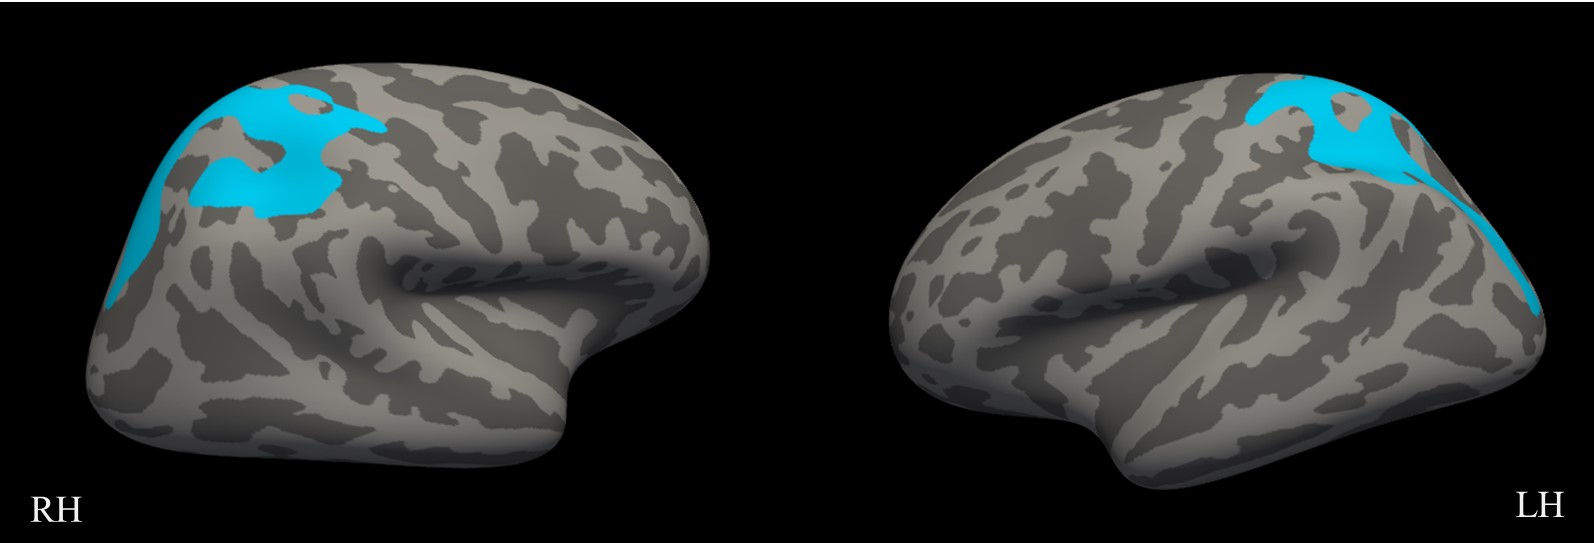
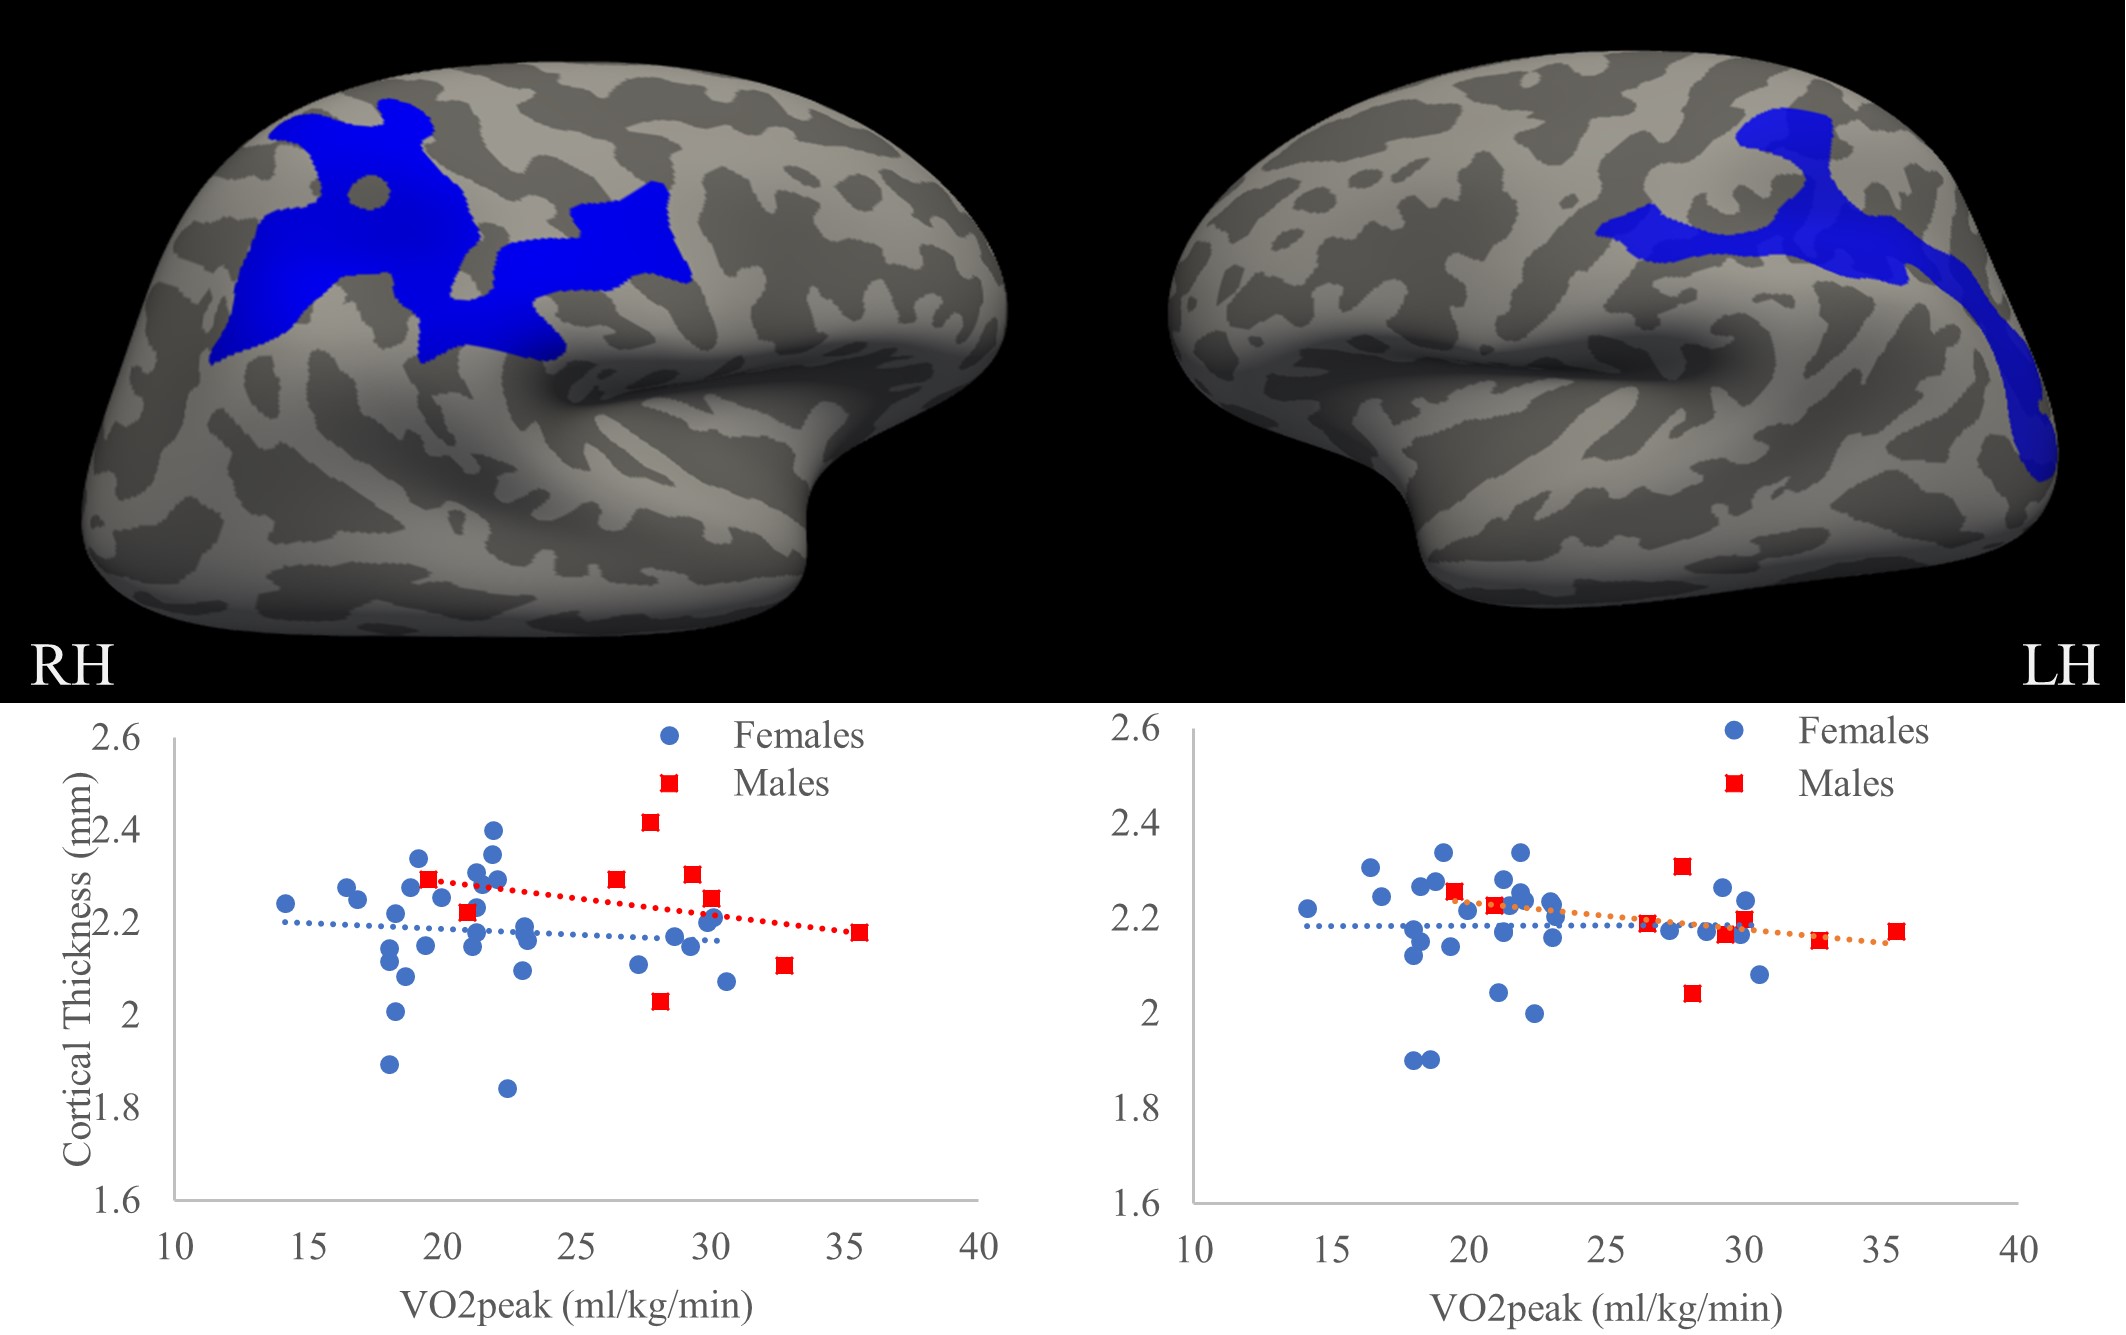
Initial analysis revealed that sex differences were present regardless of BMI status; females had higher cortical thickness in the left and right hemisphere (Figure 1). Upon further investigation, it was found that OBW had significantly greater cortical thickness than OBM in the superior parietal regions of both left and right hemispheres (p =0.0001) (see Figure 1). This latter relationship was investigated with VO2peak as a moderator and was not significant for the left hemisphere (LH; p >0.05) or the right hemisphere (RH; p > 0.05). No statistical differences were observed between NW and OB individuals, or between NWM and NWW (p > 0.05).Discussion
OBW demonstrated significantly greater cortical thickness in superior parietal regions as compared to OBM. These findings contrast other work3,6 which reported OBW had decreased or no difference in cortical thickness, although these previous studies compared OBW to NWW and OBM to NWM, they did not compare OBW to OBM. Further, Neth et al., found this relationship between higher BMI and decreased cortical thickness in regions associated with cortical decline in Alzheimer’s disease6. Whereas here, a whole brain analysis was completed without a priori regions defined. Interestingly, previous studies from our group also observed sex differences in the relationship between overweight status and brain function, such that only in men, better body composition was associated with greater cognitive performance7. Notably, VO2peak was not found to moderate the relationship among sex and cortical thickness in OB individuals in the LH or RH. This is the first time that CVF has been reported to be investigated as an influential factor in relationships among sex, cortical thickness and overweight in aging. Given the positive effect that greater CVF has demonstrated on cortical thickness during aging1, it was surprising to observe no influence of CVF on these relationships3,8. However, with the small sample here, it is possible that we had insufficient power to detect a significant effect.Conclusions
Results reported here show that OBW had greater cortical thickness than OBM. These results should be interpreted with caution due to the small sample size of OBM. Future work should attempt to investigate the influence of CVF on BMI in a larger and more balanced cohort, and cortical thickness in ROIs known to decline in Alzheimer’s disease. Moreover, other cerebral structural outcomes should be examined, such as grey matter volume and white matter hyperintensities. Furthermore, work should focus on identifying what other physiological mechanisms are influencing these contradictory results that are being reported on the effects of sex and overweight on cortical thickness.Acknowledgements
No acknowledgement found.References
1. Williams VJ, Hayes, J, Forman D, et al. Cardiorespiratory fitness is differentially associated with cortical thickness in young and older adults. NeuroImage. 2017;146:1084-1092. doi:10.1016/j.neuroimage.2016.10.033
2. Isaac V, Sim S, Zheng H, Zagorodnov V, Tai E-S, Chee M. Adverse Associations between Visceral Adiposity, Brain Structure, and Cognitive Performance in Healthy Elderly. Front Aging Neurosci. 2011;3. doi:10.3389/fnagi.2011.00012
3. Kim H, Kim C, Seo SW, et al. Association between body mass index and cortical thickness: among elderly cognitively normal men and women. Int Psychogeriatr. 2015;27(1):121-130. doi:10.1017/S1041610214001744
4. Kim SE, Lee JS, Woo S, et al. Sex-specific relationship of cardiometabolic syndrome with lower cortical thickness. Neurology. 2019;93(11):e1045-e1057. doi:10.1212/WNL.0000000000008084
5. Fischl B, Salat DH, Busa E, et al. Whole Brain Segmentation: Automated Labeling of Neuroanatomical Structures in the Human Brain. Neuron. 2002;33(3):341-355. doi:10.1016/S0896-6273(02)00569-X
6. Neth BJ, Graff-Radford J, Mielke MM, et al. Relationship Between Risk Factors and Brain Reserve in Late Middle Age: Implications for Cognitive Aging. Front Aging Neurosci. 2020;11. doi:10.3389/fnagi.2019.00355
7. Langeard A, Fakrahnak Z, Vrinceanu T, et al. Sex-moderated association between body composition and cognition in older adults. Experimental Gerontology. 2020;138:111002. doi:10.1016/j.exger.2020.111002
8. Veit R, Kullmann S, Heni M, et al. Reduced cortical thickness associated with visceral fat and BMI. Neuroimage Clin. 2014;6:307-311. doi:10.1016/j.nicl.2014.09.013
Figures