1935
The changes of hippocampus in Type 2 Diabetes Mellitus Patients with Mild Cognitive Impairment: A Multiple Advanced Diffusion Models study1MR Scientific Marketing, Siemens Healthcare, Guangzhou, China, 2Department of Radiology, the First Affiliated Hospital of Guangzhou University, Guangzhou, China
Synopsis
The aim of this study was to elucidate a multiple diffusion-model-based radiomics model in detecting the changes of hippocampus in Type 2 Diabetes Mellitus Patients with Mild Cognitive Impairment. We used diffusion features derived from DTI, DKI, NODDI and MAP-MRI models and chose LR as the classifier to construct a prediction model. The results showed that the most accurate prediction was achieved by incorporating the NODDI_ICVF and MAP_NG into a nomogram, with AUC and accuracy reached 0.80 and 0.78.
Introduction
The aim of this study was to elucidate a multiple diffusion-model-based radiomics model in detecting the changes of hippocampus in Type 2 Diabetes Mellitus Patients with Mild Cognitive Impairment. We used diffusion features derived from DTI, DKI, NODDI and MAP-MRI models and chose LR as the classifier to construct a prediction model. The results showed that the most accurate prediction was achieved by incorporating the NODDI_ICVF and MAP_NG into a nomogram, with AUC and accuracy reached 0.80 and 0.78.Methods
A total of 42 participants (age: 40-65y) without any other diseases which might affect brain structure and cognitive function were enrolled in the study. All the subjects were divided into 3 groups: T2DM patients with mild cognitive impairment (T2DM_MCI, 16 cases, mean age: 52.94 ± 6.57 years, F/M: 6/10) and healthy controls (HC, 10 cases, mean age: 51.90 ± 6.64 years, F/M: 6/4). All the participants underwent diffusion imaging with a q-space Cartesian grid sampling procedure, on a 3T MR scanner (MAGNETOM Prisma; Siemens Healthcare, Erlangen, Germany) with a 64-channel of head-neck coil. The parameters of diffusion sequence were: FOV = 220 × 220 mm2, slice thickness = 2.0 mm, slices number = 76, voxel size = 2.0 × 2.0 × 2.0 mm3, TR/TE = 4200/72 ms, maximum b value = 3000 s/mm2, with 98 diffusion gradient directions.For diffusion model estimation and radiomics feature extraction, the parameters of NODDI, including intra-neurite volume fraction (ICVF), decreased orientation dispersion index (ODI) and volume fraction of the isotropic compartment (ISOVF) values, MAP-MRI including return-to-origin probability (RTOP), return to axis probability (RTAP), return to plane probability (MAP-RTPP), mean squared displacement (MSD) and Q-space inverse variance (QIV), non-gaussianity (NG), non-gaussian parallel (NGAx) and non-gaussian vertical (NGRad), DTI including fractional anisotropy (DTI-FA), and DKI including radial kurtosis (RK) and axial diffusivity (AD) were calculated by software (NeuDiLab) developed in-house based on the open-resource tool DIPY (Diffusion Imaging In Python, http://nipy.org/dipy. For each patient, the mean values of all diffusion parameters of hippocampus were calculate.For the radiomics features analysis, an open source tool called FeAture Explorer (FAE, v0.1.1, https://github.com/salan668/FAE) was used. We selected 32 cases as the training and validation data set. First, the features clean and preparation were performed. The data of negative group was up-sampled to balance the two sets of samples. The range of each feature was normalized to unit. If two features were similar to each other (dot product larger than 0.86), we removed one of them randomly to reduce the dimension of the feature space. Second, the feature selection was performed before model development using analysis of variance (ANOVA). Lastly, we trained the model by logistic regression (LR) with linear kernel.To investigate the performance of the model, we applied cross validation with 10-folder on the data set. The performance of the model was evaluated using receiver operating characteristic (ROC) curve analysis. The area under the ROC curve (AUC) was calculated for quantification. The accuracy, sensitivity, specificity, positive predictive value (PPV), and negative predictive value (NPV) were also calculated at a cutoff value that maximum the value of the Yorden index.Results
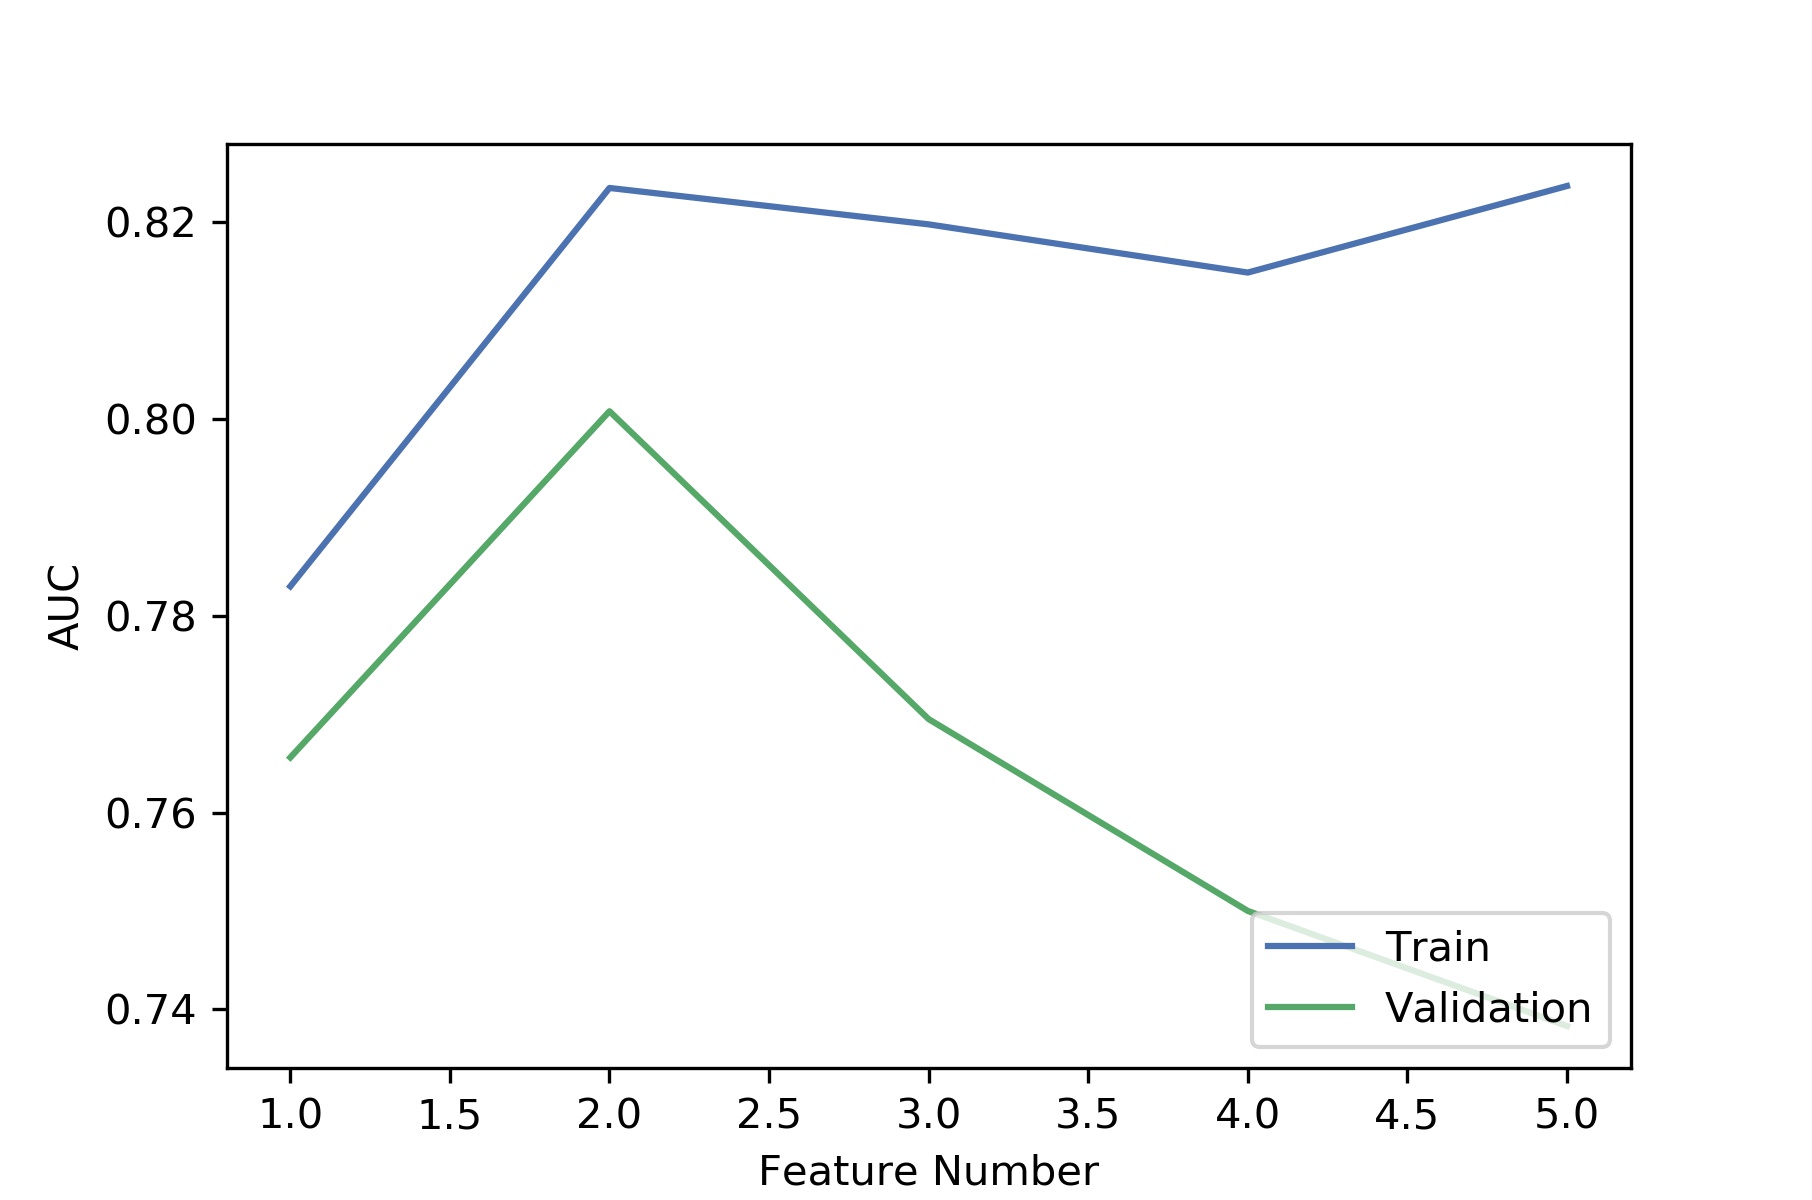
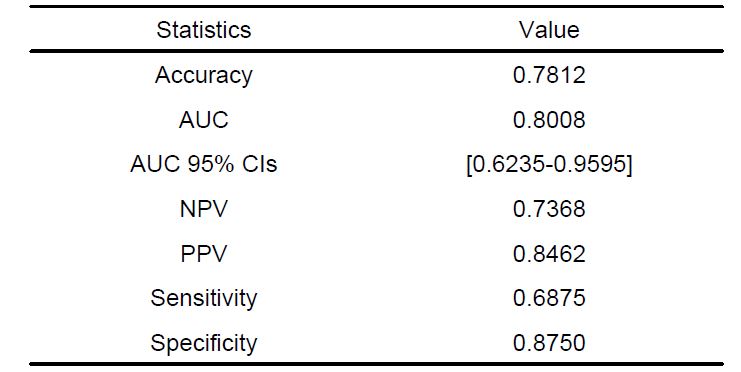
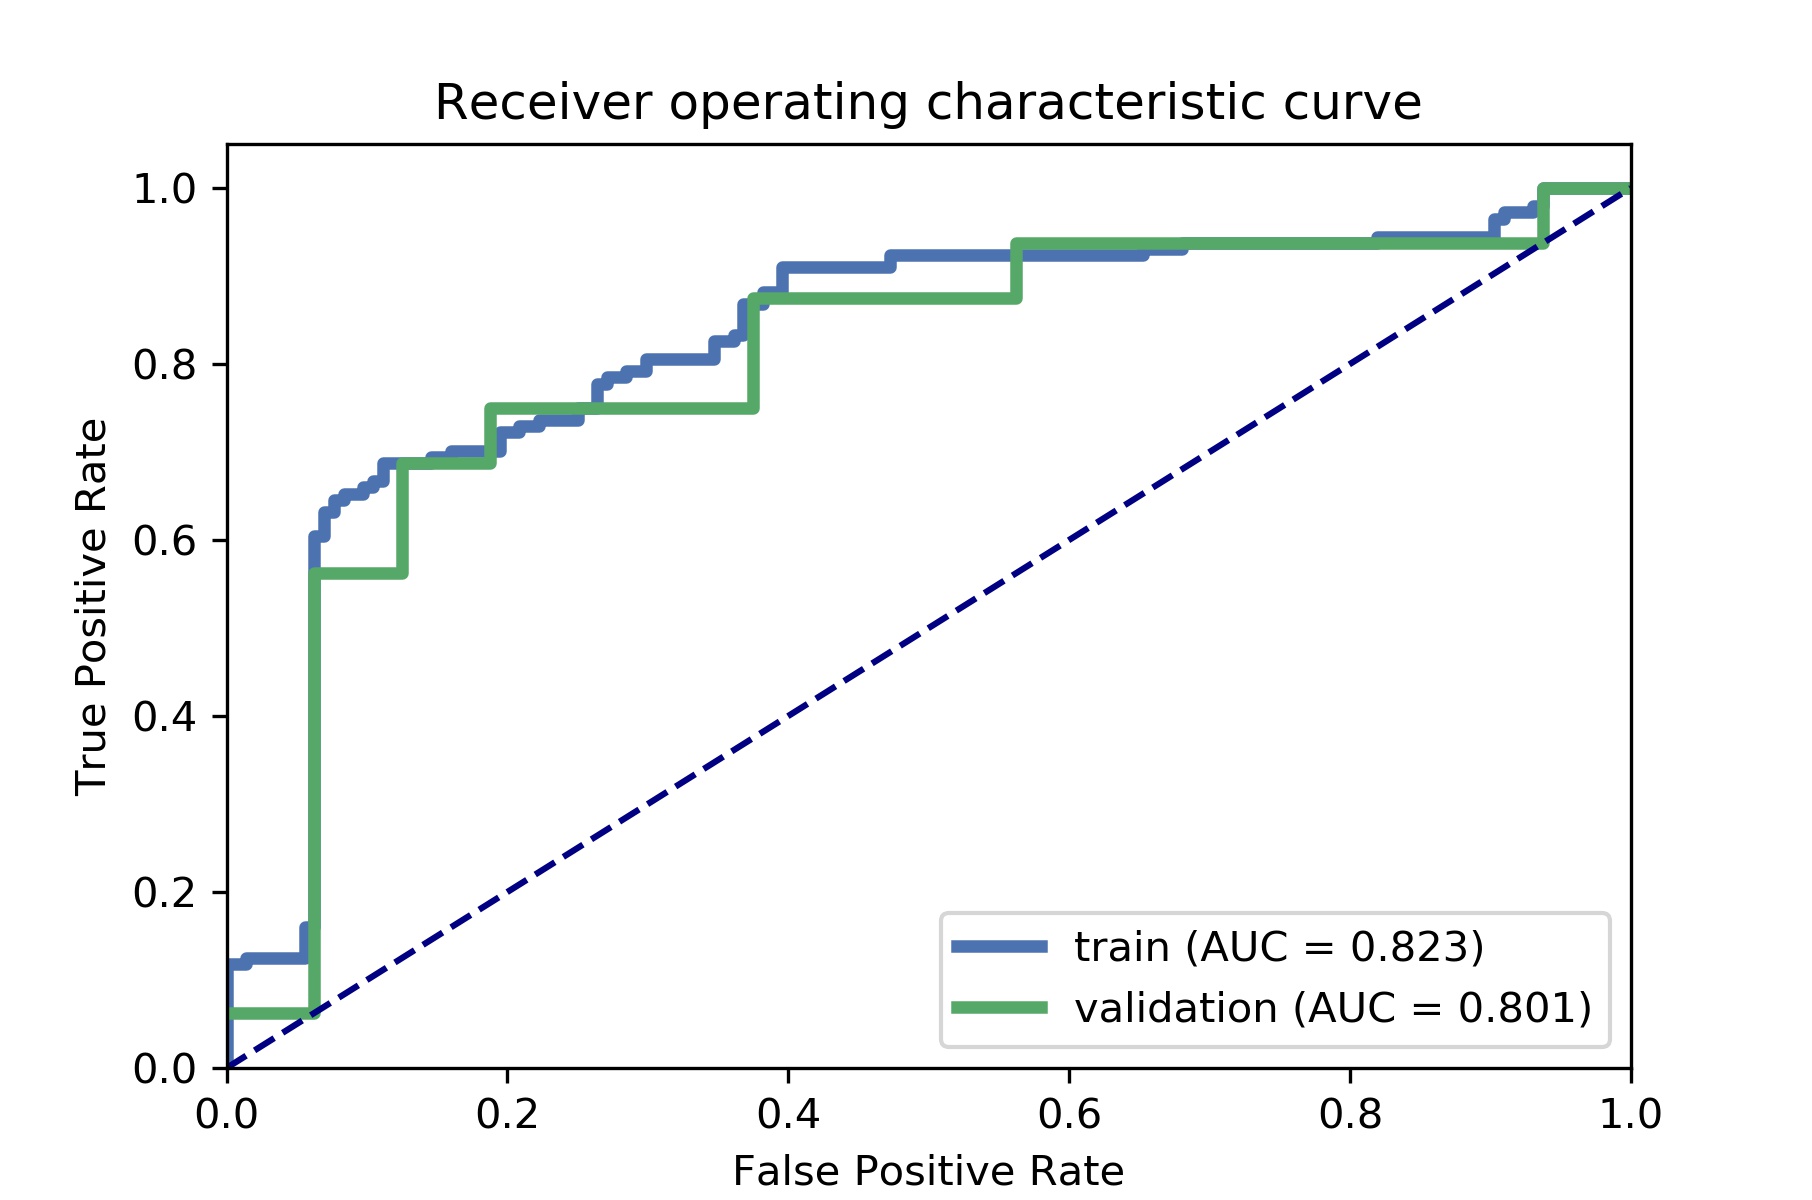
We found that the model based on 2 features including NODDI_ICVF and MAP_NG can get the highest AUC on the validation data set (Figure 1). The AUC and the accuracy could achieve 0.80 and 0.78, respectively. The clinical statistics in the diagnosis were shown in Table 1. The ROC curve was shown in Figure 2.Discussion/Conclusion
Our findings demonstrated that the radiomics features based on multiple diffusion parameters could be used to detect the changes of hippocampus in type 2 diabetes mellitus patients with mild cognitive impairment. The highest prediction accuracy was acquired by incorporating the following NODDI_ICVF and MAP_NG into a nomogram. The results confirmed that MAP-MRI and NODDI showed higher potential in grading of detect changes of hippocampus than DTI and DKI models, and the radiomics model by combining the parameters of MAP-MRI and NODDI could be used to accurately diagnosis the changes of hippocampus in type 2 diabetes mellitus patients with mild cognitive impairment.Acknowledgements
No acknowledgement found.References
[1]. Biessels Geert Jan, Despa Florin, Cognitive decline and dementia in diabetes mellitus: mechanisms and clinical implications. Nat Rev Endocrinol, 2018,14:591-604.
[2]. Kodiweera, C., et al., Effects and Sex Differences in Human Brain White Matter of Young to Middle-Aged Adults: A DTI, NODDI, and q-Space Study. Neuroimage. 2016; 128: 180–192
[3]. Le et al., Mean Apparent Propagator MRI is Better Than Conventional Diffusion Tensor Imaging for the Evaluation of Parkinson’s Disease: A Prospective Pilot Study. Frontiers in Aging Neuroscience 2020; 12
[4]. Avram, A. V., Sarlls, J. E., Barnett, A. S. E. Ö, Thomas, C., Irfanoglu, M. O., Hutchinson, E., et al. Clinical feasibility of using mean apparent propagator (MAP) MRI to characterize brain tissue microstructure. Neuroimage, 2016;127:422-434
Figures