1932
Investigation of brain regional relaxation characteristics in healthy subjects during normal aging using synthetic MRI1Beijing Hospital, National Center of Gerontology; Institute of Geriatric Medicine, Chinese Academy of Medical Sciences, P.R. China, Bejing, China, 2Beijing Hospital, National Center of Gerontology; Institute of Geriatric Medicine, Chinese Academy of Medical Sciences, P.R. China, Beijing, China, 3GE Healthcare, Beijing, China, Beijing, China
Synopsis
Synthetic MRI is a novel method that simultaneously provides quantitative relaxation mapping and synthetic contrast-weighted images. In this study, we adopted this technique to investigate the age-related relaxation characteristics alterations in healthy subjects by brain region-based regression analysis. Specifically, we found significant differences of relaxation characteristics between left and right hemispheres in the frontal and occipital white matter, and the genu and splenium of corpus callosum. T1, T2 and PD showed a quadratic trend with age. Overall, our findings suggested that the relaxation characteristics provided by the synthetic MRI can be considered an effective tool for detecting brain aging.
Introduction
Significant changes in brain structures and functions take place throughout the lifespan[1]. Atypical alternations during the normal aging process have similarities with the pathological changes in neurodegenerative and psychological diseases. Understanding alterations associated with the aging process can help us to differentiate those due to pathological conditions [2]. Relaxometry reflects the magnetization relaxation characteristics and is sensitive to the brain composition, microstructure and related cellular process [3, 4]. A number of studies have reported the age-related changes of the T1 or T2 relaxation times in the brain subregions [5, 6]. Synthetic MRI is an emerging technique which can simultaneously provide quantitative relaxation mapping, synthetic contrast-weighted images, and volumetric characteristics of the brain [7]. This research aims to investigate the age-related alterations of the relaxation characteristics (T1, T2 and proton density (PD)) obtained from synthetic MRI in healthy subjects by brain region-based regression analysis.Methods
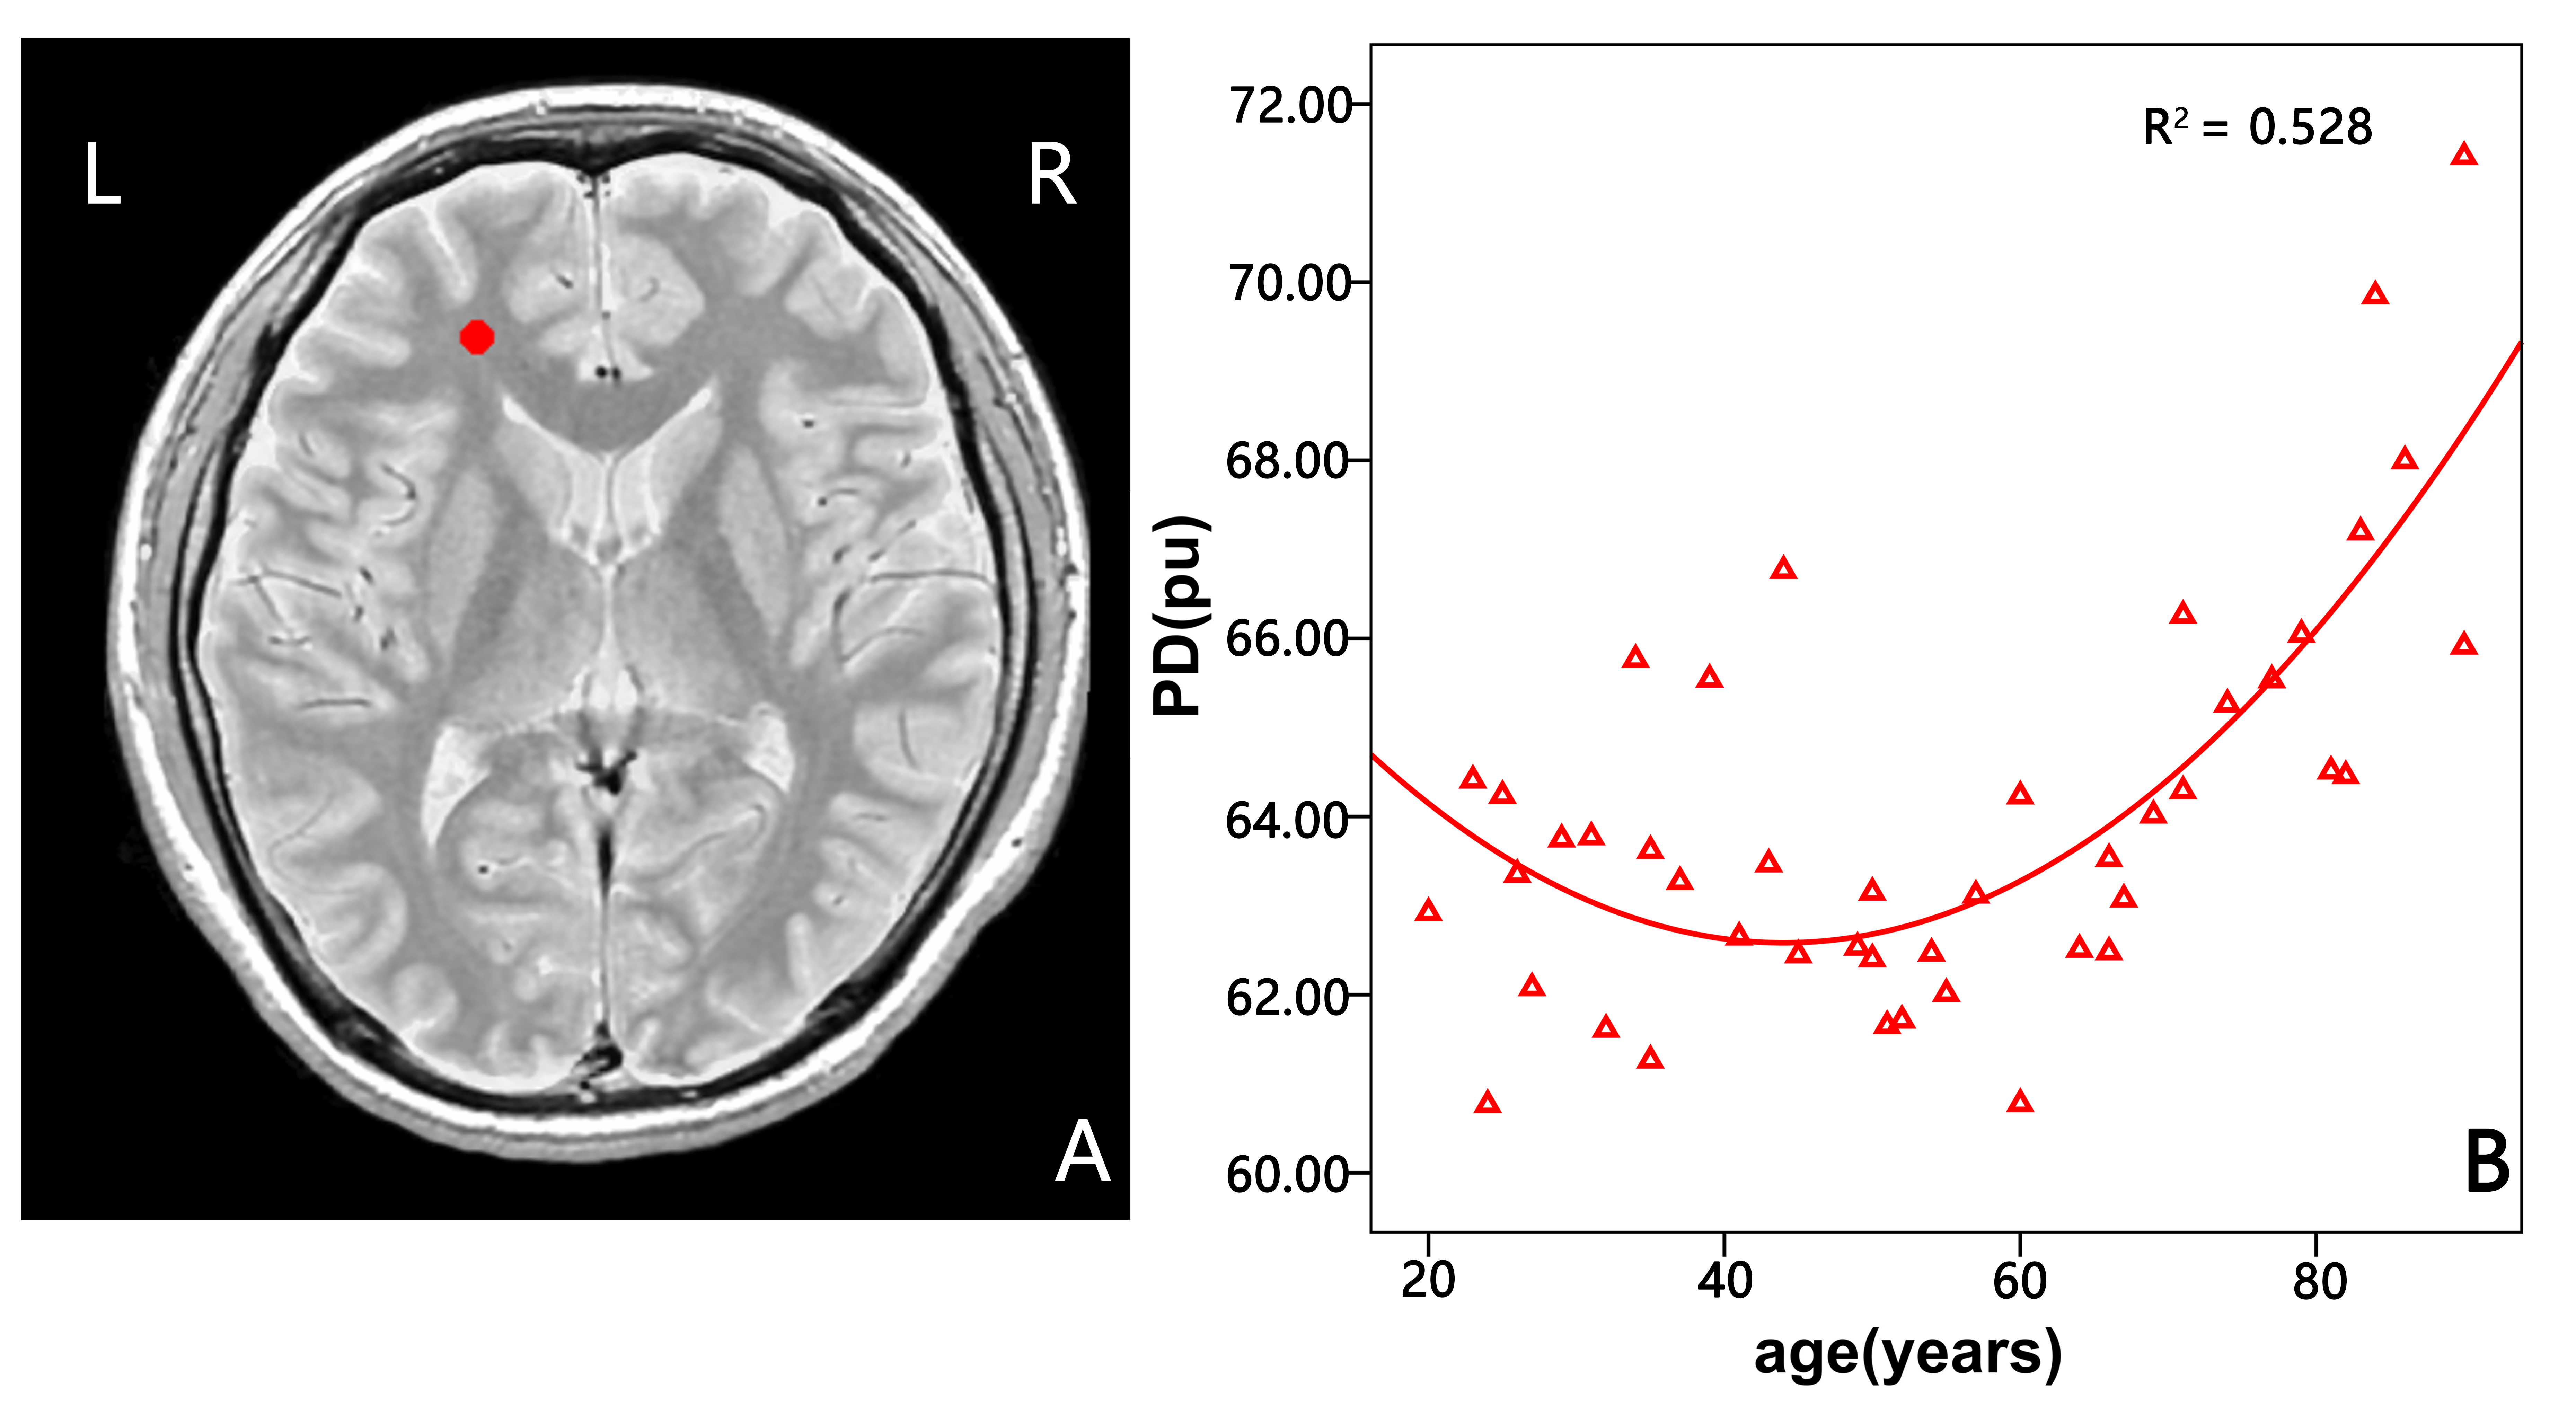
Forty-five healthy subjects (21 males; mean age: 53.96 years; age range: 20–90 years) were enrolled in this study. All data were obtained on a 3.0T whole body scanner (SIGNA Pioneer, GE Healthcare, Milwaukee, WI) equipped with a 32-channel head-neck phased-array coil. Synthetic MRI (MAGnetic resonance image Compilation, MAGIC) was performed with an oblique axial prescription parallel to the anterior commissure-posterior commissure plane. The detailed acquisition parameters of MAGiC sequence were as follows: TR/TE1/TE2 = 4819/21.5/86.1ms, field of view (FoV) = 240 × 240 mm, matrix = 320 × 256, slice thickness/gap = 4/0.5 mm, echo train length = 12, bandwidth = 22.73 kHz, and number of slices = 32. The MAGiC raw data was further processed using SyMRI version 8.04 (SyntheticMR AB, Linköping, Sweden) to generate relaxation maps of T1, T2 and PD. A total number of 8 regions of interest (ROIs) were manually delineated in each subject on synthetic T1-weighted images. Circular ROIs with 3 mm diameter were outlined in the bilateral frontal, parietal and occipital white matter, as well as the genu and splenium of corpus callosum. Statistical analysis was performed using SPSS 19.0 (IBM, Armonk, NY). Independent-samples t-test was used for analyzing the differences of relaxation characteristics in 8 ROIs between different genders and hemispheres. Regression analysis was performed to assess the correlations of relaxation characteristics in 8 ROIs with age. P value less than 0.05 was considered statistically significant.Results
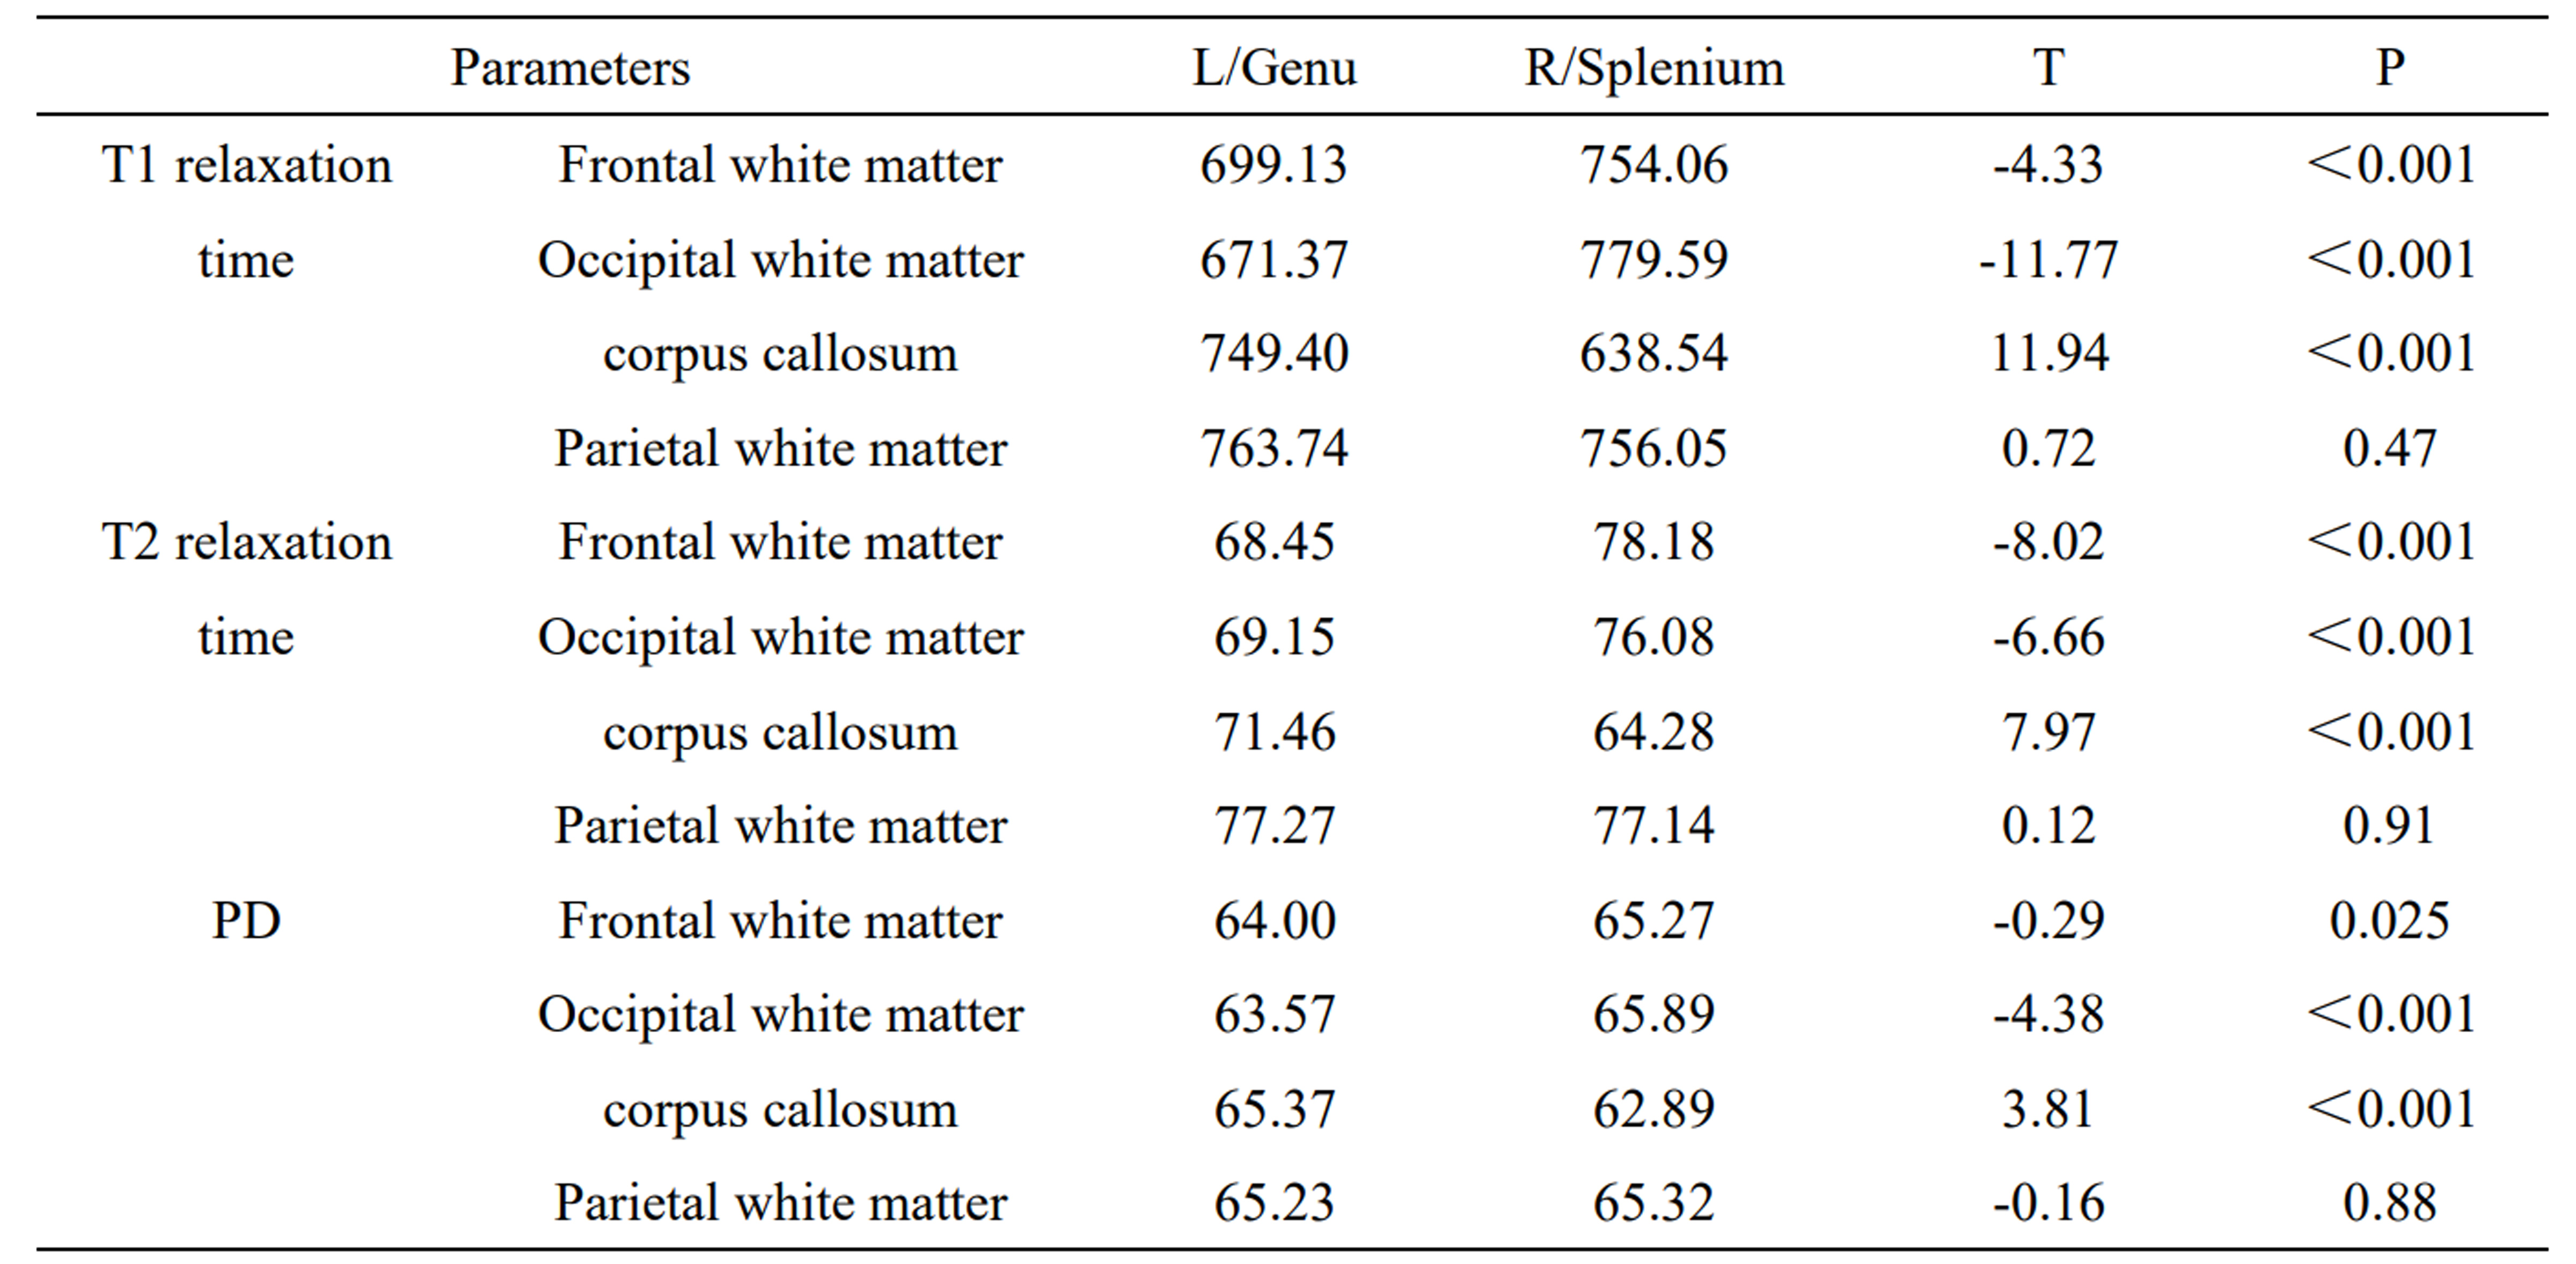
No significant difference of relaxation characteristics was observed between male and female. T1, T2, and PD values in the frontal white matter and occipital white matter showed significant differences between left and right hemisphere (P < 0.001). Right hemisphere all had higher mean values, and the genu had higher mean values than that of splenium of corpus callosum (P < 0.001) (Table 1). No significant difference of relaxation characteristics in parietal white matter was observed between left and right hemisphere. T1, T2, and PD values in the bilateral frontal white matter, right parietal white matter, and splenium of corpus callosum showed a quadratic trend with age (R2 = 0.167–0.528, P < 0.05). Figure 1 showed the PD value in the left frontal white matter as a function of age, which had the best goodness-of-fit (R2 = 0.528, P < 0.001). The regression analysis also showed that the T1 and PD value in right occipital white matter and left parietal white matter had quadratic relationship with age (R2 = 0.280–0.543, P < 0.001).Discussion
In this study, we adopted a novel technique synthetic MRI to investigate the brain regional relaxation characteristics alterations in healthy subjects during the aging process. No difference of relaxation characteristics was observed between genders. We found significant differences of relaxation characteristics between the left and right hemispheres in the frontal and occipital white matter, and the genu and splenium of corpus callosum. T1, T2 and PD in several brain regions showed a quadratic trend with age. Overall, our findings suggested that the relaxation characteristics provided by the synthetic MRI are promising to be a useful tool for detecting brain aging.Acknowledgements
The authors thank Dr. Na Lu and Dr. Yuwei Jiang (Beijing Hospital) for MRI data acquisition. This study was supported in part by grants from the National Natural Science Foundation of China (81771826), Chinese Academy of Medical Sciences Innovation Fund for Medical Sciences(2018-I2M-1-002).References
[1] Yeatman JD, Wandell BA, Mezer AA. Lifespan maturation and degeneration of human brain white matter[J]. Nat Commun, 2014,5:4932, doi:10.1038/ncomms5932.
[2] Li G, Zhai G, Zhao X, et al. 3D texture analyses within the substantia nigra of Parkinson's disease patients on quantitative susceptibility maps and R2( *) maps[J]. Neuroimage, 2019,188:465-472, doi:10.1016/j.neuroimage.2018.12.041.
[3] NeuroImage DMJ. Inferring brain tissue composition and microstructure via MR relaxometry[J]. 2018,182:136-148, doi:10.1016/j.neuroimage.2017.12.087.
[4] D C, F C, M A, et al. Quantitative MRI provides markers of intra-, inter-regional, and age-related differences in young adult cortical microstructure[J]. 2018,182:429-440, doi:10.1016/j.neuroimage.2017.11.066.
[5] Eylers VV, Maudsley AA, Bronzlik P, et al. Detection of Normal Aging Effects on Human Brain Metabolite Concentrations and Microstructure with Whole-Brain MR Spectroscopic Imaging and Quantitative MR Imaging[J]. AJNR Am J Neuroradiol, 2016,37(3):447-454, doi:10.3174/ajnr.A4557.
[6] Badve C, Yu A, Rogers M, et al. Simultaneous T1 and T2 Brain Relaxometry in Asymptomatic Volunteers using Magnetic Resonance Fingerprinting[J]. Tomography, 2015,1(2):136-144, doi:10.18383/j.tom.2015.00166.
[7] A H, M W, M H, et al. SyMRI of the Brain: Rapid Quantification of Relaxation Rates and Proton Density, With Synthetic MRI, Automatic Brain Segmentation, and Myelin Measurement[J]. 2017,52(10):647-657, doi:10.1097/rli.0000000000000365.
Figures