1928
Increased Body Mass Index Associated with Reduced Connectivity in Functional Brain Networks in those At-Risk of Dementia1School of Biomedical Engineering, The University of Sydney, Camperdown, Australia, 2Brain and Mind Centre, The University of Sydney, Camperdown, Australia, 3Cogsleep, Australian National Health and Medical Research Council Centre of Research Excellence, Camperdown, Australia, 4Charles Perkins Centre, The University of Sydney, Camperdown, Australia, 5Healthy Brain Ageing Program, Brain and Mind Centre, The University of Sydney, Camperdown, Australia, 6School of Psychology, Faculty of Science, The University of Sydney, Camperdown, Australia, 7Sydney Imaging, The University of Sydney, Camperdown, Australia
Synopsis
Greater body mass index (BMI) is increasingly recognised as a risk factor for the development of dementia. This study investigated the functional connectivity networks associated with BMI using Network-Based Statistics in a cohort at-risk of developing dementia. Greater BMI was associated with decreased connectivity within 3 networks. Two of these networks showed decreased thalamo-cortical coupling and the third showed reduced connectivity between two nodes in the frontal cortex. This study illustrates the influence of BMI on functional connectivity, and a potential mechanism through which higher BMI confers risk of conversion from an at-risk clinical state to a dementia diagnosis.
Introduction
Functional connectivity as measured by functional MRI (fMRI) offers a powerful way to investigate brain network differences that may relate to risk of disorder. Such measures are increasingly investigated for potential as a biomarker for the development of dementia, especially for identifying individuals at-risk of dementia, i.e. those who are likely to develop a full dementia syndrome.Research is increasingly investigating the functional connectivity and how it associates with dementia risk, including the effect of known risk factors for dementia, such as body weight. The directionality of the effect of body weight on dementia risk is somewhat contentious. It was previously thought that being underweight conferred dementia risk. Now, however, it has been suggested that these findings are likely an effect of a dementia prodrome1. As in weight loss may result from prodromal dementia symptoms, leading to the association between risk of dementia diagnosis and being underweight. In accordance with this, recent reviews have highlighted the risk of being overweight or obese, as measured using body mass index (BMI) on risk for developing cognitive impairment and in turn, dementia2.
To understand the mechanism of BMI on cognition, previous studies in aging populations have investigated how BMI influences functional network activity. These studies have found higher BMI is associated with decreased connectivity in the posterior Default Mode Network (DMN) both during rest3 and during a finger tapping task4. These studies have been conducted in cognitively normal, healthy, adults. This study aimed to extend this work in an aging cohort at-risk of dementia, in a data driven way, to identify networks specifically associated with BMI in an at risk, aging cohort, while accounting for age. Network Based Statistics (NBS)5 was used to identify networks with reduced activity with increased BMI.
Methods
ParticipantsParticipants were adults recruited from a specialty clinic for adults “at risk” of or with early dementia (including subjective cognitive complaints, mild cognitive impairment, and early dementia). Our sample included 95 adults (33 male, 62 female), aged 65.20 years (SD=7.87) with an average Mini-Mental State Examination score of 28.47 (SD=2.74) and a BMI of 27.58 (SD=5.83).
Scanning
Scanning was conducted on a 3T GE scanner. A T1-weighted anatomical (TR = 7.2 ms, TE = 2.8 ms, 0.9mm isotropic voxels) and a functional resting state scan (TR = 3000 ms, TE = 36ms, 39 slices, 140 repetitions) were acquired.
MRI Processing
Pre-processing was conducted using fMRIprep6, version 20.2.01. Pre-processing included: co-registration to the T1, slice timing correction, synthetic distortion correction, motion correction and transformation to MNI standard space. The rsfMRI was filtered with a bandpass (0.01 to 0.1 Hz), and parcellated in to 246 regions as per the Brainnetome Atlas7. The functional connectivity matrices were built for each participant between these 246 regions with Pearson’s correlation of the time series, with the first 20 timepoints discarded.
Statistics
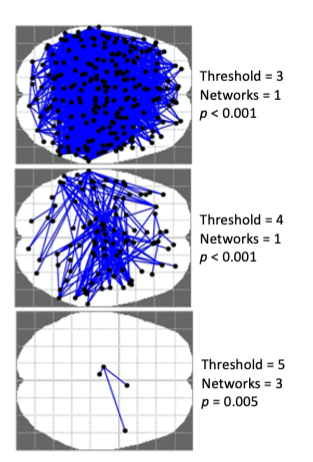
NBS5 was run to identify brain networks associated with BMI, while controlling for age. Thresholds of 3, 4 and 5 were trialled, each illustrated in Figure 1, with p < 0.05 and 10,000 permutations. Directionality (negative association) was assumed given previous research showing reduced functional connectivity associated with increased BMI.
Results
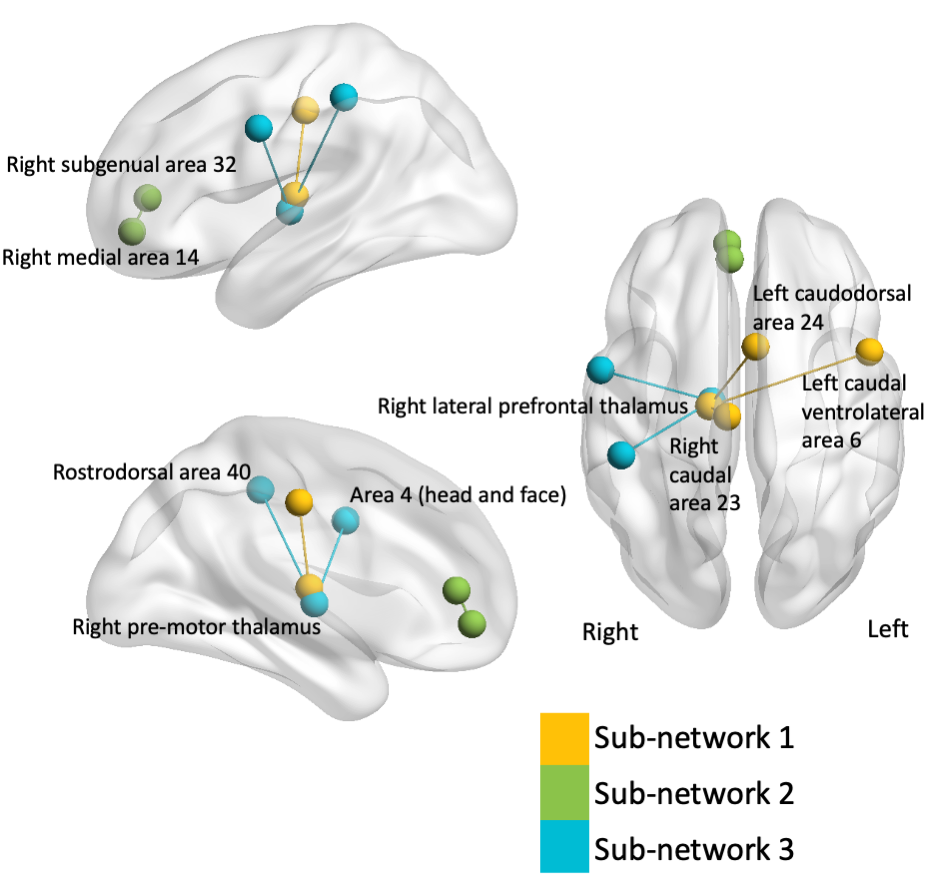
Results reported at a threshold of 5. At this threshold, NBS identified three sub-networks that showed reduced connectivity with increased BMI, p = 006, illustrated in Figure 2.Sub-network 1, p = 0.0064, comprised of the right lateral prefrontal thalamus with connections to proximal right caudal area and contralateral left caudodorsal and caudal ventrolateral areas.
Sub-network 2, p = 0.0046, showed decreased connectivity between the right medial area 14 and right subgenual area 32.
Sub-network 3, p = 0.0131 comprised of connections from right pre-motor thalamus to sensory head/face region and rostrodorsal area 40.
Discussion
NBS identified a set of networks that showed reduced connectivity with increased BMI in a population at high-risk of dementia, while accounting for age. Two networks found decreased connectivity between regions of the right thalamus and regions of the cortex, coherent with previous studies which have found decreased thalamo-cortical connectivity is associated with increased BMI8. The first network found decreased pre-frontal thalamus connectivity with regions in the Dorsal and Ventral Attention networks. The third network found reduced right pre-motor thalamus with the right head and face region in the somatomotor network and a right rostrodorsal area of the Dorsal Attention network.Interestingly, the two nodes in the second subnetwork are DMN regions. While BMI associated alteration in the DMN in individuals at rest have been found previously, the differences in the DMN were the more posterior cingulate and precuneus regions3.
Conclusions
These findings illustrate a specific series of subnetworks influenced by BMI in an at-risk aging cohort. This provides a mechanism through which BMI may exert its protective or risk factor on cognitive decline and follow up data will be used to investigate how network connectivity associates with long-term follow up data for cognitive impairment.Additionally, it highlights that factors such as BMI should be incorporated in to models when investigating functional connectivity as a potential biomarker for dementia risk as these measures may be confounded or unduly influenced by BMI.
Acknowledgements
No acknowledgement found.References
1. Kivimaki, M. et al. Body mass index and risk of dementia: Analysis of individual-level data from 1.3 million individuals. Alzheimers Dement 14, 601-609, doi:10.1016/j.jalz.2017.09.016 (2018).
2. Livingston, G. et al. Dementia prevention, intervention, and care: 2020 report of the Lancet Commission. The Lancet 396, 413-446, doi:10.1016/s0140-6736(20)30367-6 (2020).
3. Beyer, F. et al. Higher body mass index is associated with reduced posterior default mode connectivity in older adults. Hum Brain Mapp 38, 3502-3515, doi:10.1002/hbm.23605 (2017).
4. Hsu, C. L. et al. Elevated body mass index and maintenance of cognitive function in late life: exploring underlying neural mechanisms. Front Aging Neurosci 7, 155, doi:10.3389/fnagi.2015.00155 (2015).
5. Zalesky, A., Fornito, A. & Bullmore, E. T. Network-based statistic: identifying differences in brain networks. NeuroImage 53, 1197-1207, doi:10.1016/j.neuroimage.2010.06.041 (2010).
6. Esteban, O. et al. fMRIPrep: a robust preprocessing pipeline for functional MRI. Nat Methods 16, 111-116, doi:10.1038/s41592-018-0235-4 (2019).
7. Fan, L. et al. The Human Brainnetome Atlas: A New Brain Atlas Based on Connectional Architecture. Cereb Cortex 26, 3508-3526, doi:10.1093/cercor/bhw157 (2016).
8. Sadler, J. R., Shearrer, G. E. & Burger, K. S. Body mass variability is represented by distinct functional connectivity patterns. NeuroImage 181, 55-63, doi:10.1016/j.neuroimage.2018.06.082 (2018).
9. Xia M, Wang J, He Y (2013) BrainNet Viewer: A Network Visualization Tool for Human Brain Connectomics. PLoS ONE 8: e68910,
Figures