1927
Volumetric analysis of brain MRI to distinguish healthy controls from AD and MCI patients according to ATN classification1Advanced Clinical Imaging Technology, Siemens Healthcare AG, Lausanne, Switzerland, 2Dept. of Radiology, Lausanne University Hospital and University of Lausanne, Lausanne, Switzerland, 3LTS5, École Polytechnique Fédérale de Lausanne (EPFL), Lausanne, Switzerland, 4Leenaards Memory Centre CHUV Lausanne University, Lausanne, Switzerland, 5Lille Neuroscience & Cognition, Lille University, Inserm University Hospital CHU, Lille, France
Synopsis
The Amyloid, Tau, Neurodegeneration (ATN) classification model is defined by the concentration of biomarkers in the cerebrospinal fluid (CSF) and the positivity of imaging markers using MR or PET imaging. Despite the CSF biomarkers requiring an invasive procedure, they are good predictors for Alzheimer’s Disease. We investigate the contribution of automated brain MR morphometry analysis to discriminate between healthy subjects and dementia patients according to the ATN classification. Hippocampal and temporal gray matter volumes allow a substantial distinction between healthy participants with amyloid negativity and patients with an Alzheimer’s CSF profile in the T category.
Introduction
The Amyloid (A), tau (T) and neurodegeneration (N) classification approach represents a key advance in the biological characterization of Alzheimer’s disease (AD) spectrum providing criteria to distinguish AD from non-AD causes of cognitive impairment [1]. Complementary to CSF total tau and FDG PET, MR-derived atrophy is considered as an important surrogate for neurodegeneration. Previous work demonstrated the potential of MR-based morphometry to discriminate against patients with hypothetical clinical mild cognitive impairment (MCI) and AD categories [2]. This work complements previous discrimination power results combining volumetry with biological markers. First, a classification analysis using brain volumes and Aβ42, pTau, and Tau values separately is performed. Using a multivariate approach, we then evaluate the classification power of brain volumetry enriched with pTau CSF levels, which could potentially be substituted in the near future by the less invasive biomarker for the presence of pTau-181 in the plasma [3].Data
We considered 394 subjects from ADNI1 [5] including CSF measurements (Abeta 1-42 amyloid peptide, total Tau, phospo-Tau protein ) and optionally PET values (FDG, av45). 3D T1 MPRAGE brain scans for all subjects were extracted from the imaging database. 96 subjects were A-, T-, N-, the remaining 298 were positive at least in one of the three classes (Table 1).Methods
Brain segmentation was performed on 3D T1 MPRAGE images using the Morphobox prototype [2] to estimate the volume of 120 brain regions normalized by the total intracranial volume. Three clinical statuses (AD, MCI and normal) were compared: CSF biomarkers were thresholded using Elecsys method considering a 10% grey zone. The classification problem was characterized by two tasks: distinguishing healthy controls from 1) AD and 2) MCI patients. Using an univariate logistic regression, we evaluated the performance of classification separately considering Aβ42, pTau, and Tau values with respect to single brain regional volumes, which was detrended for age. To evaluate the classification power of combining the CSF markers, we perform a multivariate approach by combining volumetry and pTau using a support vector machine (SVM) model. Training was performed following a nested cross-validation (stratified 5-folds as outer loop and 3-folds for the inner), leaving 20% of the data for testing. The regularization penalty with its coefficient and class weight were considered as hyperparameters. As for SVM, kernel type was an additional hyperparameter. ROC curves were used to compare performances.Results
Most of the AD patients presented triple positivity (Figure 1). Only two AD patients presented triple negativity (grey triangles) and 15 were not A+. Conversely, thirty-nine normal subjects were A+.The univariate approach (Figure 2) indicates that pTau yields the highest area under the curve (AUC); considering singularly hippocampal volumetry and left temporal grey matter, the AUCs were 0.825 and 0.834, respectively. Overall, temporal grey matter (GM) volume outperforms CSF biomarkers in distinguishing healthy controls from MCI. Hippocampal volumetry has a higher discriminative power (0.819 AUC). The logistic regression best hyperparameters were: L2 regularization with a coefficient C=0.001, without weighting the classes.
The AUC for the hippocampus and pTau together are 0.846 and 0.848 in the first and second task respectively, outperforming temporal GM (0.828 and 0.742) and the triplets Aβ42, Tau and pTau (0.832 and 0.749) (Figure 3). The best hyperparameter for the SVM were: polynomial kernel with weighted classes and a regularization parameter of 0.01.
Figure 4 summarizes the performance in terms of AUC reached by the two methods in the two tasks on the five best brain regions and on the CSF biomarkers.
Discussion and Conclusion
Reappraising the clinical ADNI1 categories using the ATN classification, this work demonstrates that hippocampal or temporal grey matter volumes reach discriminative performances comparable to CSF biomarkers. Indeed, temporal lobes and hippocampus are known brain structures that correlate well with Alzheimer’s and dementia.As previously reported, combining multiple brain region volumes in a multivariate approach improves classification results [2]. However, we showed that hippocampal and temporal GM volumes can be considered as a good proxy of Aβ42, Tau and pTau. These biomarkers are not only invasive but very method-dependent, making their evaluation prone to significant variations especially when combining datasets obtained by different analysis methods (e.g. Elecsys, Luminex etc.). Moreover, relying simply on the applied thresholds may induce false positives in the clinical categorization as 39 healthy controls turned out to be amyloid positive. This can be explained by biomarkers early signs that are not necessarily present in the clinical evaluation.
The presence of two subjects A-,N,-T-, which were clinically diagnosed with AD, may question the accuracy of the clinical diagnosis, suggesting the presence of another type of dementia. As shown by our statistical discriminative analysis, volumetry plays an important role in the classification of MCI and healthy controls, being potentially comparable to CSF or PET biomarkers.
Among the CSF biomarkers, pTau classifies AD and MCI best in a univariate manner, that is why it has been considered in combination to the relative volume in the multivariate approach. Moreover, this biomarker may also be detected in the blood [3] so it can be considered as invasive.
Acknowledgements
Data collection and sharing for this study was funded by the ADNI (http://adni.loni.ucla.edu, PI: Michael Weiner; NIH grant U01 AG024904).References
[1] Jack Jr C, Bennett D A, Blennow K, et al. A/T/N: An unbiased descriptive classification scheme for Alzheimer disease biomarkers. Neurology 2016; 87(5): 539-547.
[2] Schmitter D, Roche A, Marechal B, et al. An evaluation of volume-based morphometry for prediction of mild cognitive impairment and Alzheimer's disease. NeuroImage Clin. 2015; 7, 7-17.
[3] Janelidze S, Mattsson N, Palmqvist S, et al. Plasma P-tau181 in Alzheimer’s disease: relationship to other biomarkers, differential diagnosis, neuropathology and longitudinal progression to Alzheimer’s dementia. Nature medicine 2020; 26, 379–386.
[4] Wyman BT, Harvey DJ, Crawford K, et al. Standardization of analysis sets for reporting results from ADNI MRI data. Alzheimers Dement. 2013;9(3):332-337. doi:10.1016/j.jalz.2012.06.004.
Figures
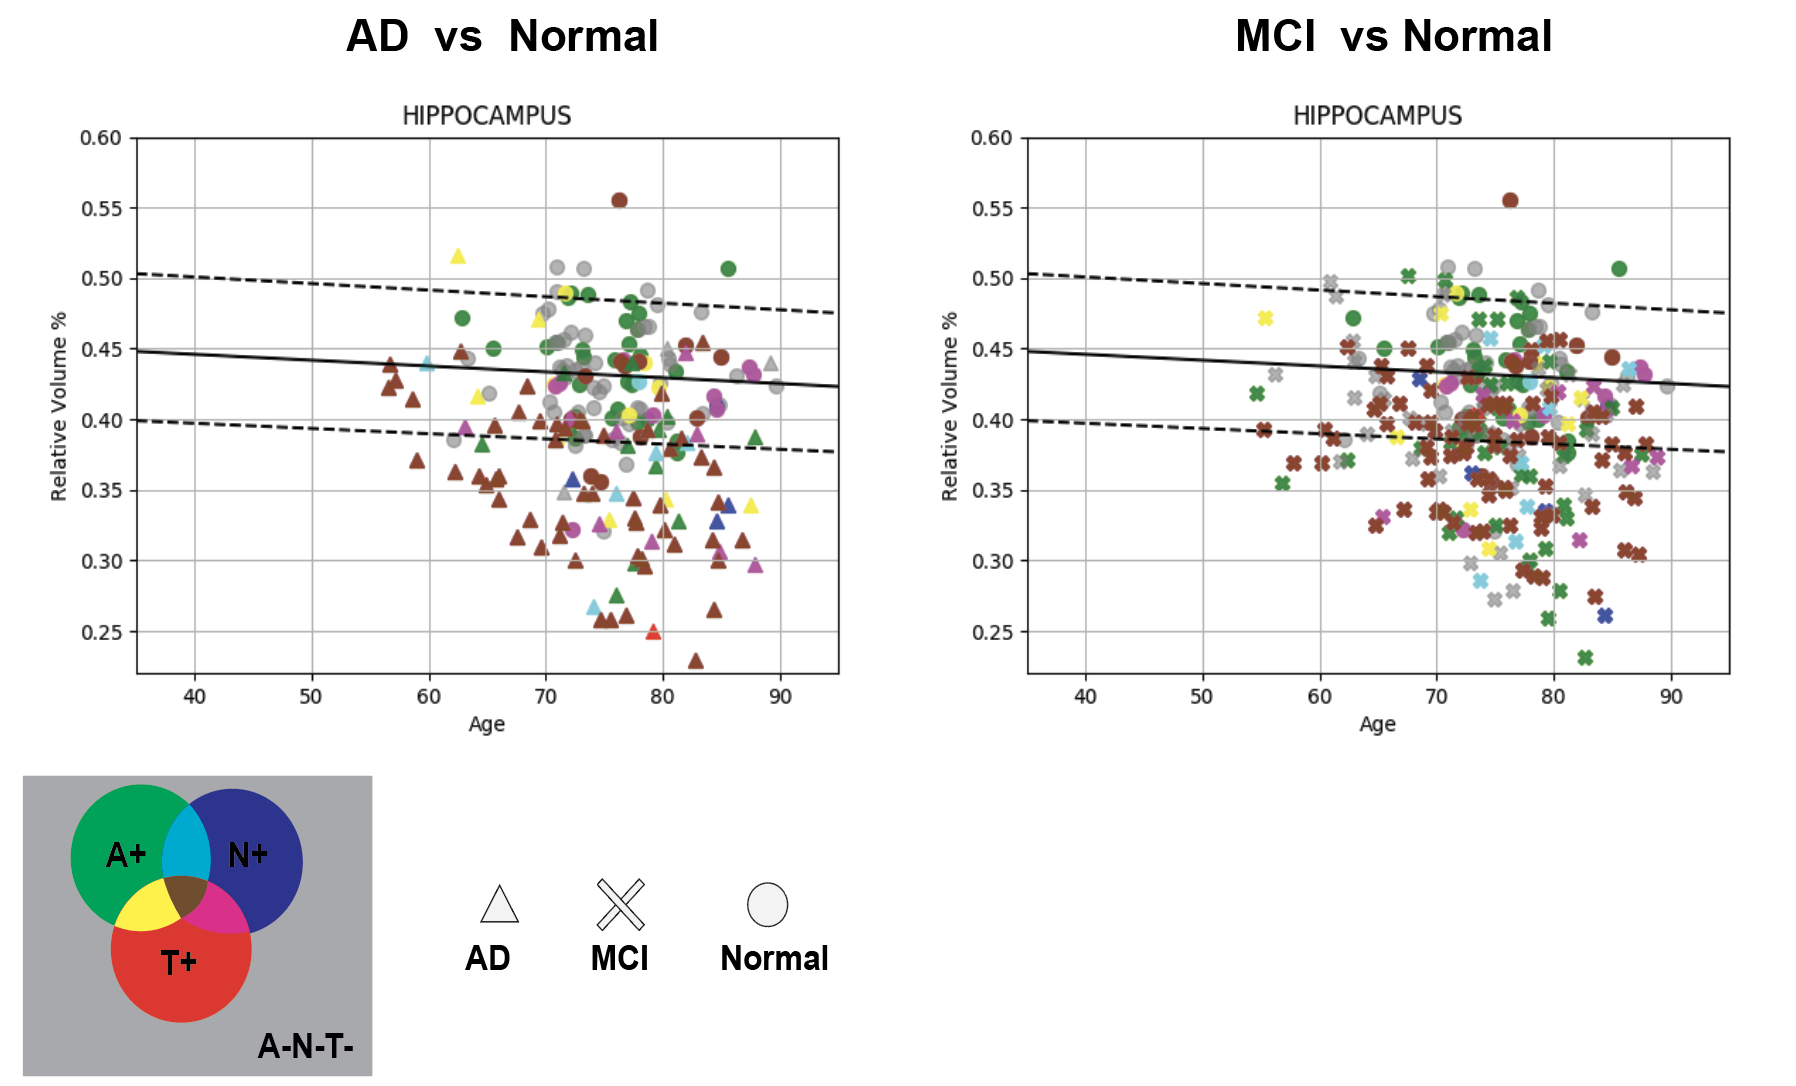
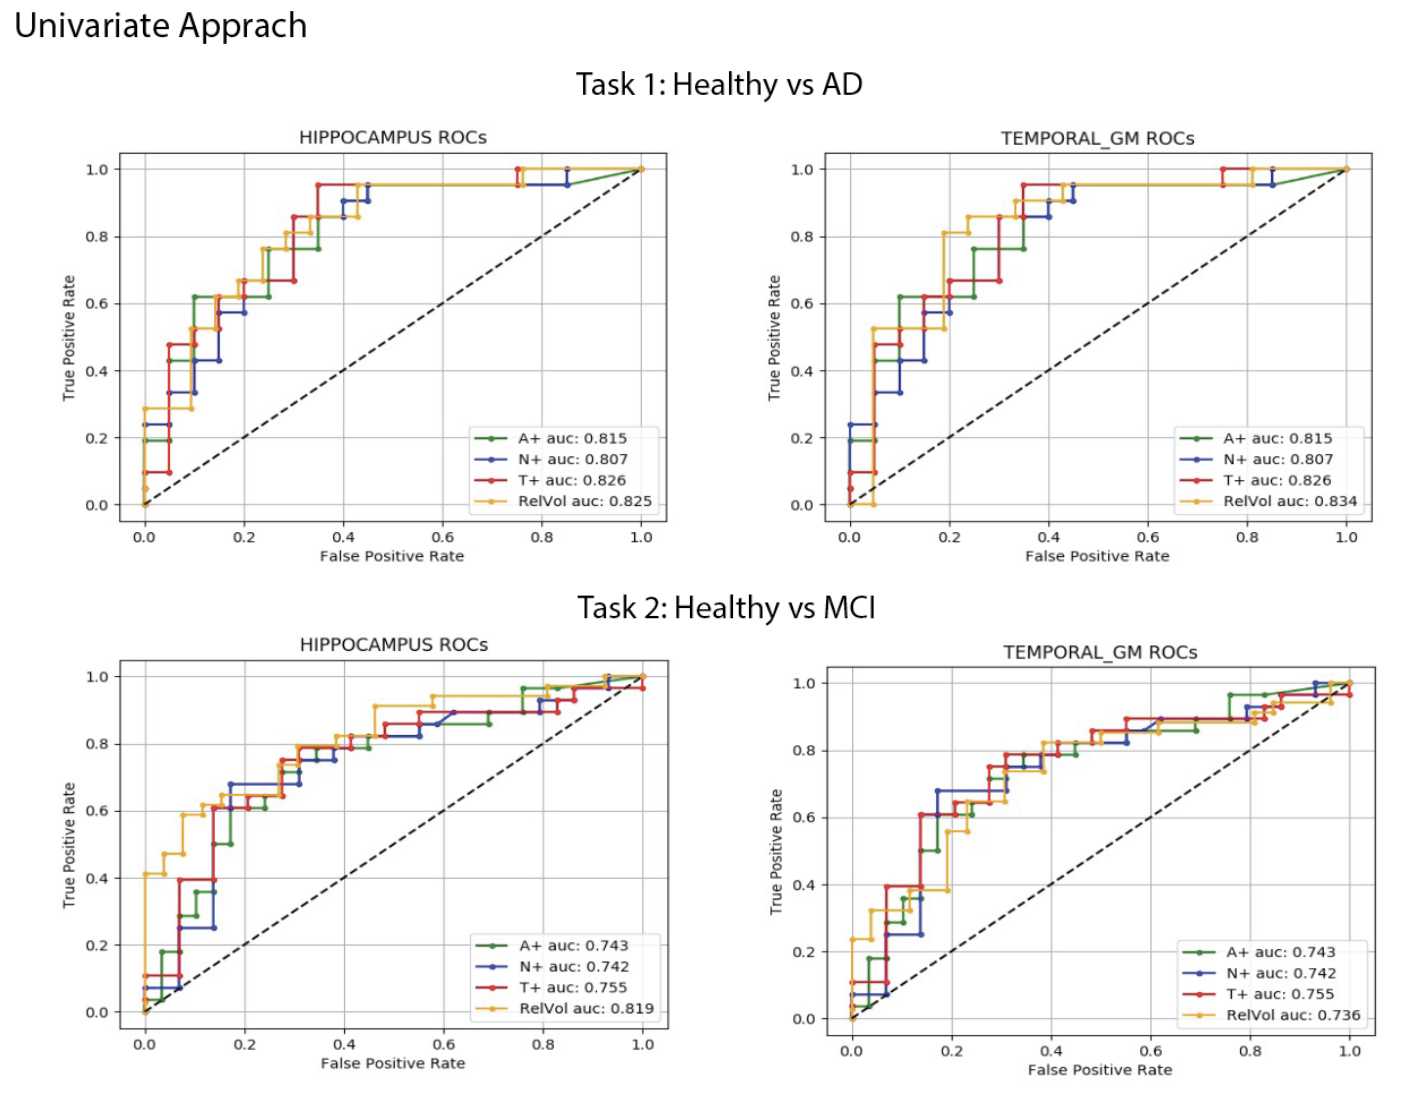
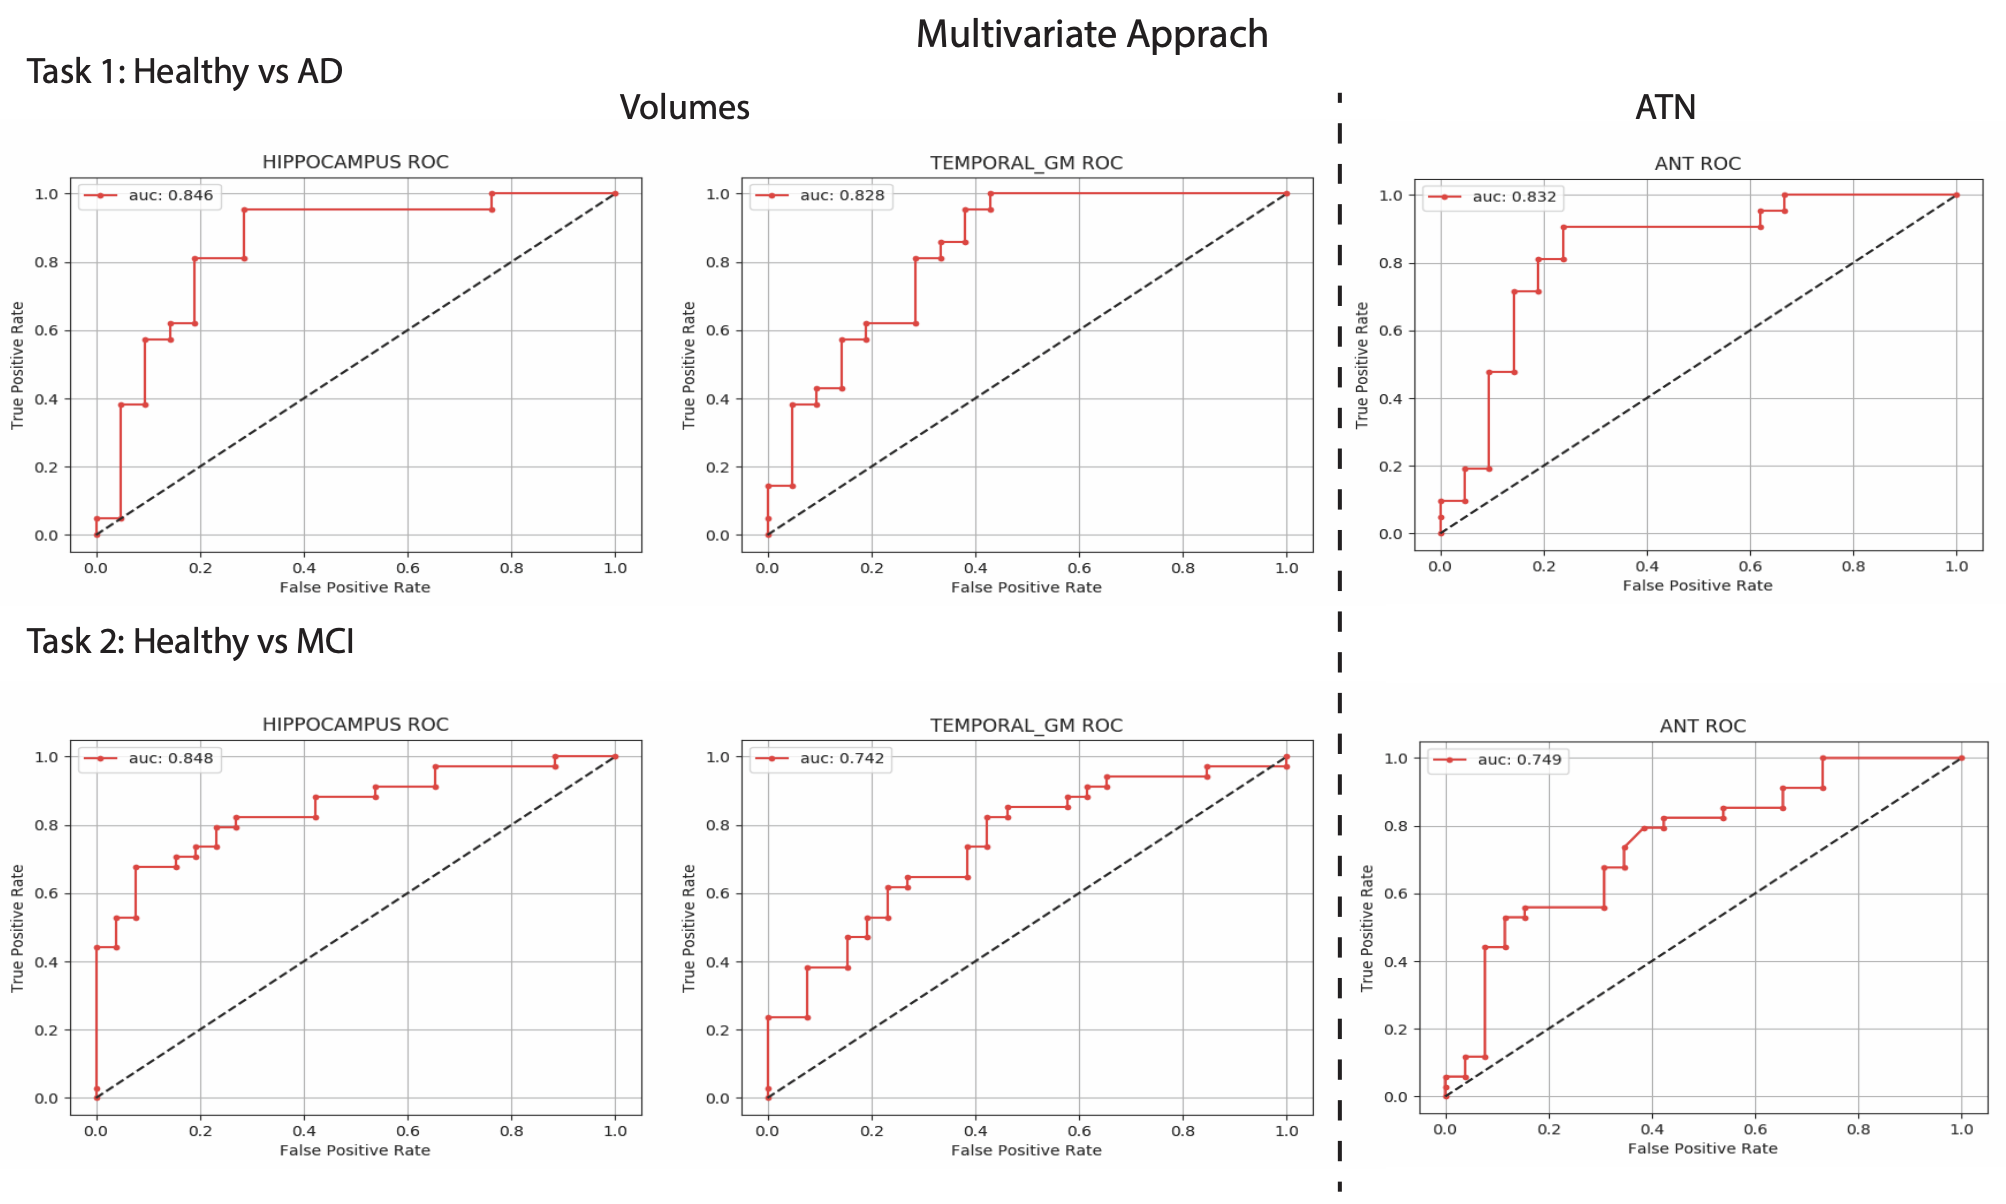
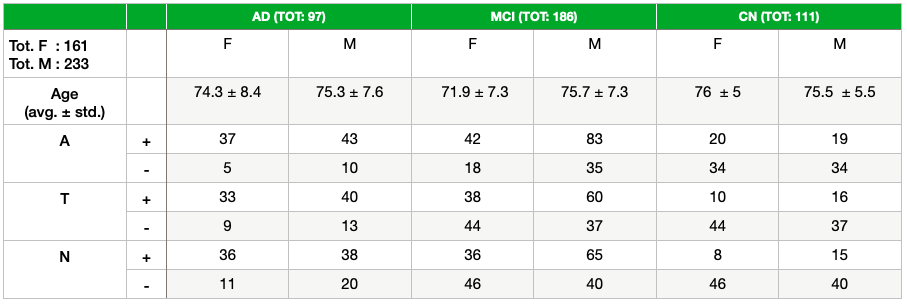
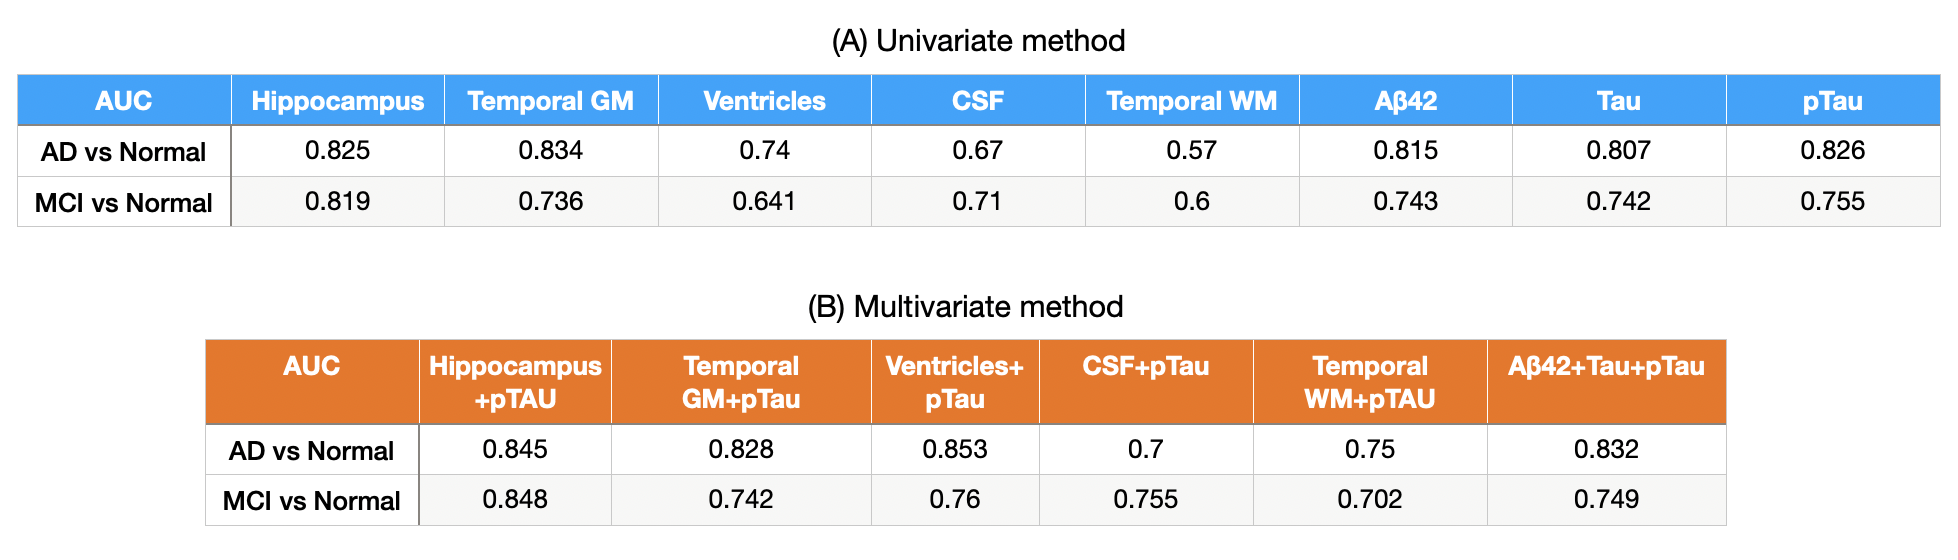
Figure 4. (A) AUC values of some brain regions in AD vs normal and MCI vs normal tasks for the univariate method. (B) AUC values for the multivariate method.