1926
Correlation of gray matter thickness, gray matter volume, white matter lesion and clinical scoring in normal healthy elderly in Thailand1Department of Radiology, Faculty of Medicine, Siriraj Hospital, Mahidol University, Bangkok, Thailand, 2Department of Radiological Technology, Faculty of Medical Technology, Mahidol University, Bangkok, Thailand, 3Department of Preventive and Social Medicine, Faculty of Medicine, Siriraj Hospital, Mahidol University, Bangkok, Thailand
Synopsis
A simple screening tool such as MoCA has been used for demonstrating cognitive change even in normal aging process. Brain MRI has been used to demonstrate the etiology of cognitive problem in elderly. Structural changes by both visual assessment and automated methods can be obtained using MR study. We demonstrated the differences of structural parameters including cortical thickness, volume and white matter lesions(nonspecific white matter change) with a clinical MoCA test in normal aging population.
Introduction
Thailand is already an aging society. Some emerging problems following increased aging population such as mild cognitive impairment and dementia are evident. The Montreal Cognitive Assessment (MoCA) is a useful simple clinical screening test for evaluation of cognitive impairment. On the other way, the brain MRI is a beneficial tool for better assessment of structural change before clinical alteration such as gray matter thickness, the gray matter volume and white matter abnormality. Automated MRI segmentation may be used for evaluating aging brain change as well as detecting interval change in individual patients. The aims of this study were to demonstrate structural change by MRI in each age group of normal healthy elderly and evaluating any structural MR metrics correlated with clinical relevant by MoCA scoring.Methods
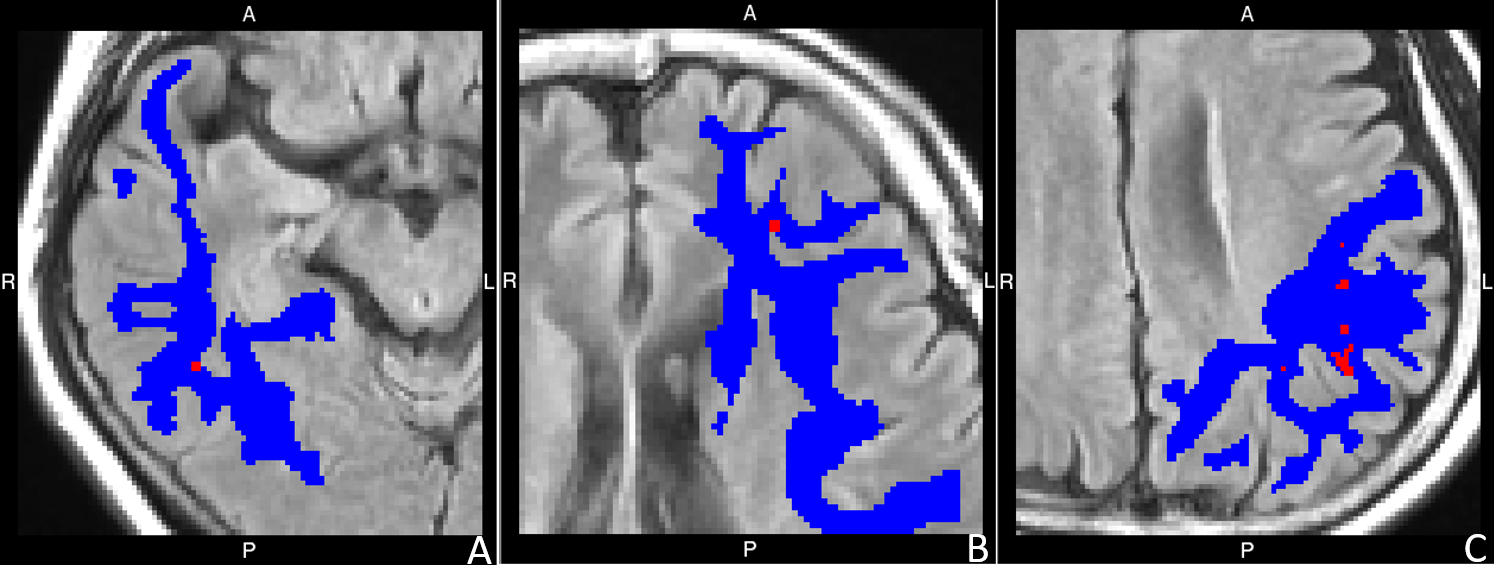
The healthy elderly volunteers, evaluated by clinical assessment underwent brain MRI. MoCA score was assessed for clinical cognition. 1.5T MR scan on 3D-T1W(TFE, TE/TR 3.2 ms/8.5 ms, FA 80, FOV 256x261 mm, matrix size 256x256)and 2D-FLAIR(SE/IR, TE/TR 116 ms/8,500 ms, FA 1400, FOV 240x244 mm, matrix size 256x192) were performed. Any other intracranial abnormalities except for non-specific white matter change were evaluated by two neuroradiologists to exclude subjects with incidental neurological disease. Automated whole brain MR segmentation was obtained by Freesurfer software version 6.0(http://surfer.nmr.mgh.harvard.edu/). Gray matter thickness, gray matter volume and white matter lesion volume(non-specific white matter change) were measured in bilateral frontal, parietal, occipital, temporal, insula and cingulate areas, separately.The age group was classified as 55-59, 60-69, 70-79 and 80-89 years old. The differences of MoCA score, cortical thickness, normalized gray matter volume and white matter lesion volume in each age group were analyzed by one-way ANOVA. Pearson correlation coefficient was used to evaluate relationship of MoCA, white matter lesion volume, gray matter thickness, and gray matter volume. Cohen’s kappa coefficient (K) was used to measure interrater reliability between two raters in individual assessment of white matter lesion, rating scale ranging from 0-3. Correlations of visual rating scale and white matter lesion volume were also obtained.
Results
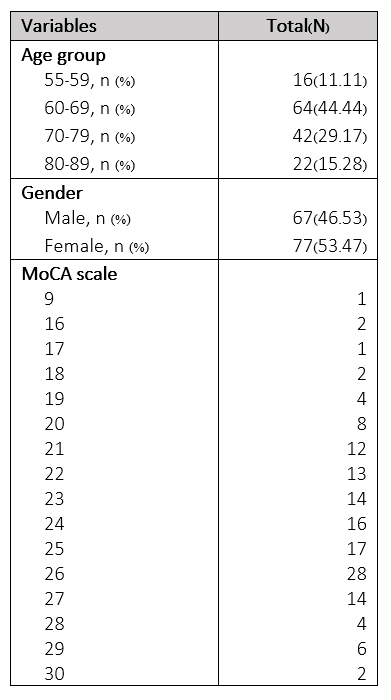
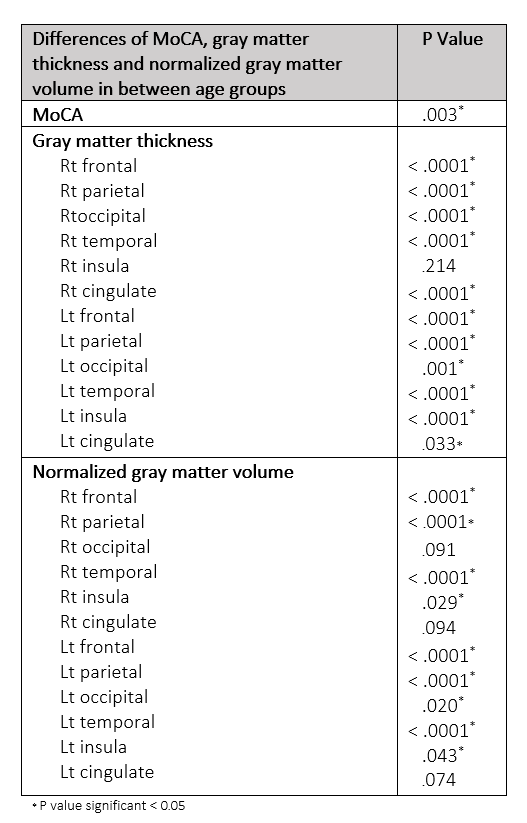
144 participants were included with 66 male and 77 female participants (ranging from 55-89 years old with median age 66-year-old).There were significantly different MoCA between age groups (p= .003) and between age group of 80-89 years old with other age groups (p = .003 in 55-59 years age group, p = .001 in 60-69 years age group and p = .047 in 70-79 years age group). We founded significant difference of gray matter thickness between age groups at all cerebral lobes(p < .0001) except for right cingulate area(p = .214). The normalized gray matter volume was significant difference between age group, except for right occipital lobe and both cingulate areas(p < .0001 at both frontal, both parietal and both temporal, p = .020 at left occipital, p = .029 at right insula and p = .043 at left insula).
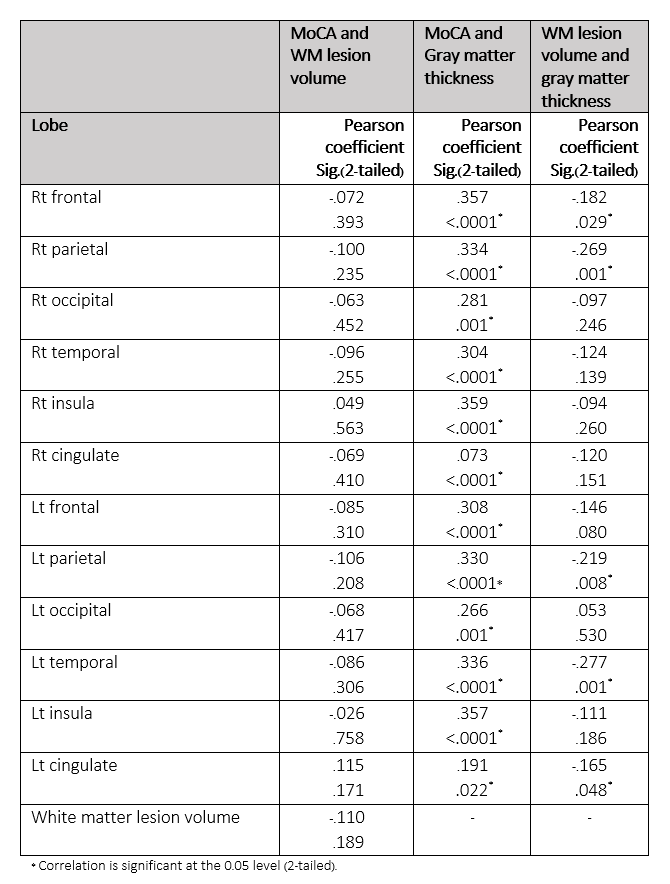
There was correlation between MoCA and gray matter thickness change in all lobes except for right cingulate area (r = .357, p < .0001 at right frontal, r = .334, p < .0001 at right parietal, r = .281, p = .001 at right occipital, r = .304, p < .0001 at right temporal, r = .359, p <.0001 at right insula, r = .073, p < .0001 at left frontal, r = .330, p < .0001 at left parietal, r = .266, p = .001 at left occipital, r = .336, p < .0001 at left temporal, r = .357, p < .0001 at left insula, r = .191, p = .022 at left cingulate)
There was a negative correlation of white matter lesion volume and gray matter thickness of right frontal (r = -.182, p = .029), right parietal (r = -.269, p = .001), left parietal (r = -.219, p = .008), left temporal (r = -.277, p = .001) and left cingulate (r = -.165, p = .048).
The correlation between white matter volume and normalized gray matter volume was significant at right frontal (r = -.275, p = .001), right parietal (r = -.420, p < .0001), left frontal (r = -.276, p = .001), left parietal (r = -.379, p < .0001) and left temporal (r = -.335, p < .0001)
There was a correlation between automated white matter lesion volume and rating scale from both raters in all lobes(r raging from .277 to .966 at p < .05). The interrater agreements were varying from slightly agreement(k = .128 at right temporal) to perfect agreement(at right occipital)
Discussion and conclusion
The MoCA score, gray matter thickness and normalized gray matter volume was different in elderly age groups. Increased white matter lesion volume was found by increasing age, decreasing gray matter thickness and gray matter volume. The MoCA score was correlated with gray matter, implying using MoCA score may be able to predict cortical gray matter thickness as a parameter of the aging brain change. The white matter lesion which assessed by visual rating scale may be useful as surrogate tool for evaluating white matter lesion volume in clinical practice.Acknowledgements
This research project was supported by Faculty of Medicine, Siriraj Hospital, Mahidol University and Bangkok medical center.References
1. Cox S., Ritchie S., Tucker-Drob E. et al. Ageing and brain white matter structure in 3,513 UK Biobank participants. Nat Commun 7. 2016: 13629.
2. Faith M. Gunning-Dixon, Adam M. Brickman. et al. Aging of cerebral white matter: A review of MRI findings. Int J Geriatr Psychiatry. 2009 February; 24(2): 109–117.
3. Farokhian F, Yang C, Beheshti I. et al. Age-related gray and white matter changes in normal adult brains. Aging Dis. 2017;8(6):899-909.
4. SammerG., Lenz E. The Montreal Cognitive Assessment (MOCA) and brain structure. GeroPsych. 2020; 33(2), 101–114.
5. Oscar H. Del Brutto, Robertino M. Mera, Mauricio Zambrano. et al. Global cortical atrophy (GCA) associates with worse performance in the Montreal Cognitive Assessment (MoCA). A population-based study in community-dwelling elders living in rural Ecuador. Archives of Gerontology and Geriatrics. 2015;60(1): 206-209.
6. Jolly TA, Cooper PS, Badwi SA. et al. Microstructural white matter changes mediate age-related cognitive decline on the Montreal Cognitive Assessment (MoCA). Psychophysiology. 2016 Feb;53(2):258-67.
Figures