1925
Analysis of brain structural connectivity networks and white matter integrity in patients with mild cognitive impairment1Neuroimaging Research, Barrow Neurological Institute, Phoenix, AZ, United States, 2Muhammad Ali Parkinson Center at Barrow Neurological Institute, Phoenix, AZ, United States
Synopsis
The objective of this study was to analyze the differences in structural connectivity and white matter (WM) microstructural integrity between healthy subjects and a cohort of individuals with mild cognitive impairment (MCI). For this purpose, we used a novel approach incorporating multi-shell diffusion MRI data from the Alzheimer’s Disease Neuroimaging Initiative (ADNI) database.
Introduction
Mild cognitive impairment (MCI) is considered a prodromal phase of Alzheimer’s disease (AD). Patients with MCI convert to AD at a rate of about 10–15% per year; and MCI patients experience a decline in cognitive abilities, including thinking skills and memory1,2. Because of this high conversion rate to AD, studies of MCI may yield insight into early pathological changes in AD. In this study, we used a novel and expanded approach to analyze structural connectivity and white matter (WM) integrity using fractional anisotropy (FA), intra-cellular (IC), extra-cellular (EC), and isotropic (ISO) maps between a group of MCI and healthy controls (HCs). Diffusion MRI data were downloaded from the ADNI database [http://adni.loni.usc.edu/].Methods
Thirty-two HC (age mean ± S.D. = 70 ± 6 years; 20 females) and 20 MCI (72 ± 9 years; 7 females) were included in this study. All subjects completed the Mini-Mental State Exam (MMSE)3, the Montreal Cognitive Assessment (MoCA)4, and the Global Deterioration Scale (GDS)5. Multi-shell diffusion data (from ADNI) included 126 diffusion-encoding directions and three b-values: b=0 (13 volumes), b=1000, and b=2000 s/mm². T1-w MPRAGE images were used for segmentation by FreeSurfer (https://surfer.nmr.mgh.harvard.edu/). DTI pre-processing was performed by Mrtrix36, FSL7, and ANTs (http://stnava.github.io/ANTs/) and included denoising, eddy current, motion, and bias field corrections. FA maps were fit by a weighted-linear fit (dtifit). Tractography was performed with 5 million seeds using the iFOD2 algorithm8 and by using the WM/grey-matter border as seed locations. Connectome was generated from the Desikan-Killiany parcellation file (aparc+aseg.mgz, FreeSurfer) and was subsequently filtered using the COMMIT algorithm9. A three-compartment Stick-Zeppelin-Ball model10 was used to create the intra-cellular (IC), the extra-cellular (EC), and the isotropically restricted (ISO) compartment models, respectively. This model assumes zero radius cylinders for the IC space and cylindrical symmetry for the EC space. Statistical analysis was performed by connectomestats (Mrtrix3) for structural connectivity and randomise (FSL) for the voxel-base analysis (VBA) on the DTI-derived metrics. For both analyses, we used 5,000 permutations. Significant results are reported at a p-values level of 0.05 with Threshold-Free Cluster Enhancement.Results
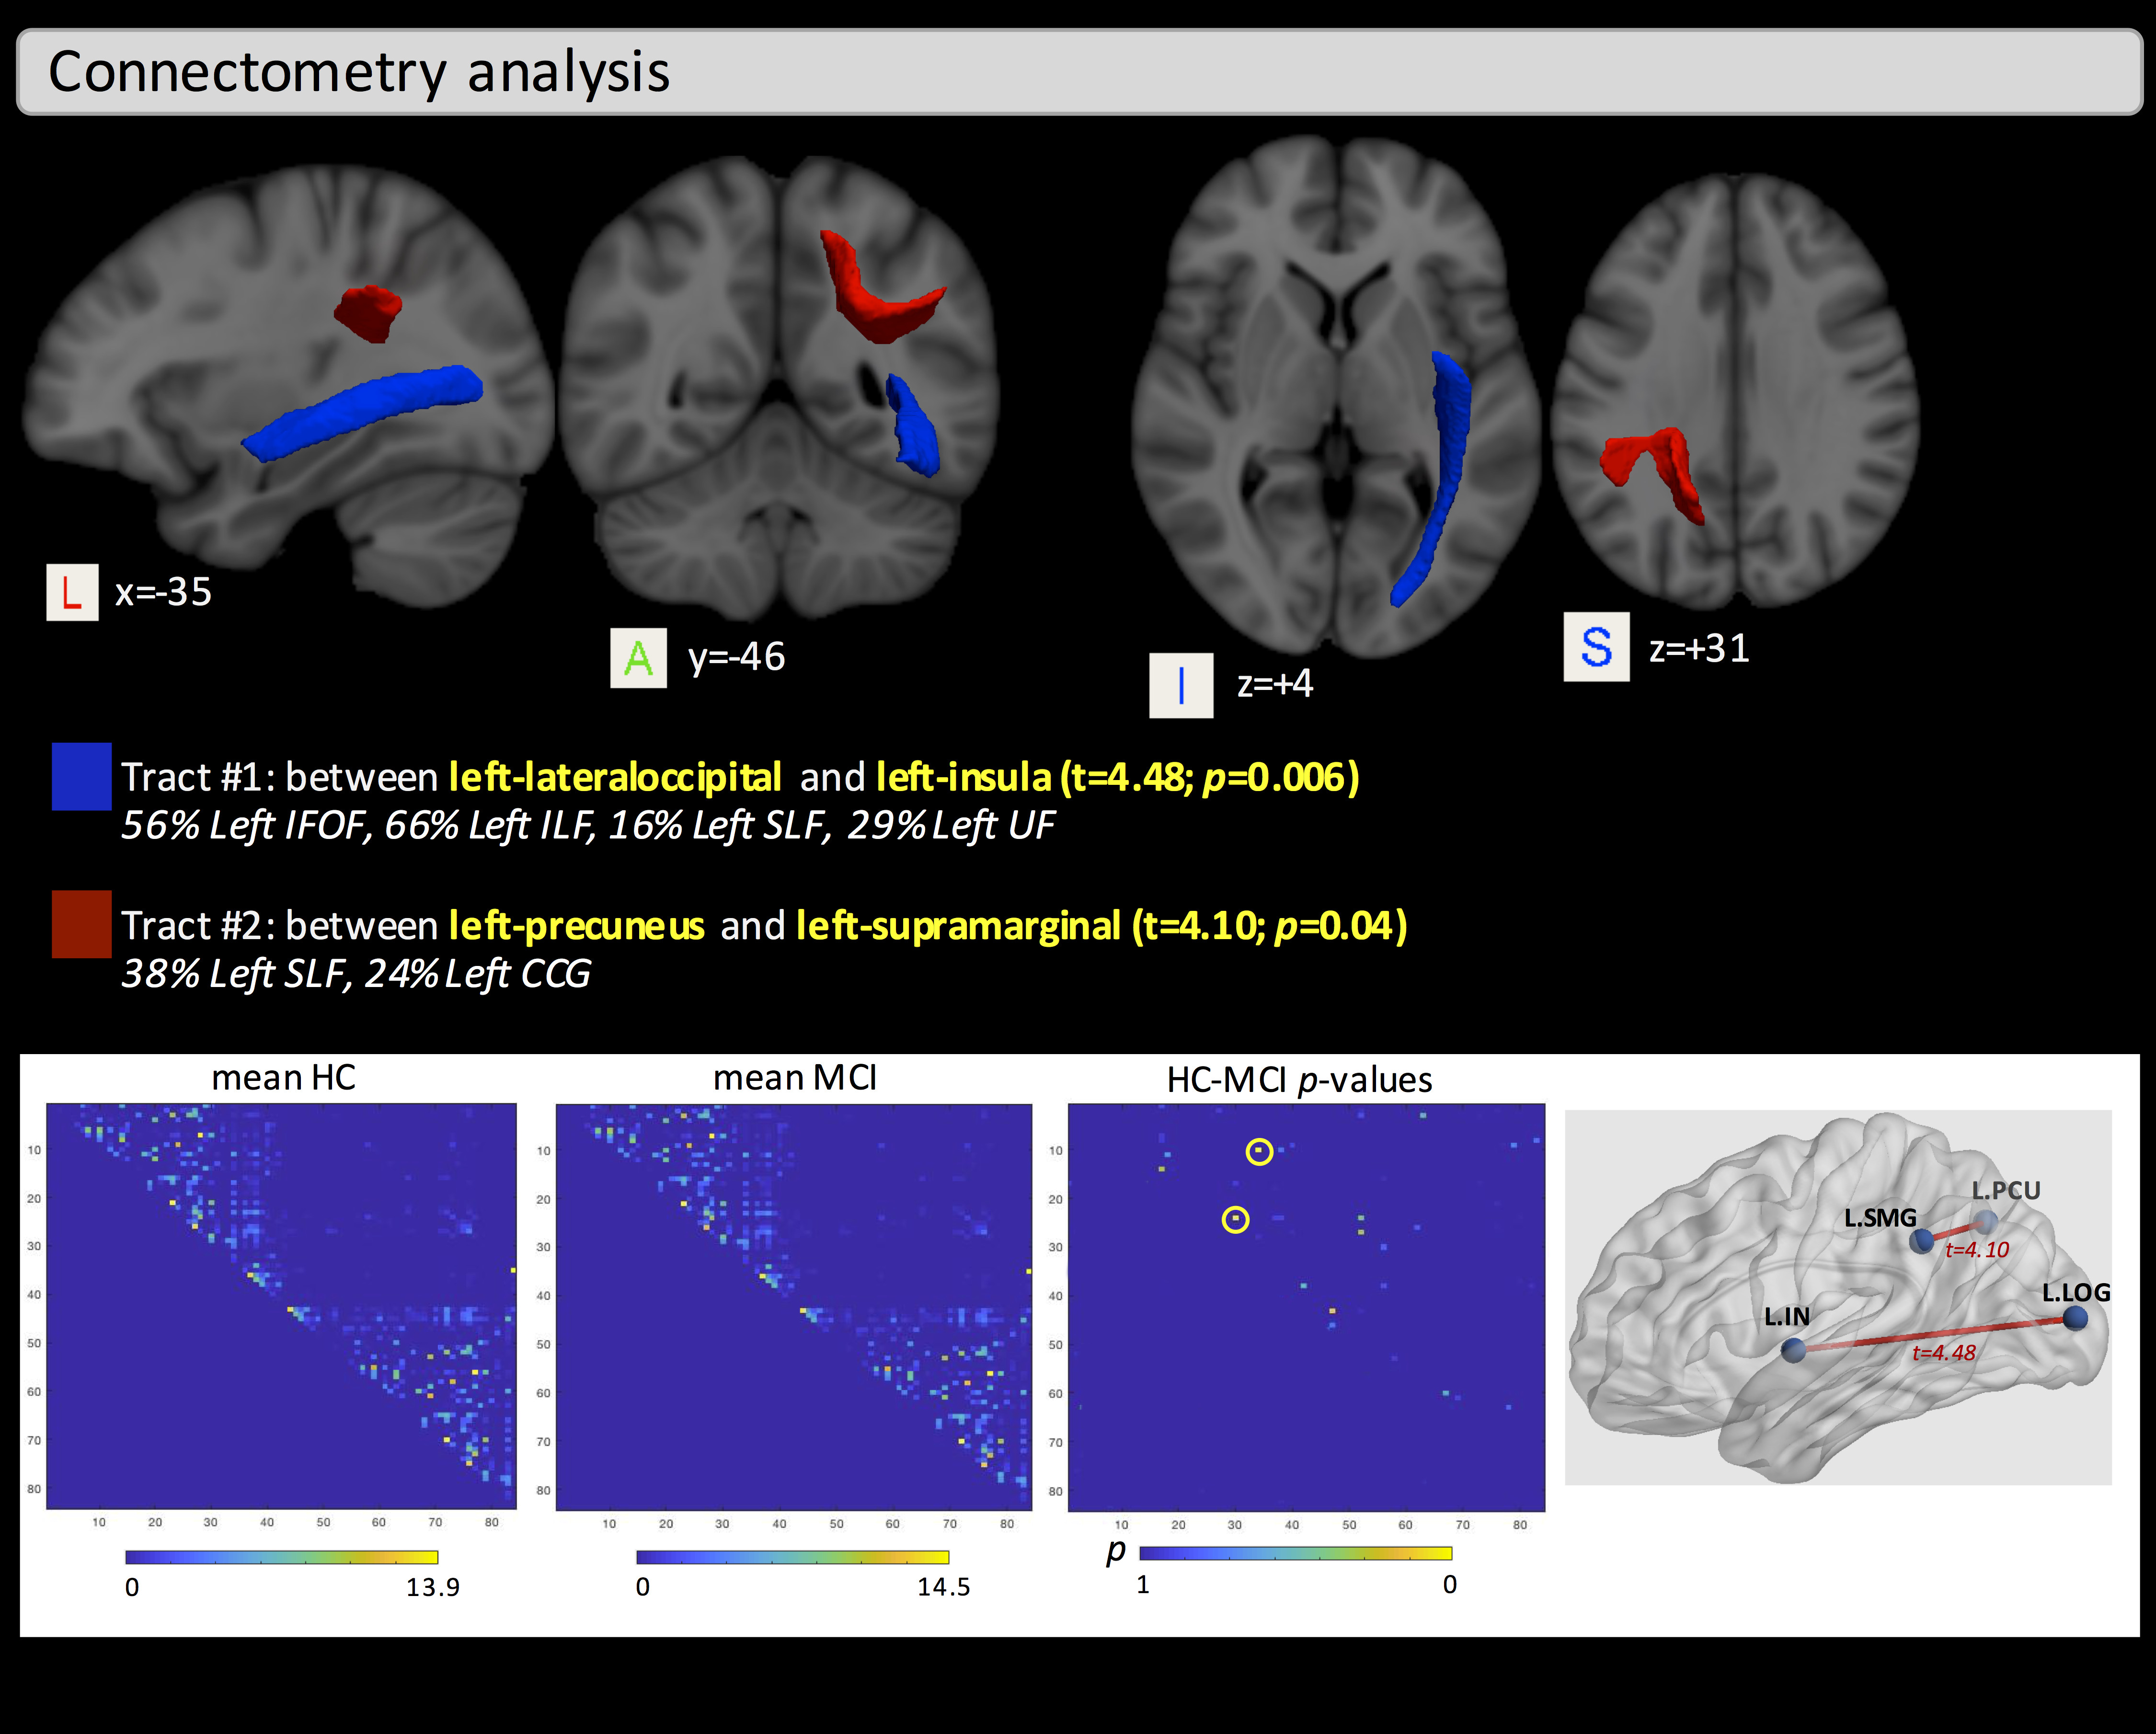
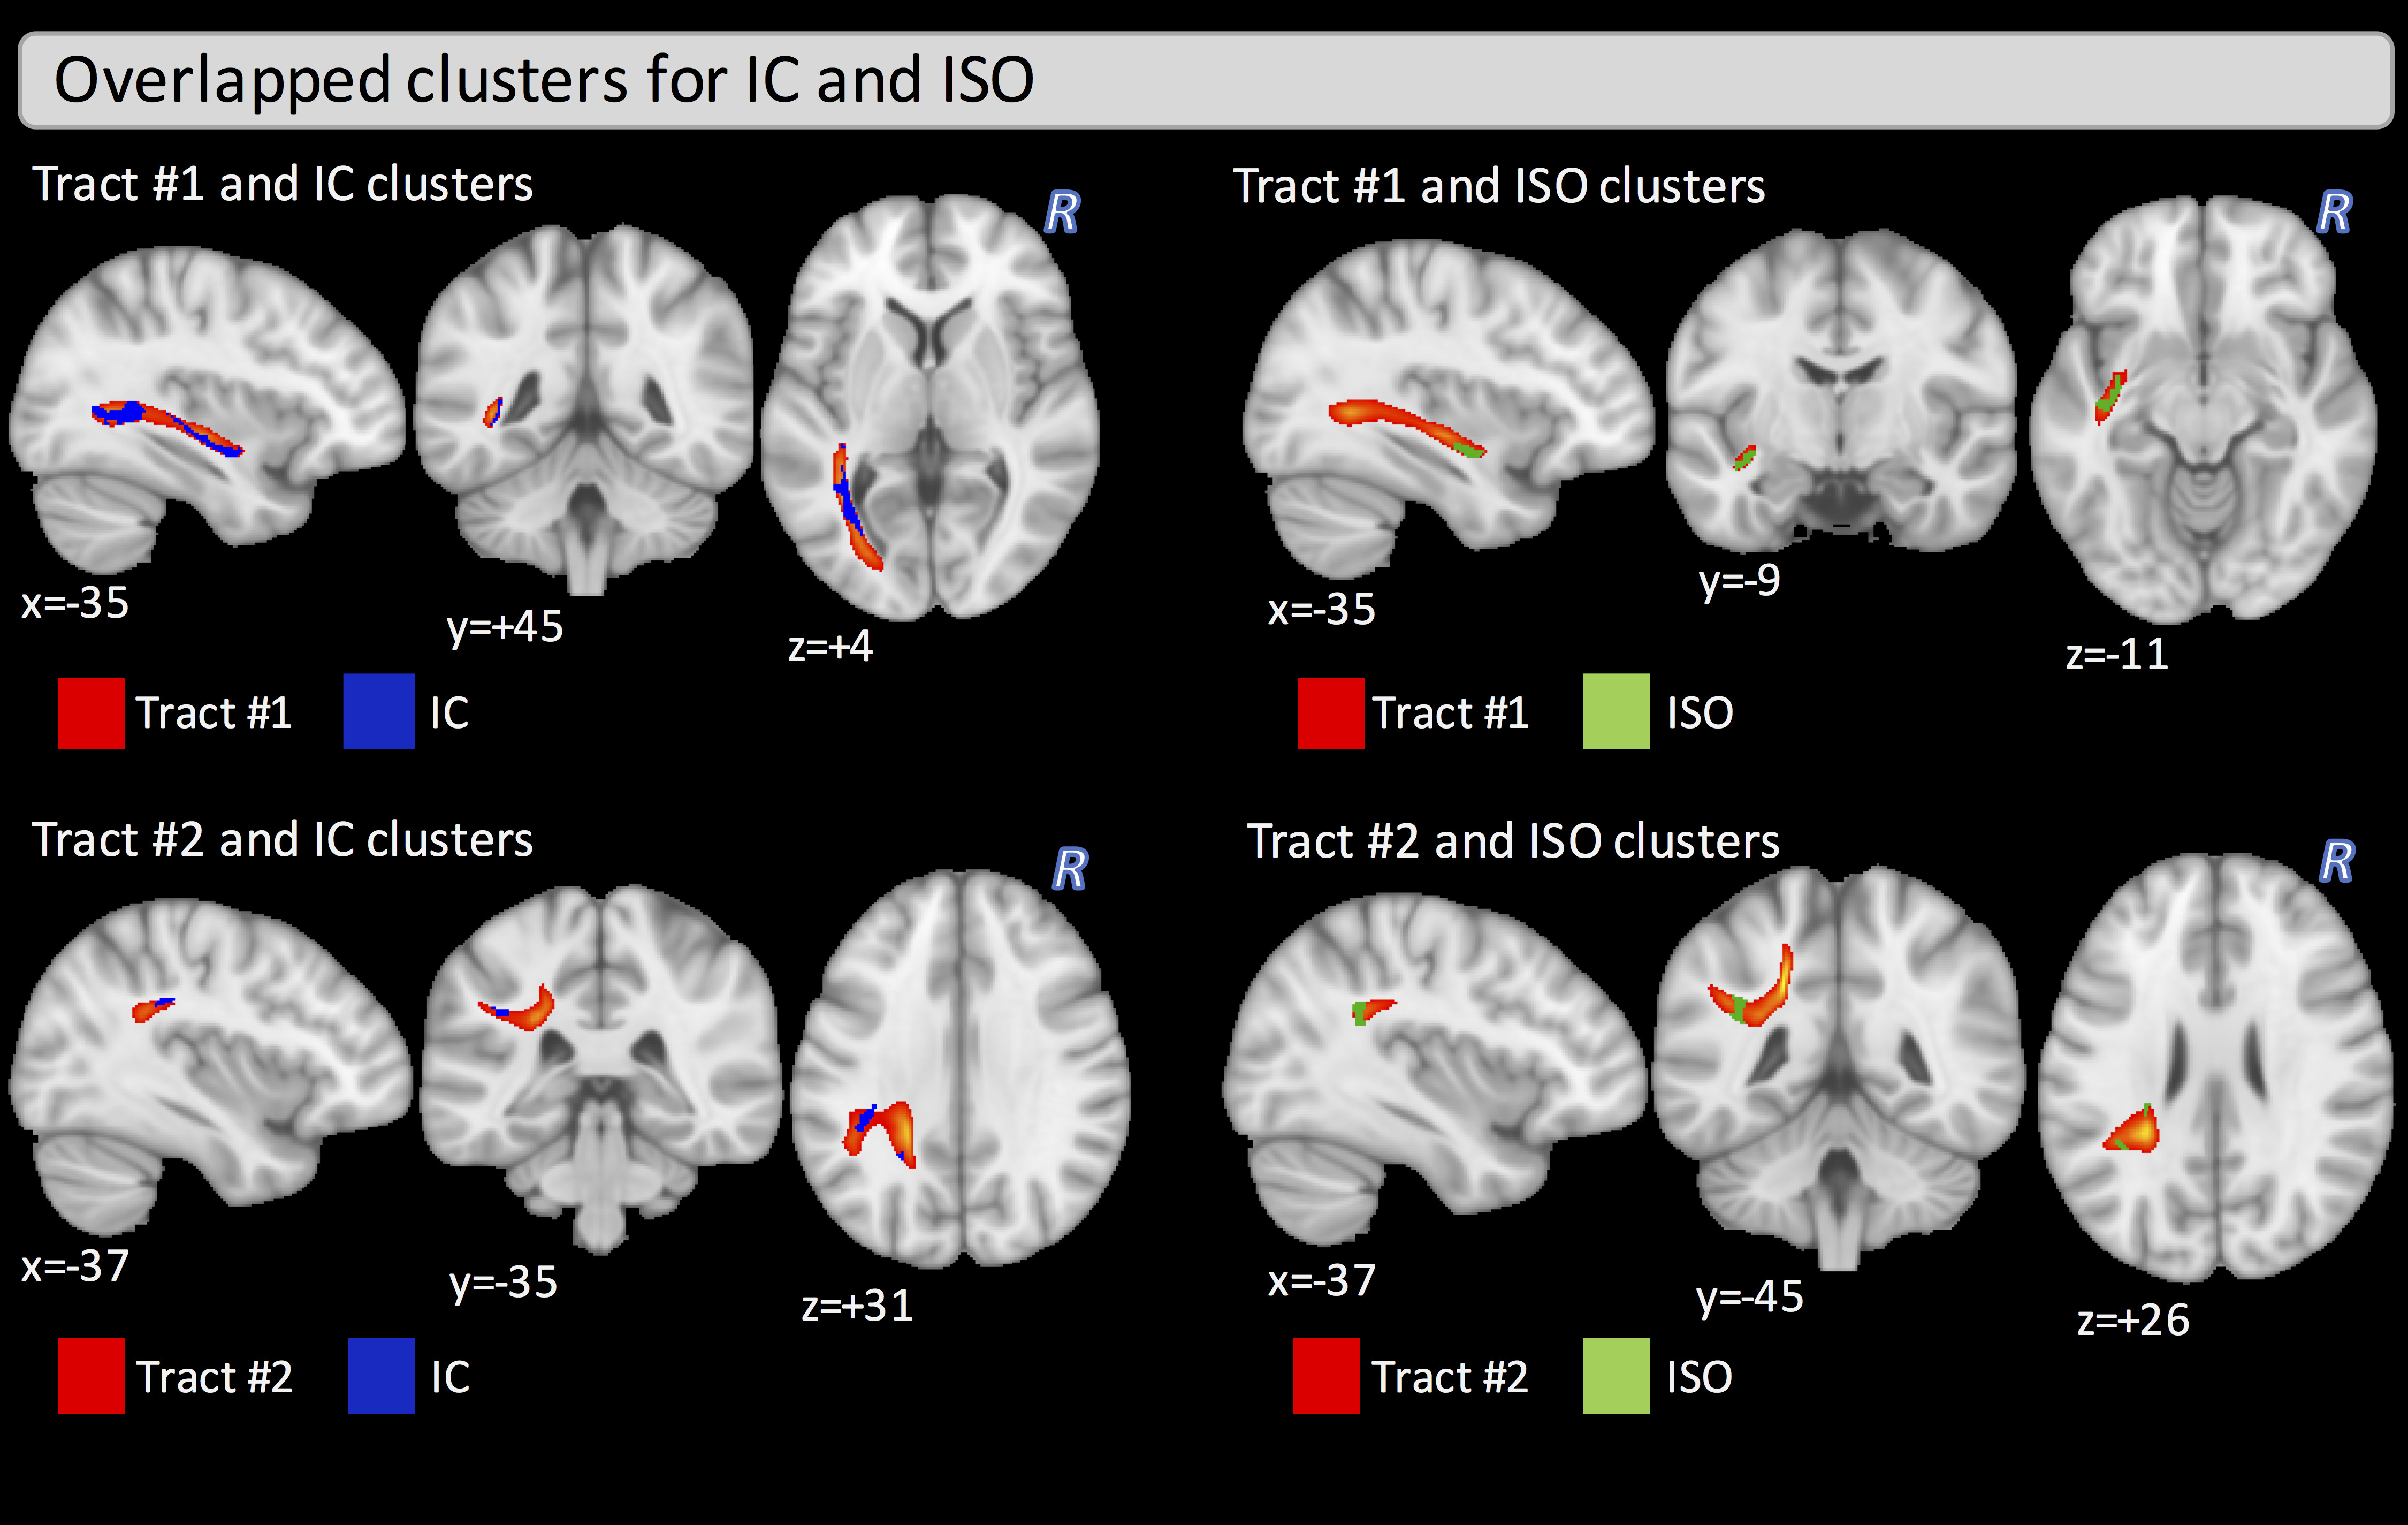
The two groups did not differ significantly in age (t-test: t=-0.80, p=0.214) but did differ in MMSE, MoCA, and GDS as expected (Wilcoxon rank-sum test: W=445.4, p=0.0151; W=332, p=0.002; W=141, p<0.001, respectively). VBA found significant clusters of differences between HC and MCI in the fornix for FA (covering 34% of the fornix), as well as in the left part of the anterior thalamic radiation, inferior-fronto occipital fasciculus (IFOF), inferior-longitudinal fasciculus (ILF), uncinated fasciculus (UF), body of corpus callosum, superior corona radiata, and the external capsule for IC and ISO maps. No significant clusters were found for the EC metric (Figure 1). Connectometry analysis found differences between groups in two distinct tracts. One tract (Tract #1) between the left-lateraloccipital and the left-insula (t=4.48, p=0.006), which includes part of the left IFOF and the left ILF, and another tract (Tract #2) between the left-precuneus and the left-supramarginal gyrus (t=4.10, p=0.04), which includes part of the left superior-longitudinal fasciculus (Figure 2). Figure 3 shows the overlapped clusters between the significant FA, IC, and ISO clusters and the two significant tracts. The significant cluster where we found higher IC values in MCI, compared with HC, covers about 33% of the volume of Tract #1.Discussion
In this study, we found significant differences in structural connectivity and WM integrity between HC and MCI. The tracts involved in MCI are part of the left IFOF, the left ILF, and the left SLF. Additionally, compared with the control group, we found lower FA values inside the fornix and lower IC and higher ISO values in several WM brain locations in the MCI group. In this study, the Stick-Zeppelin-Ball model was used to derive the restricted, hindered, and water pool compartments respectively. Additionally, the COMMIT algorithm was used to re-establish the correct link between tractography and tissue microstructure9. COMMIT is a novel approach that improves the reconstructed tractograms by combining them with microstructural properties of the tissue; moreover, this method has never been used to study structural connectivity in MCI. Disruption of WM structural connectivity, which is related to myelinated axonal and synaptic degeneration, has previously been observed in MCI11,12. Moreover, decreased FA values in the fornix is one of the earliest MRI abnormalities observed in MCI who are at an increased risk for AD13. Because the fornix serves a vital role in memory functions, lower FA in this structure may be associated with a decline of memory functions in MCI subjects14.Conclusions
Neuroimaging biomarkers in MCI are critical due to the high conversion of this population to AD. In this study, by using a multi-shell diffusion MRI acquisition and robust processing of DTI data, we detected alterations in WM integrity and structural connectivity in MCI subjects. Therefore, our results demonstrate the potential of these advanced diffusion MRI methods as biomarkers in the study of MCI.Acknowledgements
No acknowledgement found.References
1. Bruscoli M, Lovestone S. Is MCI really just early dementia? A systematic review of conversion studies. International psychogeriatrics. 2004;16(2):129-140.
2. Petersen RC, Doody R, Kurz A, et al. Current concepts in mild cognitive impairment. Archives of neurology. 2001;58(12):1985-1992.
3. Folstein MF, Folstein SE, McHugh PR. "Mini-mental state". A practical method for grading the cognitive state of patients for the clinician. Journal of psychiatric research. 1975;12(3):189-198.
4. Nasreddine ZS, Phillips NA, Bédirian V, et al. The Montreal Cognitive Assessment, MoCA: a brief screening tool for mild cognitive impairment. Journal of the American Geriatrics Society. 2005;53(4):695-699.
5. Reisberg B, Ferris SH, de Leon MJ, Crook T. The Global Deterioration Scale for assessment of primary degenerative dementia. The American journal of psychiatry. 1982;139(9):1136-1139.
6. Tournier JD, Smith R, Raffelt D, et al. MRtrix3: A fast, flexible and open software framework for medical image processing and visualisation. NeuroImage. 2019;202:116137.
7. Jenkinson M, Beckmann CF, Behrens TE, Woolrich MW, Smith SM. FSL. NeuroImage. 2012;62(2):782-790.
8. Willats L, Raffelt D, Smith RE, Tournier JD, Connelly A, Calamante F. Quantification of track-weighted imaging (TWI): characterisation of within-subject reproducibility and between-subject variability. NeuroImage. 2014;87:18-31.
9. Daducci A, Dal Palù A, Lemkaddem A, Thiran JP. COMMIT: Convex optimization modeling for microstructure informed tractography. IEEE transactions on medical imaging. 2015;34(1):246-257.
10. Panagiotaki E, Schneider T, Siow B, Hall MG, Lythgoe MF, Alexander DC. Compartment models of the diffusion MR signal in brain white matter: a taxonomy and comparison. NeuroImage. 2012;59(3):2241-2254.
11. Hojjati SH, Ebrahimzadeh A, Babajani-Feremi A. Identification of the Early Stage of Alzheimer's Disease Using Structural MRI and Resting-State fMRI. Frontiers in neurology. 2019;10:904.
12. Mallio CA, Schmidt R, de Reus MA, et al. Epicentral disruption of structural connectivity in Alzheimer's disease. CNS neuroscience & therapeutics. 2015;21(10):837-845.
13. Kantarci K. Fractional anisotropy of the fornix and hippocampal atrophy in Alzheimer's disease. Frontiers in aging neuroscience. 2014;6:316.
14. Yu J, Lee TMC. Verbal memory and hippocampal volume predict subsequent fornix microstructure in those at risk for Alzheimer's disease. Brain imaging and behavior. 2020;14(6):2311-2322
Figures