1924
Multimodal MR imaging reveals distinct sensitivity of hippocampal subfields to normal aging and asymptomatic Alzheimer's disease pathology1Department of Radiology and Imaging Sciences, Emory University School of Medicine, Atlanta, GA, United States, 2Department of Neurology, Emory University School of Medicine, Atlanta, GA, United States, 3Department of Radiology and Imaging Sciences, Indiana University School of Medicine, Indianapolis, IN, United States, 4Department of Biostatistics and Bioinformatics, Emory University Rollins School of Public Health, Atlanta, GA, United States, 5Center for Visual and Neurocognitive Rehabilitation, Atlanta VA Medical Center, Decatur, GA, United States, 6Joint Department of Biomedical Engineering, Emory University and Georgia Institute of Technology, Atlanta, GA, United States
Synopsis
Using structural, resting-state functional and diffusion MRI, we report that normal aging affects functional connectivity and tissue microstructure in all hippocampal subfields, while the subiculum and CA1-3 exhibit the greatest sensitivity to asymptomatic Alzheimer’s disease pathology with CA1-3 hyperconnectivity. The imaging measures correlate with neuropsychological performance and CSF tau.
Introduction
Hippocampal atrophy is a well-observed phenomenon in both normal aging and Alzheimer’s disease (AD), with its subfields demonstrating differential vulnerabilities. However, these changes only become prominent at a late stage of aging or AD. Identifying early signs of brain changes in both normal aging and the asymptomatic phase of AD pathology could both shed light on neurodegeneration processes and provide predictive biomarkers for patients when effective AD treatments become available. It is suggested that functional and diffusion MRI can reveal synaptic and microstructural aberrances very early in the AD cascade, before gross anatomical abnormality and cognitive decline 1, 2. In this study, we investigated alterations in morphometry, intrinsic functional connectivity, and tissue microstructure of hippocampal subfields in both normal aging and asymptomatic elderly with positive AD pathology assessed by cerebrospinal fluid (CSF) biomarkers.Methods
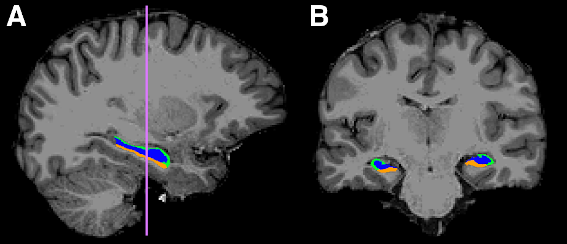
A total of 112 subjects including 40 healthy young adults (HY) (age = 26.1 ± 3.7 years), 47 healthy older adults with negative CSF biomarker status (HO-) of AD (age = 65.9 ± 4.8 years), and 25 healthy older adults with positive CSF biomarker status (HO+) (age = 69.7 ± 5.6 years) were included in this study. T1-weighted anatomical, high-resolution resting-state functional, and diffusion MRI images were acquired on a Siemens Magnetom Prisma 3T scanner (Siemens Healthcare, Erlangen, Germany). Hippocampal subfield ROIs including the subiculum, CA1-3, and CA4-dentate gyrus (DG) were extracted from T1-weighted images (Fig 1) using FreeSurfer 6.0. Hippocampal volume and estimated total intracranial volume (eTIV) were also calculated from the FreeSurfer segmentation. Bilateral hippocampal volumes were averaged and normalized to eTIV. Hippocampal subfield functional connectivity was identified using a seed-based analysis method on the functional MRI images. Microstructure parameters, including neurite density index (NDI), orientation dispersion index (ODI) and volume fraction of isotropic water diffusion (Viso) were estimated on the diffusion MRI data according to neurite orientation dispersion and density imaging (NODDI) model 3.Amyloid-β 1-42 (Aβ), total tau (T-tau), and tau phosphorylated at threonine 181 (P-tau) were measured in the cognitively normal elderly from CSF samples. A standardized neuropsychological test battery was administered, including the Montreal Cognitive Assessment (MoCA) for overall cognitive status, Free and Cued Selective Reminding Test (FCSRT) for verbal episodic memory, Rey Complex Figure Test (RCFT) for visual memory and visuospatial functioning, Judgment of Line Orientation (JoLO) for visuospatial ability, Letter Fluency (FAS) for language and executive functioning, Animal Fluency for language and semantic memory, Trail Making Test Part A (TMTA) for processing speed, and Trail Making Test Part B (TMTB) for executive functioning.
Results
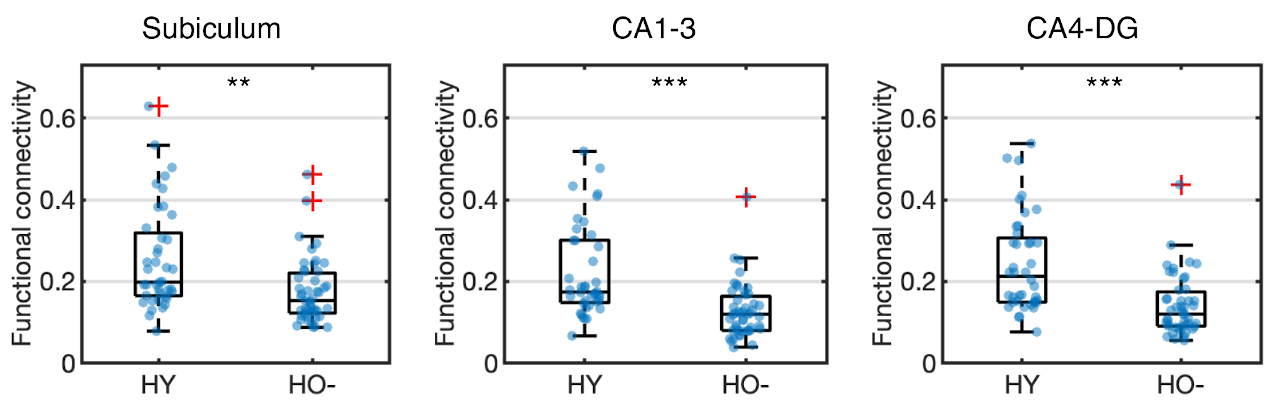
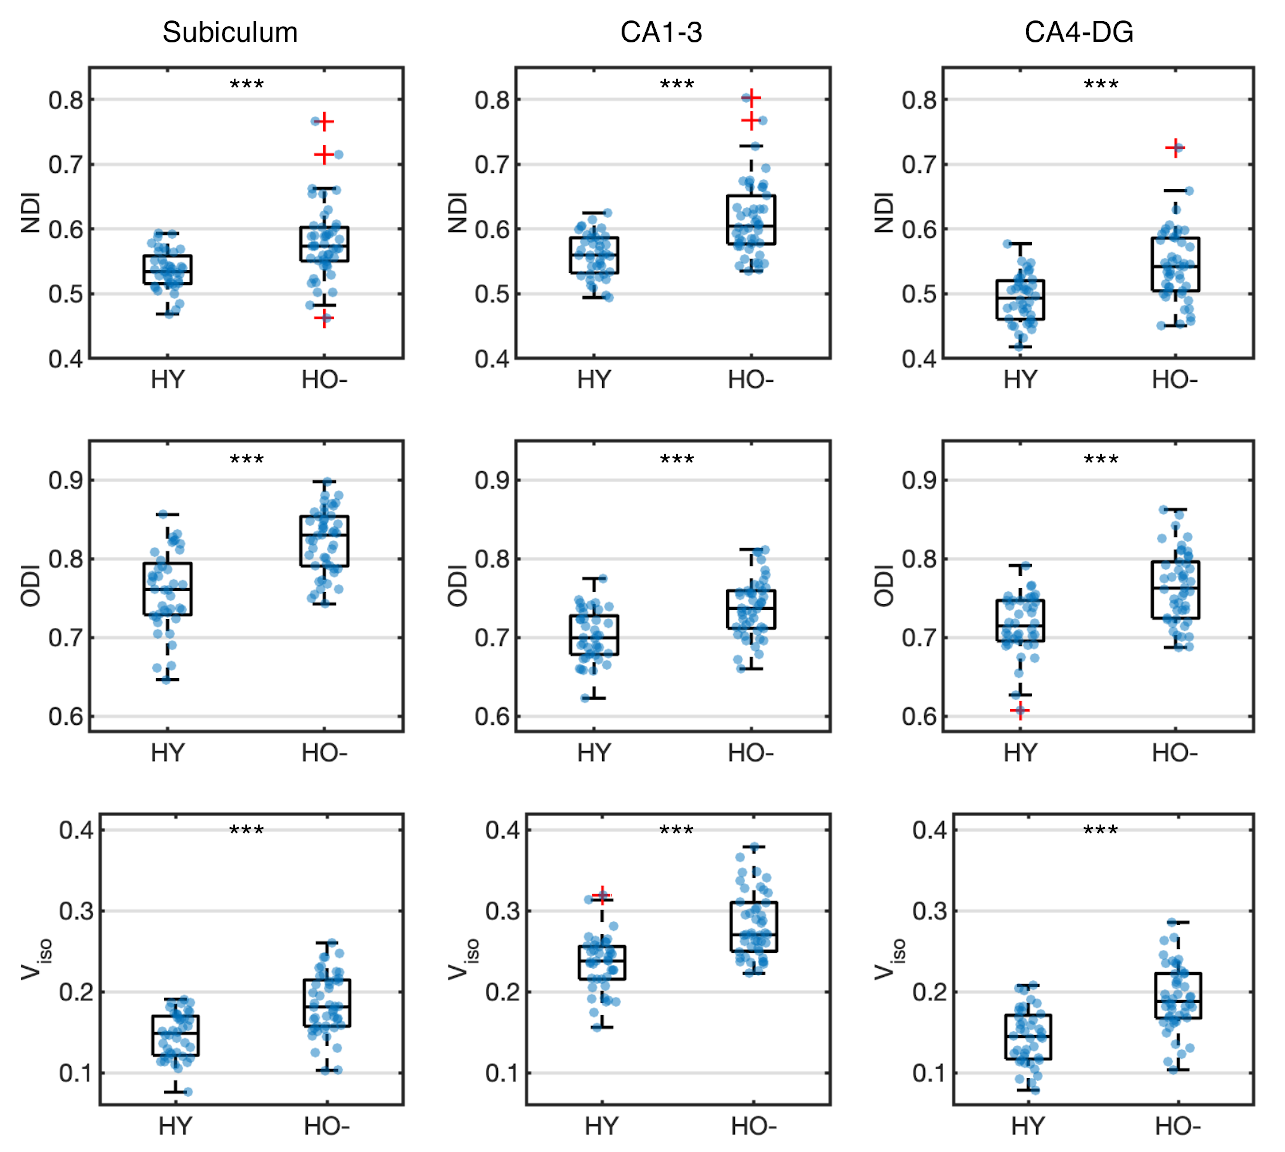
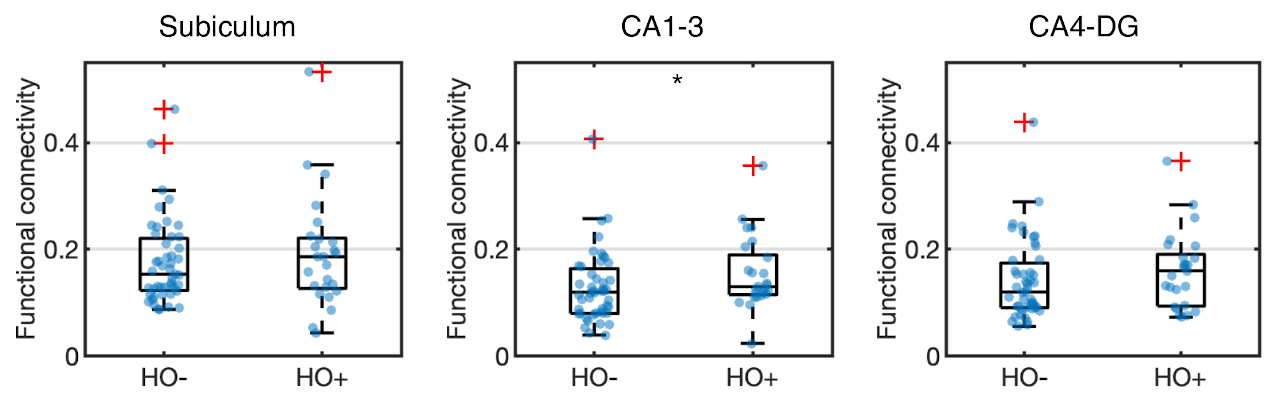
Compared to HY, HO- showed reduced functional connectivity (Fig 2) and increased NODDI measures (Fig 3) in all hippocampal subfields (P < 0.005), after adjusting for the effects of sex, normalized hippocampal volume and eTIV.In comparison with HO-, HO+ showed decreased volume in the whole hippocampus (P = 0.031) and the subiculum (P = 0.001) after adjusting for the effects of age and sex. Increased CA1-3 connectivity was observed in HO+ compared to HO- (P = 0.040) after controlling for the effects of age, sex, normalized whole hippocampal volume and eTIV (Fig 4). No significant differences in microstructure metrics were observed between HO- and HO+ in the hippocampus.
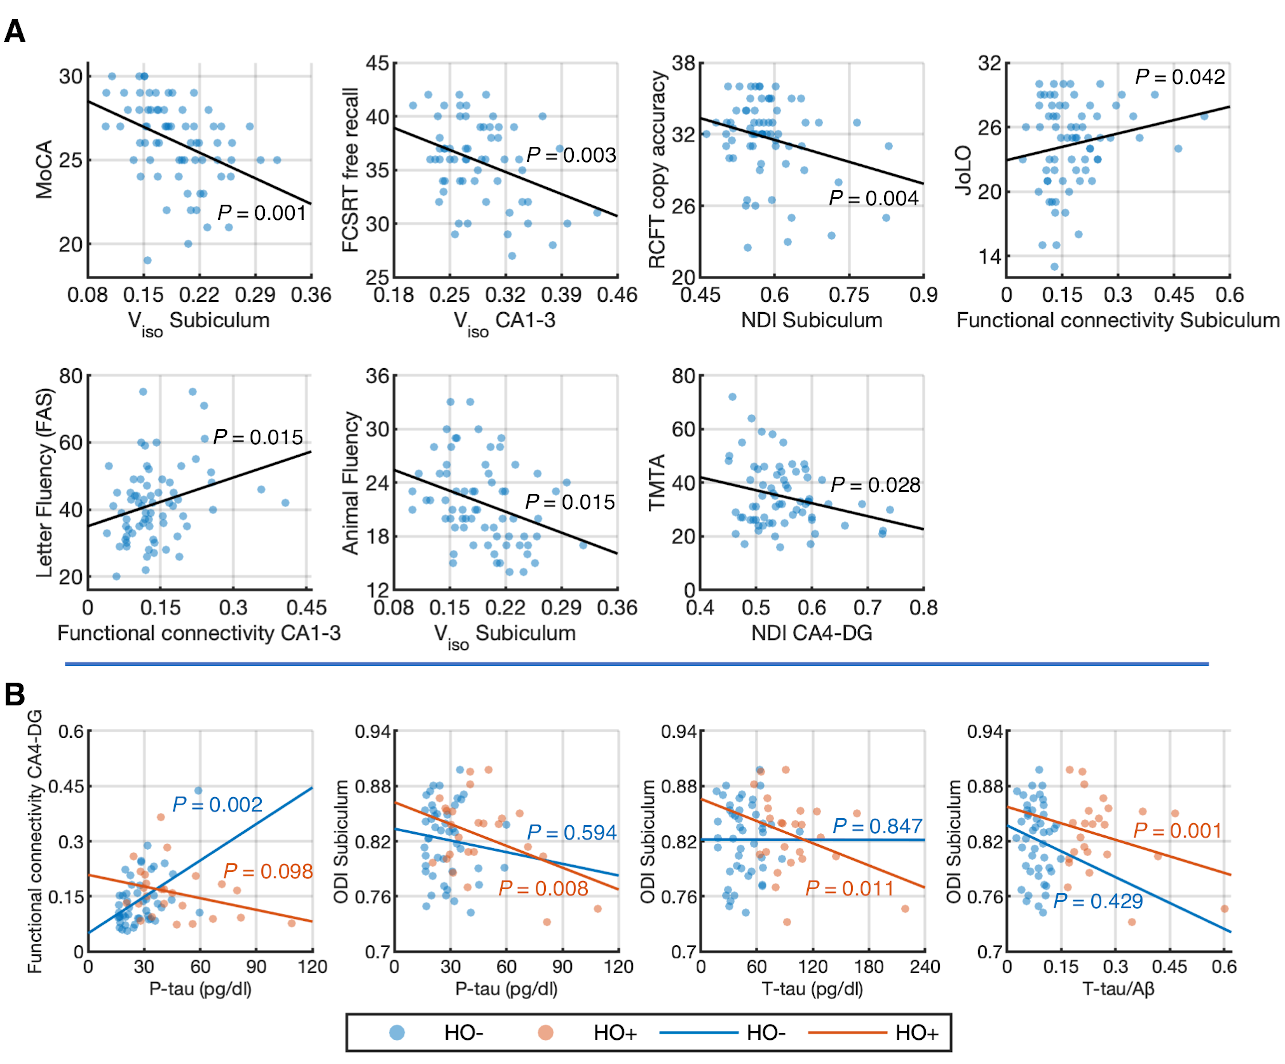
Controlling for the effects of age, sex, normalized whole hippocampal volume and eTIV, partial correlation analyses showed significant negative correlations between Viso in the subiculum and the MoCA (r = -0.414, P = 0.001), between Viso in CA1-3 and FCSRT free recall (r = -0.392, P = 0.003), between NDI in the subiculum and RCFT copy accuracy score (r = -0.351, P = 0.004), between Viso in the subiculum and Animal Fluency (r = -0.304, P = 0.015), and between NDI in CA4-DG and the TMTA score (r = -0.273, P = 0.028), as well as positive correlations between functional connectivity in the subiculum network and JoLO (r = 0.251, P = 0.042), and between functional connectivity in CA1-3 network and Letter Fluency (FAS) (r = -0.273, P = 0.028) (Fig 5A).
Controlling for the effects of age, sex, normalized whole hippocampal volume and eTIV, partial correlation analyses showed significant positive correlation between CA4-DG network connectivity and P-tau (r = 0.469, P = 0.002) in HO-, as well as negative correlations of ODI in the subiculum with P-tau (r = -0.56, P = 0.008), T-tau (r = -0.545, P = 0.011) and T-tau/Aβ ratio (r = -0.657, P = 0.001) in HO+ (Fig 5B).
Discussion and Conclusion
Our results indicate that normal aging affects connectivity and microstructure in all hippocampal subfields while the subiculum and CA1-3 demonstrate the greatest sensitivity to asymptomatic AD pathology with hyperconnectivity in the CA1-3 network. Furthermore, tau, rather than amyloid-β, closely correlates with synaptic and microstructural measures in hippocampal subfields in the asymptomatic stage of AD. Thus, functional connectivity and tissue microstructure in hippocampal subfields may serve as promising biomarkers for early detection and prognosis of AD.Acknowledgements
No acknowledgement found.References
1. Sperling RA, Aisen PS, Beckett LA, Bennett DA, Craft S, Fagan AM, et al. Toward defining the preclinical stages of alzheimer’s disease: Recommendations from the national institute on aging-alzheimer's association workgroups on diagnostic guidelines for alzheimer's disease. Alzheimer's & Dementia. 2011;7:280-292
2. ten Kate M, Ingala S, Schwarz AJ, Fox NC, Chételat G, van Berckel BNM, et al. Secondary prevention of alzheimer’s dementia: Neuroimaging contributions. Alzheimer's Research & Therapy. 2018;10:112
3. Zhang H, Schneider T, Wheeler-Kingshott CA, Alexander DC. Noddi: Practical in vivo neurite orientation dispersion and density imaging of the human brain. NeuroImage. 2012;61:1000-1016
Figures