1923
The DKI value in detecting microstructural white matter alterations in Alzheimer's disease and amnestic mild cognitive impairment: A TBSS study1First Central Clinical College, Tianjin Medical University, Tianjin, China, 2Tianjin Medical University General Hospital, Tianjin, China, 3MR Collaboration, Siemens Healthcare Ltd, Beijing, China, 4Department of Radiology, China-Japan Friendship Hospital, Beijing, China, 5Department of Radiology, Tianjin First Central Hospital, Tianjin, China
Synopsis
Previous studies that used diffusion kurtosis imaging to study Alzheimer's disease (AD) mostly analyzed data based on regions of interest method, which may be biased by subjectivity. This study used Tract-based Spatial Statistics (TBSS) method to analyze the DKI data and found that kurtosis fractional anisotropy (KFA) values outperformed other DKI-derived parameters in sensitive detection of microstructural white matter damage for early diagnosis of amnestic mild cognitive impairment (aMCI) and AD.
Introduction and Purpose
Early diagnosis and treatment of Alzheimer's disease (AD) and amnestic mild cognitive impairment (aMCI) are crucial in slowing down the progression of dementia. Previous studies have shown that white matter changes characterized by diffusion kurtosis imaging (DKI) technique are promising in vivo biomarkers associated with the progression of AD pathology[1]. However, most of these studies analyzed data based on regions of interest (ROI) method or voxel-based analyses(VBAs)[2], which may be biased by strong subjectivity, poor repeatability or different choice of smoothing kernel and cluster size. Tract-based Spatial Statistics (TBSS) is a voxel whole-brain analytic method that extracts fiber skeletons to study white matter changes that reflect real data changes[3]. This method, thereby, avoids the drawbacks of DKI data analyses based on ROIs and VBAs. The purpose of this study was to assess the value of DKI using TBSS method in detecting the microstructural white matter alterations for the early accurate diagnosis of aMCI and AD.Material and Methods
This study enrolled 45 AD patients, 42 aMCI patients and 35 age and gender-matched healthy controls (HC). All participants were scanned on a MAGNETOM Prisma 3T MR scanner (Siemens Healthcare, Erlangen, Germany) equipped with a 64-channel head-neck coil using spin echo planar imaging (SE-EPI) diffusion sequence (TR/TE = 3800/72 ms, FOV = 220×220 mm2, voxel = 2.0×2.0×2.2 mm3, matrix = 110×110, slices = 60, simultaneous multi-slice acquisition (SMS) acceleration factor = 2, b = 0/2000/3000 s/mm2, directions = 64) and 3D T1 MPRAGE (TR/TE=1550/2.98 ms, flip angle = 9°, FOV = 256×256 mm2, voxel = 1.0×1.0×1.0 mm3, slices=176).The differences of DKI-derived parameters, including kurtosis fractional anisotropy (KFA), mean kurtosis (MK), fractional anisotropy (FA) and mean diffusivity (MD), were compared across the three groups using TBSS method with one-way ANOVA. Correlation between the altered DKI-derived parameters and mini-mental state examination (MMSE) and Montreal cognitive assessment (MoCA) scores were analyzed with SPSS 22.0 software by Spearman test. A receiver operating characteristic curve (ROC) analysis was performed to evaluate the diagnostic performance of different parameters in white matter tracts with the strongest correlation using MedCalc (Version 19.2; MedCalc Software, Mariakerke, Belgium).
Results
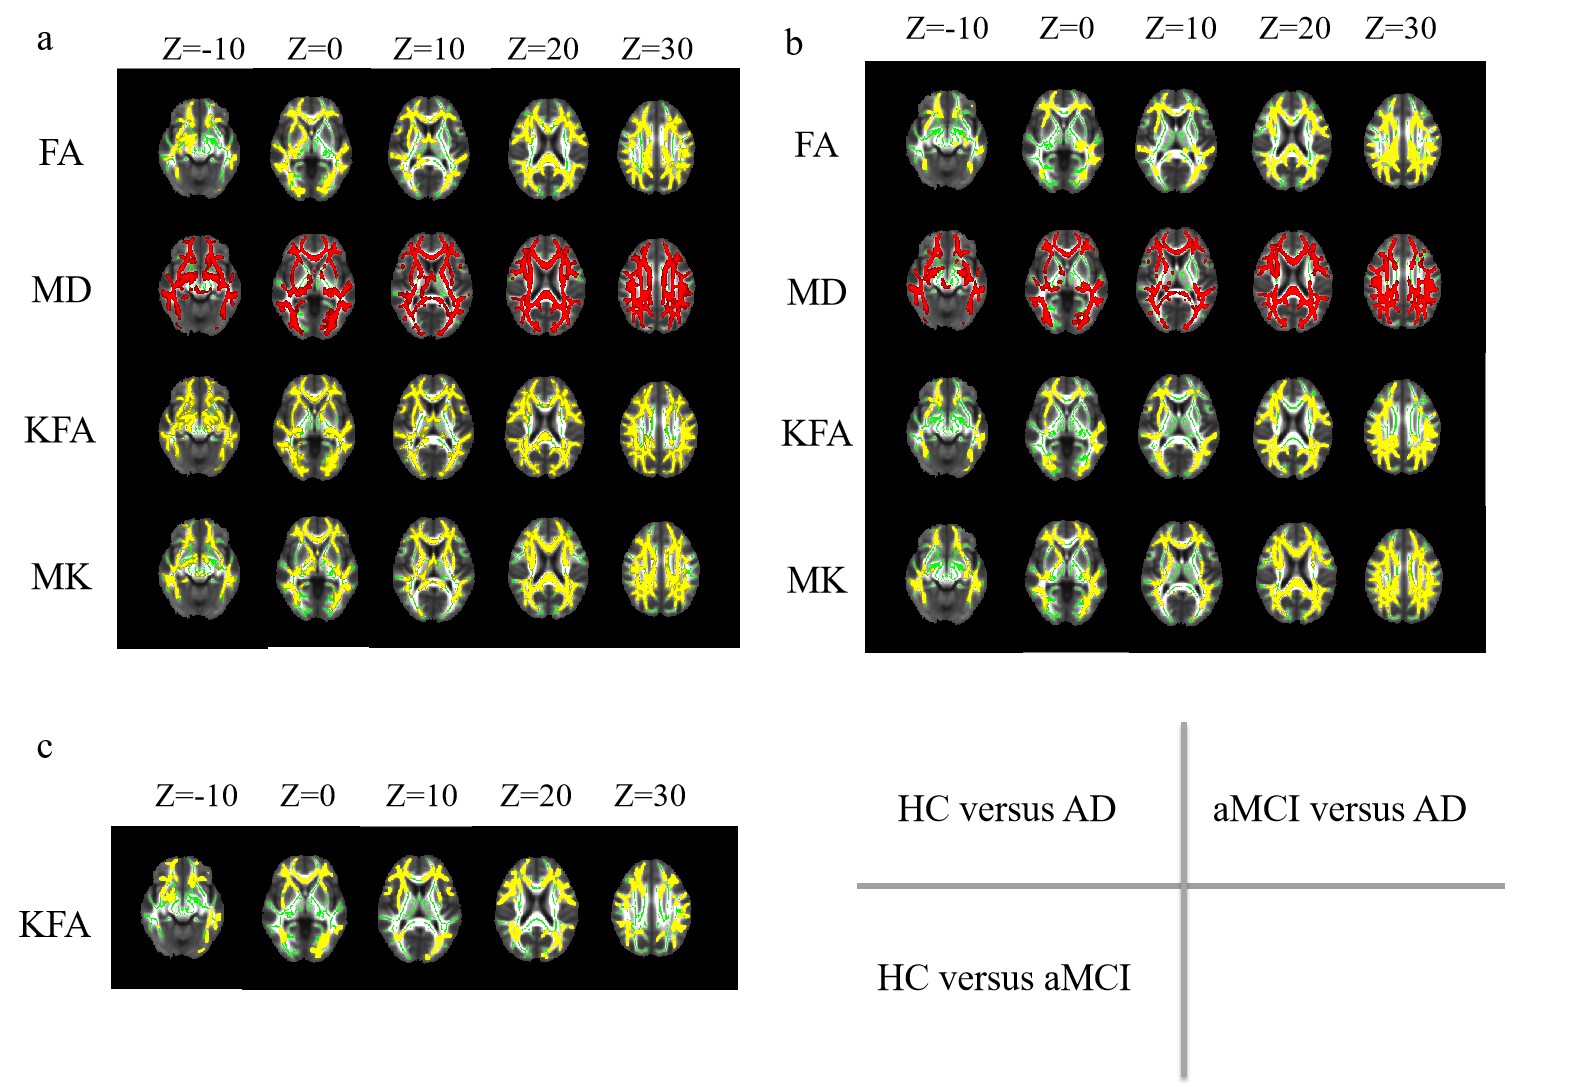
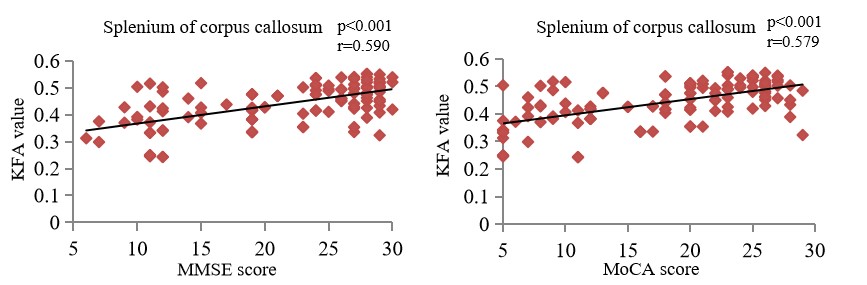
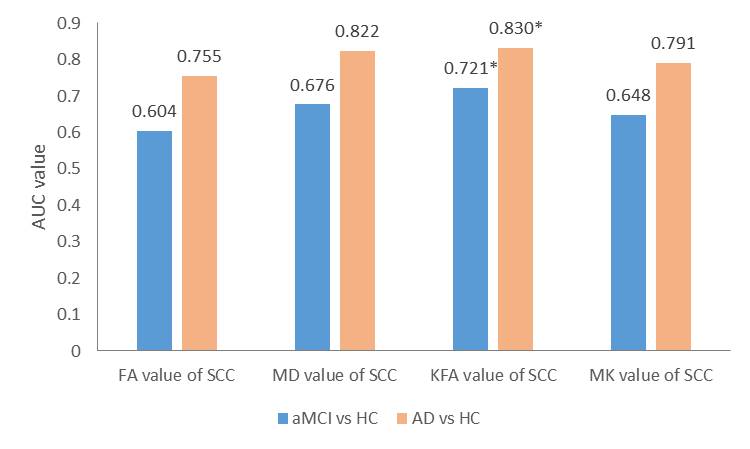
Compared with both HC and aMCI (Fig 1. a&b), the FA, KFA, MK values decreased significantly and the MD value increased significantly in the AD group (p<0.01, TFCE-corrected).However, only the KFA value significantly decreased in the aMCI group compared with HC in brain areas (Fig 1. c) such as the corpus callosum, bilateral posterior thalamic radiation, bilateral external capsule and others (p<0.01, threshold-free cluster enhancement (TFCE)-corrected). No significant differences were found in FA, MD and MK values between aMCI and HC. As shown in Figure 2, the KFA values of splenium of corpus callosum (r=0.590 p<0.001) showed the strongest correlations with the MMSE scores. The KFA values of splenium of corpus callosum (r=0.579 p<0.001) showed the strongest correlations with the MoCA scores. For the diagnosis of both aMCI and AD, the area under the ROC curve (AUC) of the KFA value of the splenium of corpus callosum was the highest (AUC=0.721, AUC=0.830) (Figure 3).
Discussion and Conclusion
This study found that only the KFA values of multi-fiber were significantly lower in aMCI group compared with HC, suggesting that KFA value outperforms FA, MD and MK parameters in detecting the early white matter changes and may potentially act as a more sensitive biomarker for early diagnosis of aMCI and AD. Moreover, decreases in FA and MK values of multiple white matter structures and increases in MD values were observed in the AD group in comparison with both aMCI and HC in addition to the decreased KFA values, suggesting that white matter damage was progressively aggravated during the disease progression. Additionally, the correlation analysis with neuropsychological scores and ROC analysis suggest that DKI parameters could effectively predict the clinical cognitive status and the KFA value of the splenium of corpus callosum may be the excellent indicator for the early diagnosis of aMCI and AD.Acknowledgements
No acknowledgement found.References
[1]. Yuan, L., et al., Non-Gaussian diffusion alterations on diffusion kurtosis imaging in patients with early Alzheimer's disease. Neurosci Lett, 2016. 616: p. 11-8.
[2]. Hansen, B. and S.N. Jespersen, Kurtosis fractional anisotropy, its contrast and estimation by proxy. Sci Rep, 2016. 6: p. 23999.
[3]. Smith, S.M., et al., Tract-based spatial statistics: voxelwise analysis of multi-subject diffusion data. Neuroimage, 2006. 31(4): p. 1487-505.
Figures