1922
Assessing White Matter Microstructural Changes Associated with Aging & Dementia using Mean Apparent Propagator (MAP) MRI1Department of Medical Physics, University of Wisconsin Madison, Madison, WI, United States, 2Department of Pediatrics, University of Wisconsin-Madison, Madison, WI, United States, 3Waisman Center, University of Wisconsin Madison, Madison, WI, United States, 4Wisconsin Alzheimer’s Disease Research Center, University of Wisconsin Madison, Madison, WI, United States, 5Geriatric Research Education and Clinical Center, Middleton Memorial VA Hospital, University of Wisconsin-Madison, Madison, WI, United States, 6Department of Psychiatry, University of Wisconsin-Madison, Madison, WI, United States
Synopsis
We implement mean apparent propagator (MAP) MRI to investigate distinct white matter (WM) microstructural changes associated with aging and AD dementia. Age trajectories of MAP MRI parameters extracted from the cingulum, corpus callosum, and superior longitudinal fasciculus reveal evidence for structurally affected axons in aging populations. Return to origin probability (RTOP) and non-Gaussianity (NG) age trajectories are significantly flatter in AD dementia subjects compared to healthy controls, indicating that these measures could serve as markers for WM deterioration characteristic of dementia. Our findings provide an early quantitative framework for identifying specific WM microstructural deficiencies associated with aging and dementia.
Purpose
The degradation of white matter (WM) pathways in the brain is associated with cognitive decline and is observed among adults with Alzheimer’s disease (AD) dementia.1-4 In recent years, AD researchers have identified numerous quantitative MRI measures as potential markers for neurodegeneration in aging populations.5 Correspondingly, many studies have used diffusion tensor imaging (DTI) to document WM deterioration in aging adult brains, reporting decreases in FA and increases in MD, particularly in frontal and temporal regions associated with memory and executive function.6However, the DTI model is fundamentally limited in WM regions populated by crossing fibers, fails to account for more restricted diffusion, and is limited in characterizing specific microstructural changes.7,8
In order to delineate distinct WM microstructural alterations in aging and dementia, we implemented the mean apparent propagator (MAP) MRI model to construct and analyze region-specific age trajectories of an assortment of diffusion parameters among healthy participants as well as those on the continuum of AD dementia, imaged with hybrid diffusion imaging MRI.
Methods
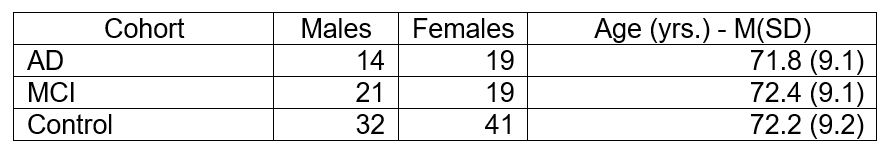
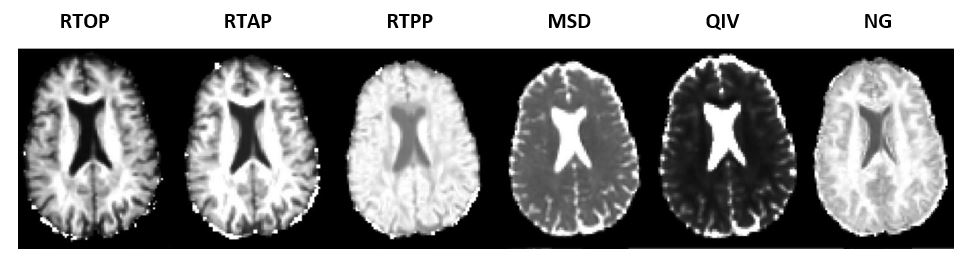
146 participants (33 AD, 40 MCI, and 73 cognitively unimpaired controls) (Table 1) were imaged with a 3-shell (b=500, 800, and 2000 s/mm2) hybrid diffusion imaging (HYDI)9 protocol on a 3T GE scanner. After correcting for noise, Gibbs ringing, susceptibility-induced distortions (via external field maps) and eddy currents,10,11 diffusion tensors were estimated with RESTORE12 using the two shells below 1500 s/mm2 (b = 500 and 800 s/mm2) and standard DTI parameter maps (FA, MD, RD, AxD) were computed. Next, the MAP MRI model13 was applied to the diffusion data with Diffusion Imaging in Python (DIPY) software.14 This entailed fitting the q-space (diffusion) signal to a collection of 6 basis functions (Hermite polynomials) and regularizing corresponding weighting coefficients by minimizing the Laplacian of the reconstructed signal.15 Using the fact that the q-space signal is the Fourier Transform of the diffusion propagator (i.e. the mean apparent propagator - MAP), the estimated coefficients were manipulated to calculate various MAP-based parameters (Figure 1) that convey specific information about the underlying tissue microstructure. Namely: the return to origin probability (RTOP), the return to axis probability (RTAP), the return to plane probability (RTPP), the mean squared displacement (MSD), the Non-Gaussianity (NG), and the q-space inverse variance (QIV).DTI and MAP parameters were warped to MNI 152 1 mm3 space16 using nonlinear registration via FSL’s FNIRT.17 Average values of all diffusion parameters were extracted from 3 WM regions (the corpus callosum, cingulum, and superior longitudinal fasciculus) using the JHU ICBM WM Atlas18 in order to construct age trajectories. Linear regression was implemented to fit these age trajectories to the following linear model:
Diffusion Metric = β0 + β1*(age) + β2*(sex) + β3*(status) + β4*(age*status) + ε
Our model is linear with respect to the age of each subject and includes sex, disease status, and the interaction between age and disease status as covariates.
Results
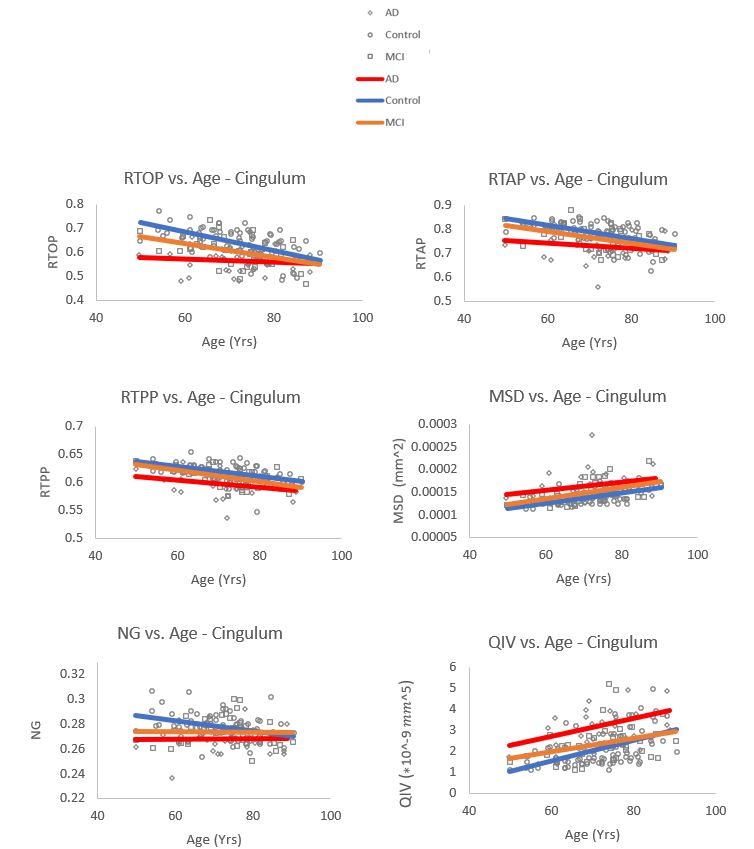
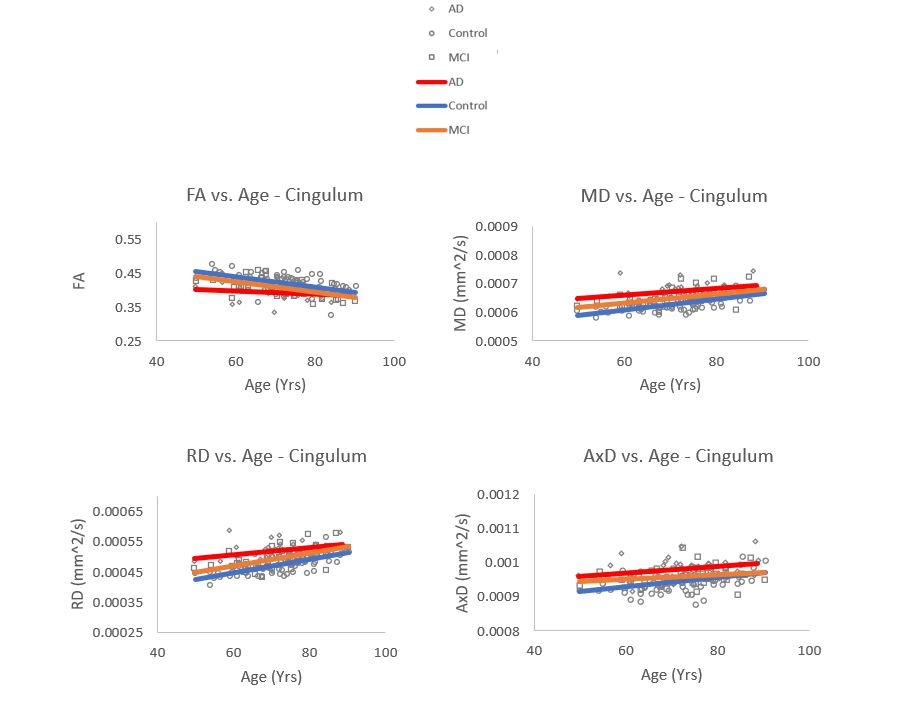
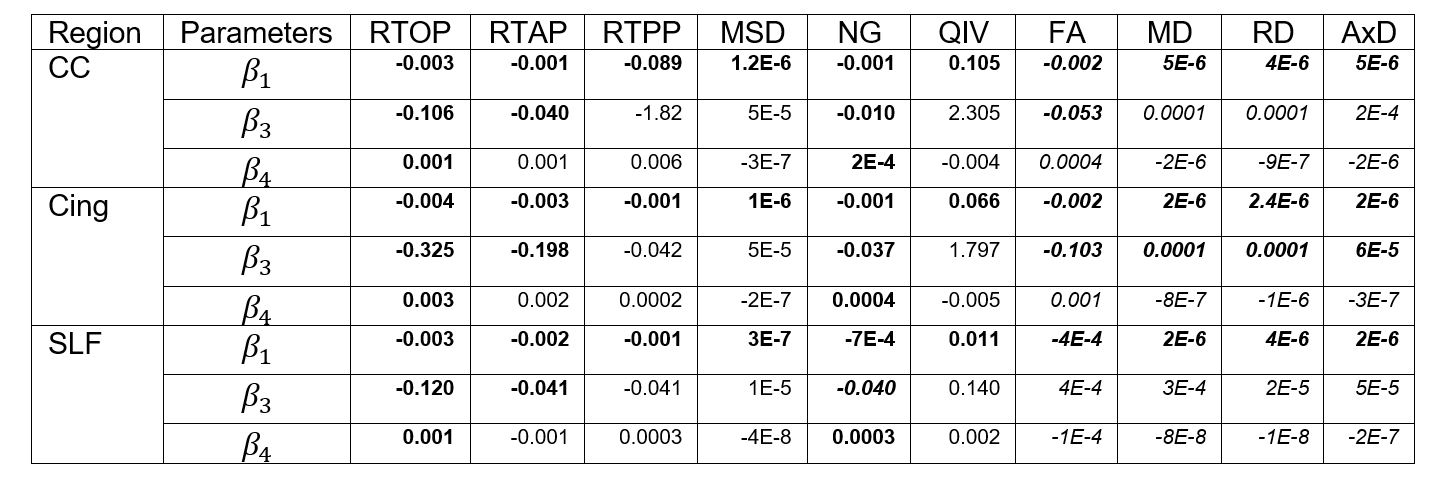
Average age trajectories for DTI and MAP parameters extracted from the cingulum are provided in Figures 2 & 3. Overall, FA, RTOP, RTAP, RTPP, and NG significantly decrease with respect to age (Bonferroni corrected PCorrected <0.05) across all 3 WM regions (Table 2), while MSD, QIV, MD, RD, and AxD significantly increase with age (Table 2). Additionally, AD dementia status (β3) was significant for RTOP, RTAP, and NG and the interaction between age and AD dementia (β4) was significant for RTOP and NG trajectories (AD vs. control) in all three WM regions.Discussion
MAP age trajectories revealed WM microstructural deficiencies that increase with age within three WM tracts previously identified as exhibiting degeneration in DTI-based studies of aging and dementia.19,20 More specifically, RTOP, RTAP, RTPP and NG are all especially sensitive to changes in tissue restriction, and therefore, changes in these parameters with respect to age may indicate axonal degeneration in affected WM tracts.15 This trend is consistent with the observed decreases in FA, along with the increases in MSD, MD, RD, and AxD.Furthermore, the significant effects of AD dementia (β3) in RTOP, RTAP, and NG trajectories as well as the significant interactions between age and AD dementia (β4) in RTOP and NG trajectories, imply that MAP parameters may have the ability to identify WM alterations specific to dementia. In particular, RTOP and NG trajectories in the AD group are markedly flatter than those of the control group, suggesting that these metrics could prove to be useful markers for neurodegenerative WM changes consistent with dementia.
One limitation of our analysis is that we did not consider fluid or molecular imaging of AD pathology, and therefore, a fraction of controls may have underlying undetected AD pathology.21-23 Additionally, data presented here is cross-sectional, which likely limits our ability to precisely model age-related changes in WM microstructure.
Because MAP parameters are derived directly from an estimate of the diffusion propagator, subsequent statistical analyses of MAP age trajectories hold the potential to further characterize specific WM microstructural deficiencies indicative of both healthy aging and AD dementia. Future work will focus on translating this analysis to larger cohorts (which will improve statistical power), incorporating CSF and PET measures of AD pathology, integrating longitudinal data, and employing probabilistic tractography to further assess structural connectivity in aging brains.
Acknowledgements
No acknowledgement found.References
1. De Vos, K. J., Grierson, A. J., Ackerley, S., & Miller, C. C. J. (2008). Role of axonal transport in neurodegenerative diseases. Annual Review of Neuroscience, 31, 151–173. https://doi.org/10.1146/annurev.neuro.31.061307.090711
2. Gold, B. T., Johnson, N. F., Powell, D. K., & Smith, C. D. (2012). White matter integrity and vulnerability to Alzheimer’s disease: Preliminary findings and future directions. Biochimica Et Biophysica Acta, 1822(3), 416–422. https://doi.org/10.1016/j.bbadis.2011.07.009
3. Racine, A. M., Adluru, N., Alexander, A. L., Christian, B. T., Okonkwo, O. C., Oh, J., Cleary, C. A., Birdsill, A., Hillmer, A. T., Murali, D., Barnhart, T. E., Gallagher, C. L., Carlsson, C. M., Rowley, H. A., Dowling, N. M., Asthana, S., Sager, M. A., Bendlin, B. B., & Johnson, S. C. (2014). Associations between white matter microstructure and amyloid burden in preclinical Alzheimer’s disease: A multimodal imaging investigation. NeuroImage. Clinical, 4, 604–614. https://doi.org/10.1016/j.nicl.2014.02.001
4. Teipel, S. J., Grothe, M., Lista, S., Toschi, N., Garaci, F. G., & Hampel, H. (2013). Relevance of magnetic resonance imaging for early detection and diagnosis of Alzheimer disease. The Medical Clinics of North America, 97(3), 399–424. https://doi.org/10.1016/j.mcna.2012.12.013
5. Jack, C. R., Bennett, D. A., Blennow, K., Carrillo, M. C., Dunn, B., Haeberlein, S. B., Holtzman, D. M., Jagust, W., Jessen, F., Karlawish, J., Liu, E., Molinuevo, J. L., Montine, T., Phelps, C., Rankin, K. P., Rowe, C. C., Scheltens, P., Siemers, E., Snyder, H. M., … Contributors. (2018). NIA-AA Research Framework: Toward a biological definition of Alzheimer’s disease. Alzheimer’s & Dementia: The Journal of the Alzheimer’s Association, 14(4), 535–562. https://doi.org/10.1016/j.jalz.2018.02.018
6. Bennett, I. J., Madden, D. J., Vaidya, C. J., Howard, D. V., & Howard, J. H. (2010). Age-Related Differences in Multiple Measures of White Matter Integrity: A Diffusion Tensor Imaging Study of Healthy Aging. Human Brain Mapping, 31(3), 378–390. https://doi.org/10.1002/hbm.20872
7. Alexander, A. L., Lee, J. E., Lazar, M., & Field, A. S. (2007). Diffusion tensor imaging of the brain. Neurotherapeutics : the journal of the American Society for Experimental NeuroTherapeutics, 4(3):316–329
8. Jones DK, Thomas KR, Turner R. (2013). White matter integrity, fiber count, and other fallacies: The do’s and don’ts of diffusion MRI. NeuroImage. 73:239-254.
9. Wu, Y. C., & Alexander, A. L. (2007). Hybrid diffusion imaging. NeuroImage, 36(3), 617–629.
10. Jesper L. R. Andersson and Stamatios N. Sotiropoulos. (2016). An integrated approach to correction for off-resonance effects and subject movement in diffusion MR imaging. NeuroImage, 125:1063-1078. 11. Jesper L. R. Andersson, Mark S. Graham, Eniko Zsoldos and Stamatios N. Sotiropoulos. (2016). Incorporating outlier detection and replacement into a non-parametric framework for movement and distortion correction of diffusion MR images. NeuroImage, 141:556-572.
12. Chang, L.-C., Jones, D. K., & Pierpaoli, C. (2005). RESTORE: Robust estimation of tensors by outlier rejection. Magnetic Resonance in Medicine, 53(5), 1088–1095. https://doi.org/10.1002/mrm.20426
13. Özarslan, E., Koay, C. G., Shepherd, T. M., Komlosh, M. E., İrfanoğlu, M. O., Pierpaoli, C., & Basser, P. J. (2013). Mean apparent propagator (MAP) MRI: A novel diffusion imaging method for mapping tissue microstructure. NeuroImage, 78, 16–32. https://doi.org/10.1016/j.neuroimage.2013.04.016
14. Garyfallidis E, Brett M, Amirbekian B, Rokem A, van der Walt S, Descoteaux M, Nimmo-Smith I; Dipy Contributors. Dipy, a library for the analysis of diffusion MRI data. Front Neuroinform. 2014 Feb 21;8:8. doi: 10.3389/fninf.2014.00008. PMID: 24600385; PMCID: PMC3931231.
15. Fick Rutger HJ, Wasserman D, Caruyer E, Deriche R. (2016). MAPL: Tissue microstructure estimation using Laplacian-regularized MAP-MRI and its application to HCP data. NeuroImage. 134:365-385. VS Fonov, AC Evans, K Botteron, CR Almli, RC McKinstry, DL Collins and BDCG, Unbiased average age-appropriate atlases for pediatric studies, NeuroImage,Volume 54, Issue 1, January 2011, ISSN 1053–8119, DOI: 10.1016/j.neuroimage.2010.07.033
16. VS Fonov, AC Evans, RC McKinstry, CR Almli and DL Collins, Unbiased nonlinear average age-appropriate brain templates from birth to adulthood, NeuroImage, Volume 47, Supplement 1, July 2009, Page S102 Organization for Human Brain Mapping 2009 Annual Meeting, DOI: http://dx.doi.org/10.1016/S1053-8119(09)70884-5
17. Andersson JLR, Jenkinson M, Smith S (2010) Non-linear registration, aka spatial normalisation. FMRIB technical report TR07JA2
18. Mori et al., MRI Atlas of Human White Matter. Elsevier, Amsterdam, The Netherlands (2005) Wakana et al., Reproducibility of quantitative tractography methods applied to cerebral white matter. NeuroImage 36:630-644 (2007) Hua et al., Tract probability maps in stereotaxic spaces: analysis of white matter anatomy and tract-specific quantification. NeuroImage, 39(1):336-347 (2008)
19. Sun, X., Salat, D., Upchurch, K., Deason, R., Kowall, N., Budson, A., & Alzheimer’s Disease Neuroimaging Initiative (2014). Destruction of white matter integrity in patients with mild cognitive impairment and Alzheimer disease. Journal of investigative medicine: the official publication of the American Federation for Clinical Research, 62(7):927–933.
20. Cooley, S. A., Cabeen, R. P., Laidlaw, D. H., Conturo, T. E., Lane, E. M., Heaps, J. M., … Paul, R. H. (2015). Posterior brain white matter abnormalities in older adults with probable mild cognitive impairment. Journal of clinical and experimental neuropsychology, 37(1), 61–69.
21. Kramer PL, Xu H, Woltjer RL, et al. (2011). Alzheimer disease pathology in cognitively healthy elderly: a genome-wide study. Neurobiol Aging. 32(12):2113–22.
22. Erten-Lyons D, Woltjer RL, Dodge H, et al. (2009). Factors associated with resistance to dementia despite high Alzheimer disease pathology. Neurology. 72(4):354–60.
23. Iacono D, O’Brien R, Resnick SM, et al. (2008). Neuronal hypertrophy in asymptomatic Alzheimer disease. J Neuropathol Exp Neurol. 67(6):578–89.
Figures