1921
Construction of an unbiased high resolution and detail-preserving structural T1-weighted template for use in studies on older adults1BIOMEDICAL ENGINEERING, ILLINOIS INSTITUTE OF TECHNOLOGY, Chicago, IL, United States, 2Rush Alzheimer’s Disease Center, RUSH UNIVERSITY MEDICAL CENTER, Chicago, IL, United States
Synopsis
Construction of an optimal T1-weighted (T1w) template for older adults often requires selection of a target anatomy for nonlinear-registrations, however a poorly chosen template may introduce bias due to large structural discrepancies between template and subjects used for template construction. Such a bias may introduce misregistration and cause loss of important anatomical details. In addition, large structural brain differences across older adults may introduce registration errors despite using state-of-the-art registration algorithms. The purpose of this work was to construct a minimum deformation T1w template of the older adult brain using a sparse, patch-based, detail-preserving template construction method that minimizes biases.
Introduction
Construction of an optimal T1-weighted (T1w) template for older adults often requires selection of a target anatomy for nonlinear-registrations, however a poorly chosen template may introduce a bias due to large structural discrepancies between the template and the subjects used for template construction1-2. Such a bias may introduce misregistration and cause loss of important anatomical details3. In addition, the large structural brain differences across older adults4 even in the absence of dementia, may introduce registration errors despite using state-of-the-art registration algorithms. The purpose of this work was therefore to construct a minimum deformation T1w template of the older adult brain using a sparse, patch-based, detail-preserving template construction method that minimizes biases.Methods
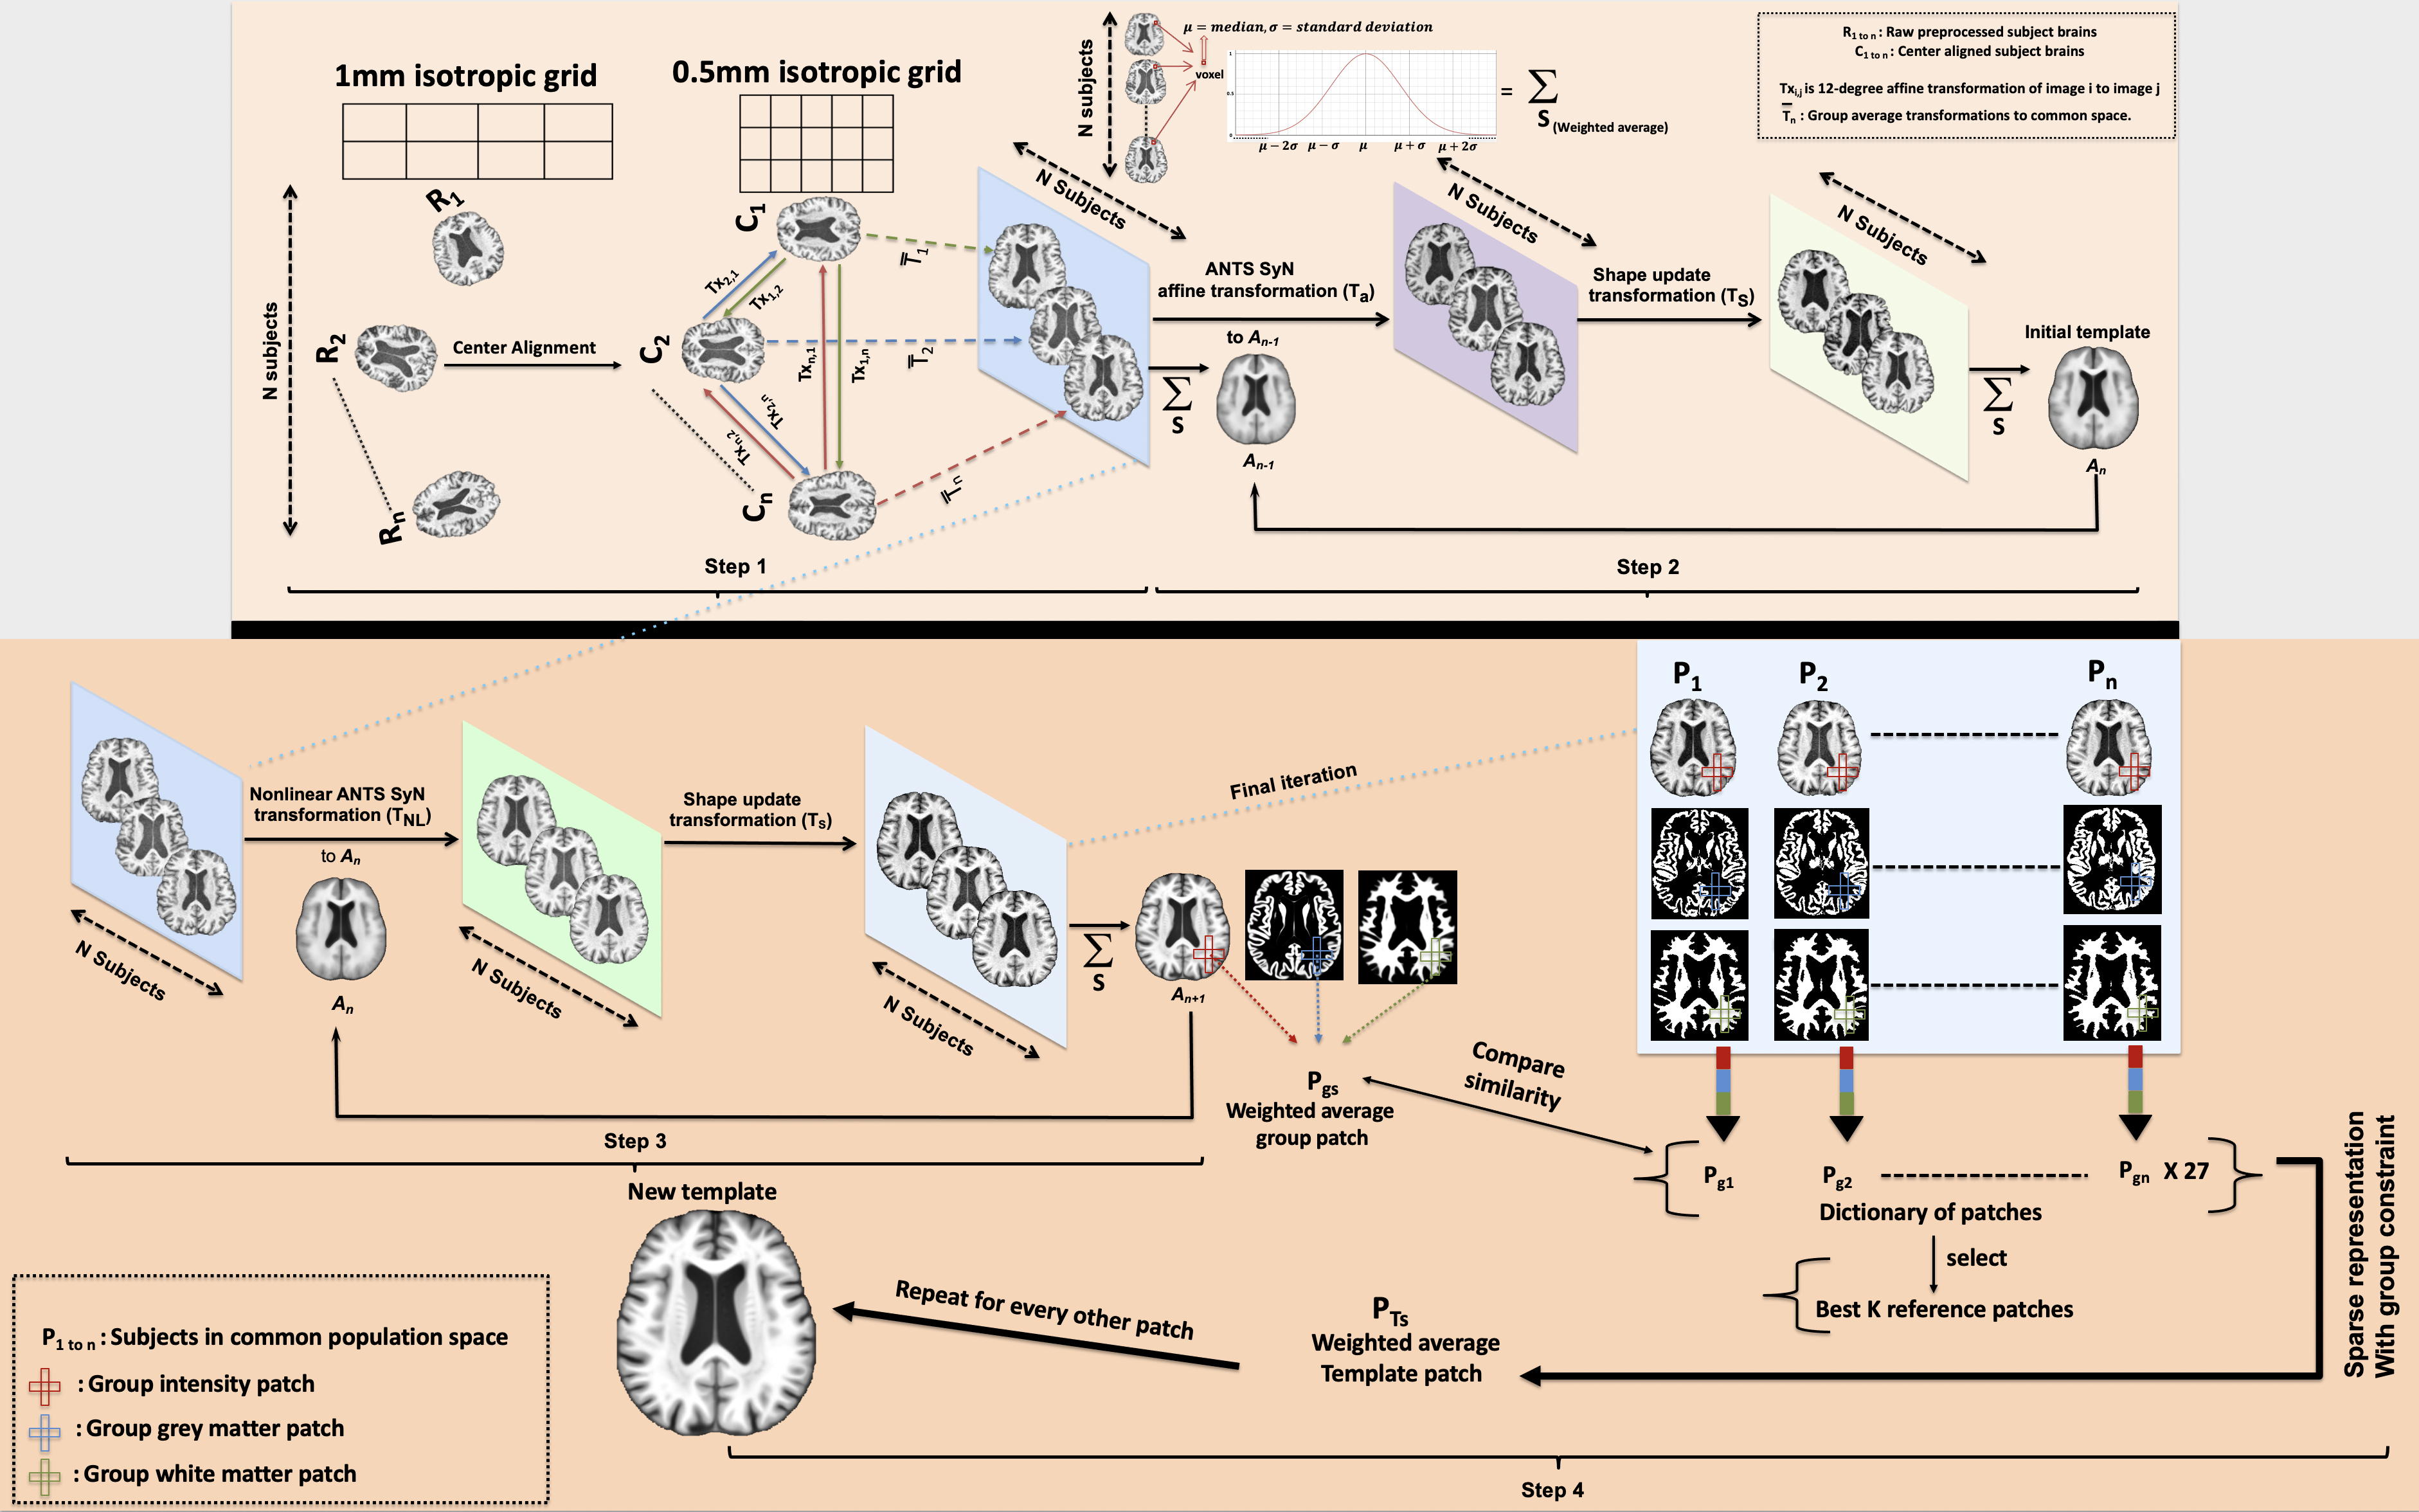
This work used T1w brain MRI data (1mm isotropic) obtained from 400 non-demented older adults (65-95 years of age, male:female=1:1) participating in longitudinal cohort studies of aging5,6. The template construction scheme comprised of the following steps:Step 1: Raw T1w data were center-aligned using intensity-independent translations to a 0.5mm resolution grid-space. The center-aligned data were then groupwise normalized in a reference-free manner by computing the Nx(N-1) 12-parameter affine transformations7-9 (Fig.1).
Step 2 & 3: A weighted average scheme was used to compute a robust group template according to which the signal in a voxel of the template was equal to the weighted average of the signals from all subjects, and the weights were derived using a Gaussian kernel with a standard deviation equal to the standard deviation of the signals included in that voxel and centered at the median. Using this template as a reference, ANTs SyGN group-wise registrations10,11 were computed utilizing the weighted average scheme in every iteration, non-linearly transforming T1w images in a minimum deformation common space (Fig.1).
Step 4: To account for misregistration, especially in the cortical regions, a patch-based tissue-guided sparse-representation approach was employed12 in which subject-specific patches and their corresponding neighbors in the nearest group patches Pg1..n were listed in a dictionary and compared to the weighted average patch (Pgs) to provide k patches most similar to Pgs. Sparse-representation predictors were computed using multi-task group Lasso13 and used to generate patch estimations, which were finally weighted averaged to generate the new template (Fig.1).
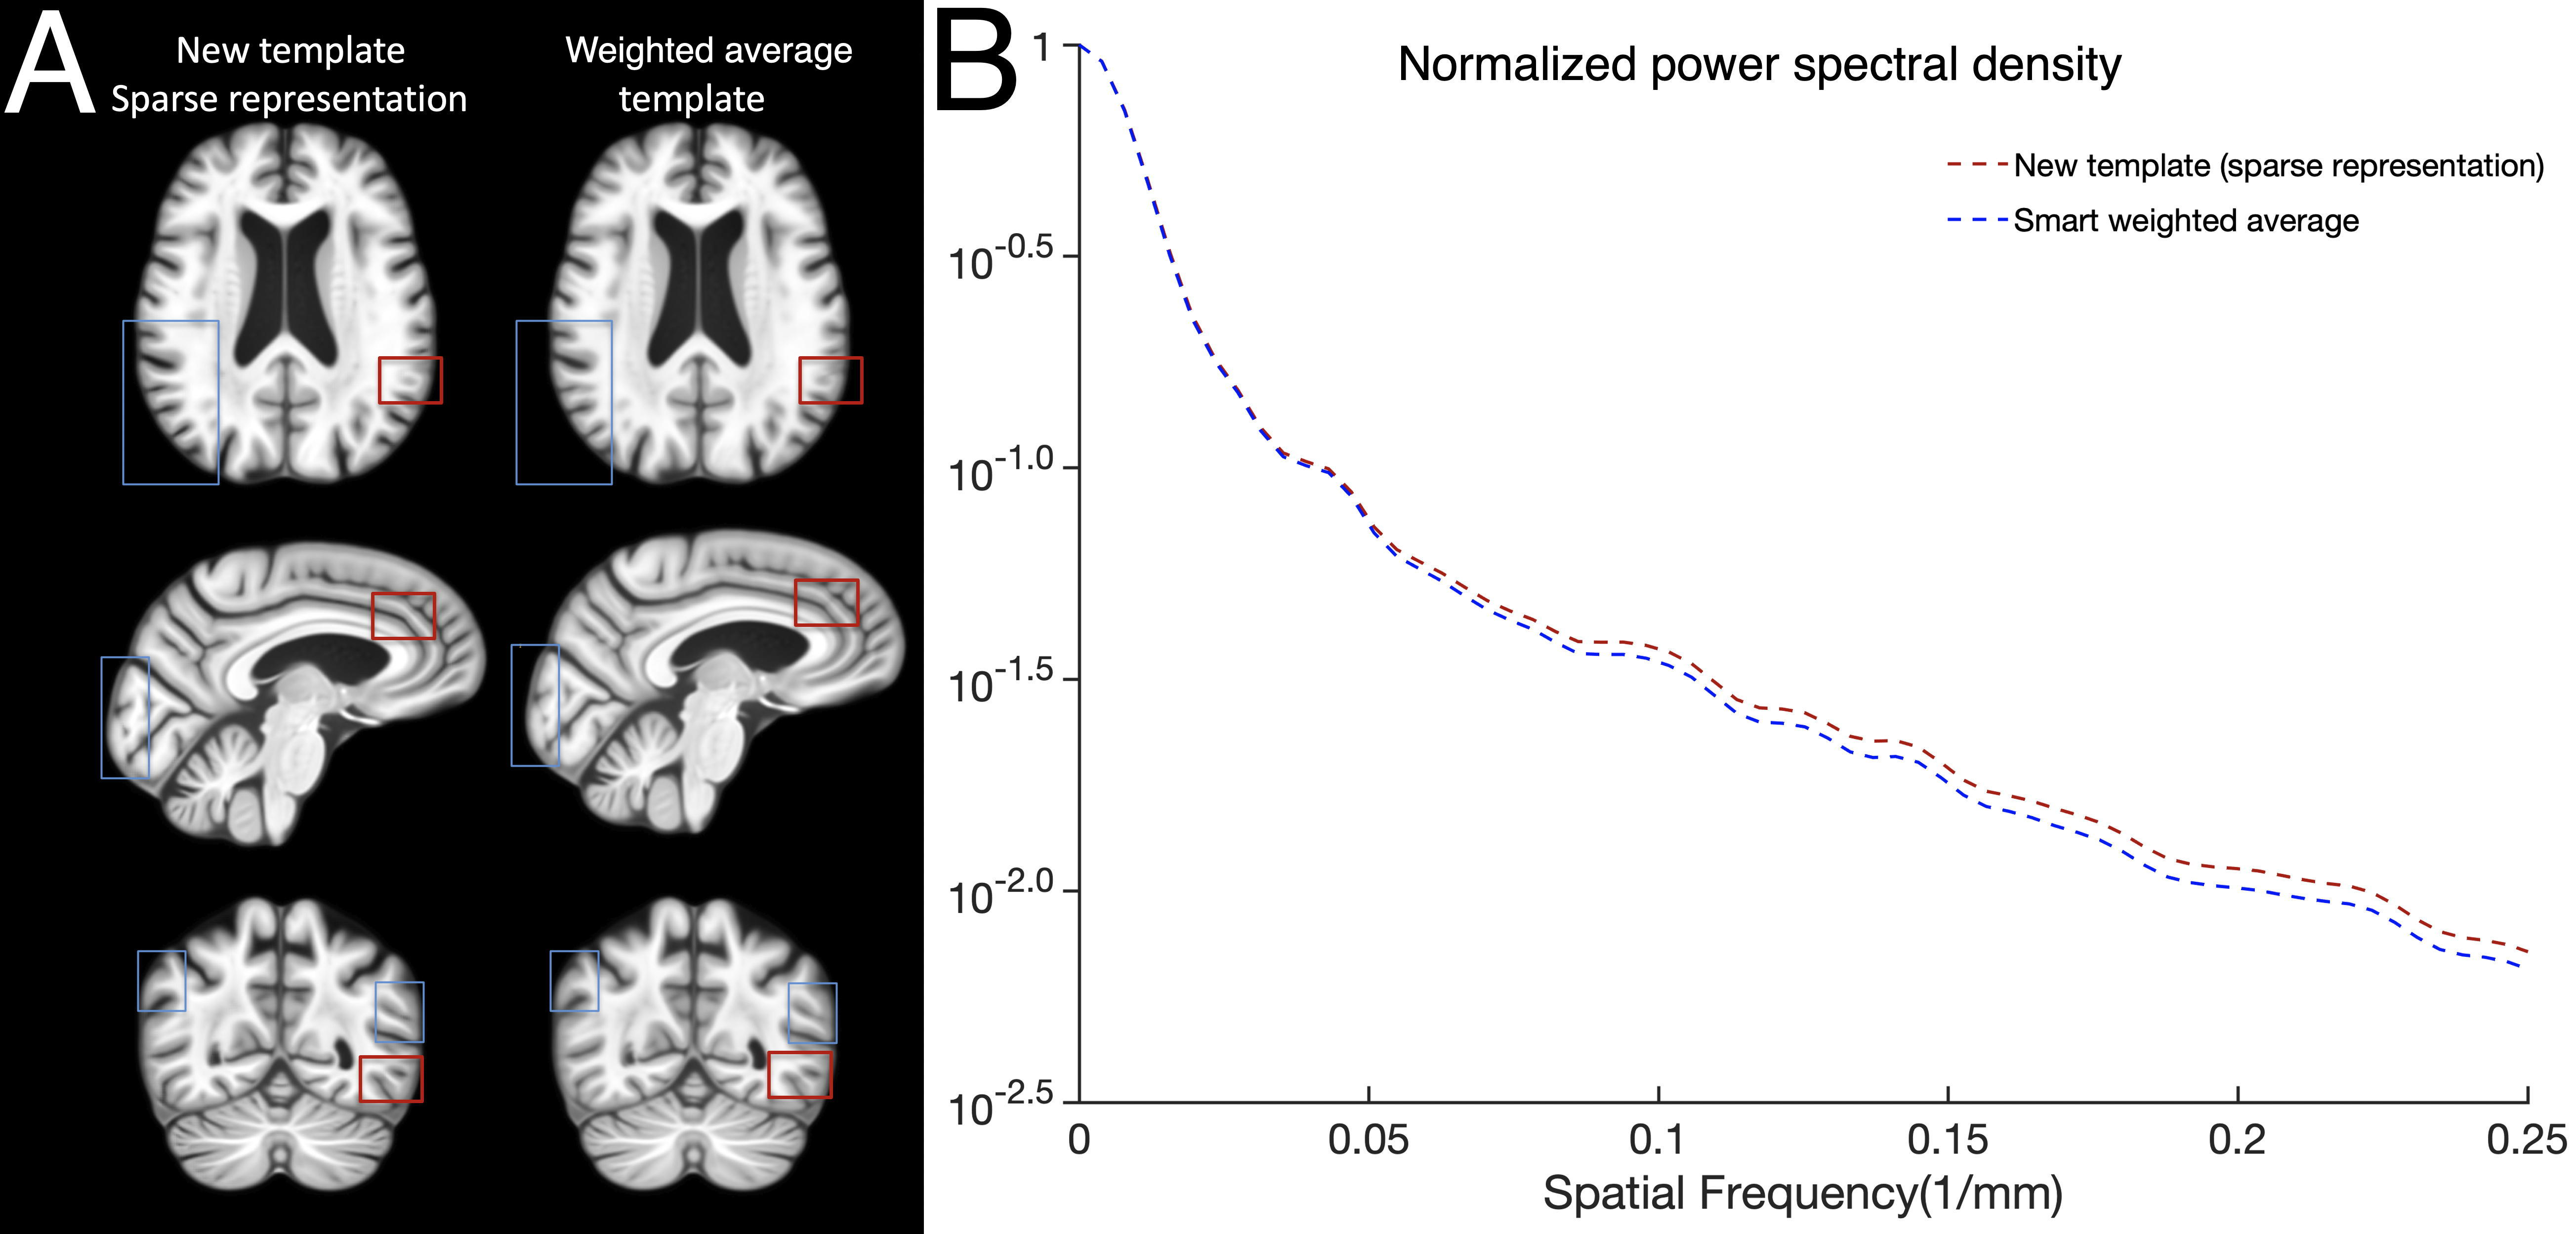
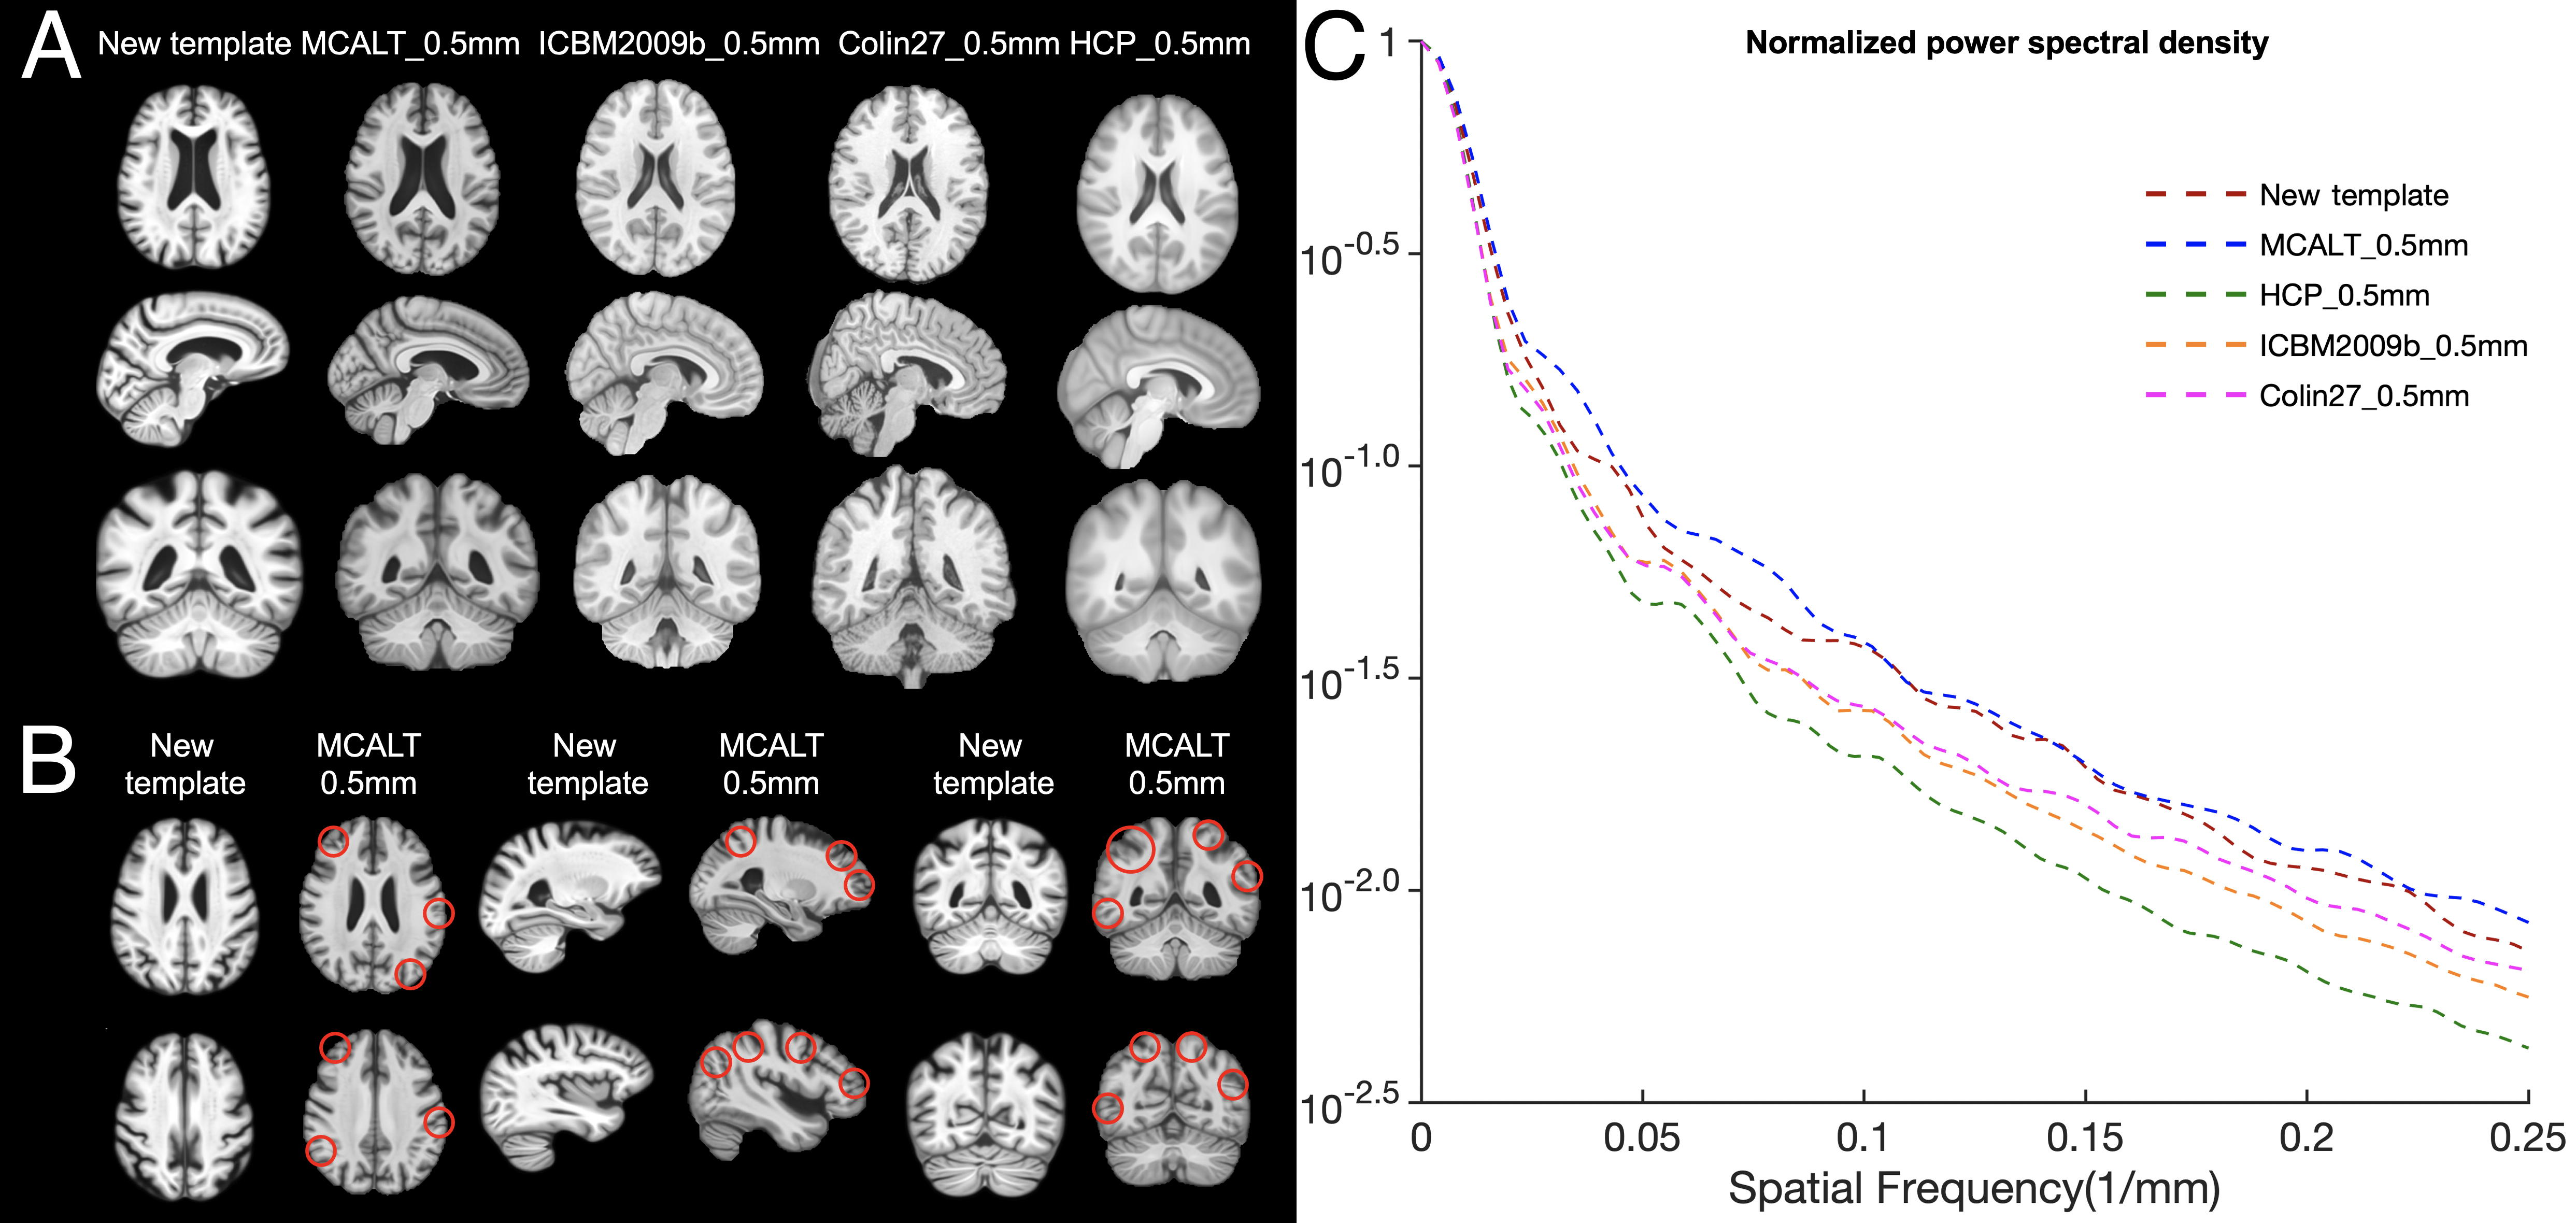
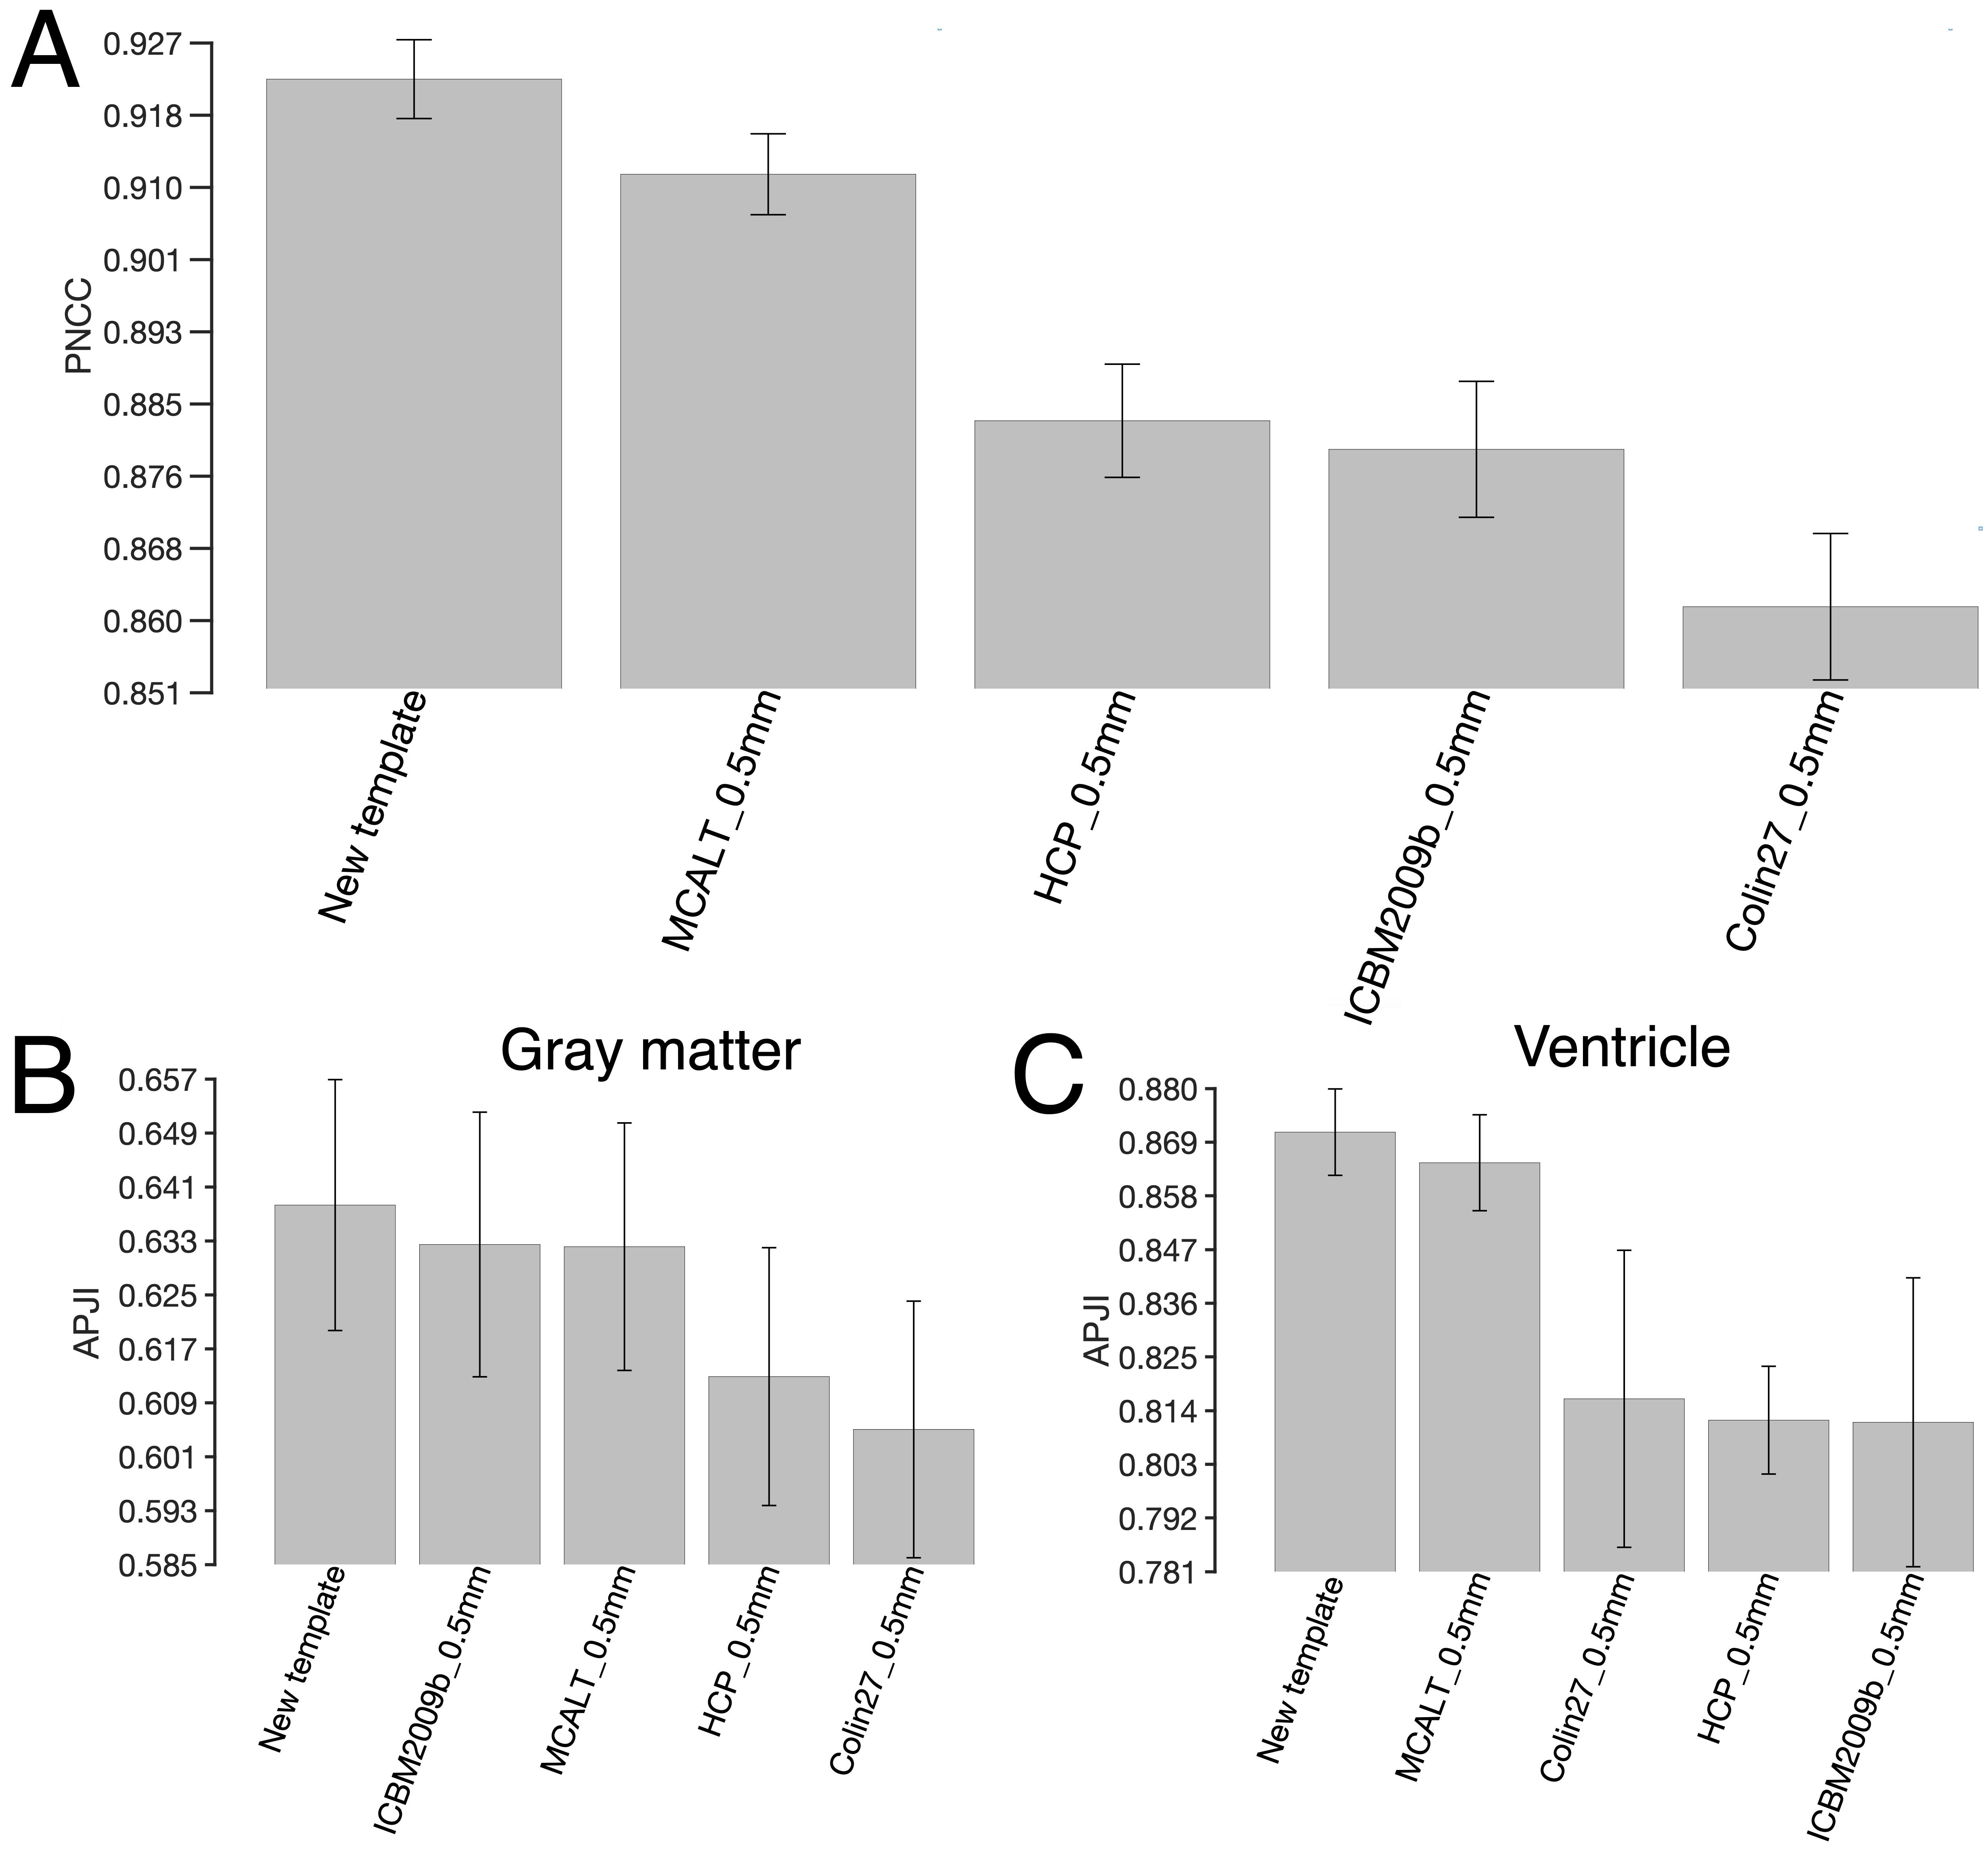
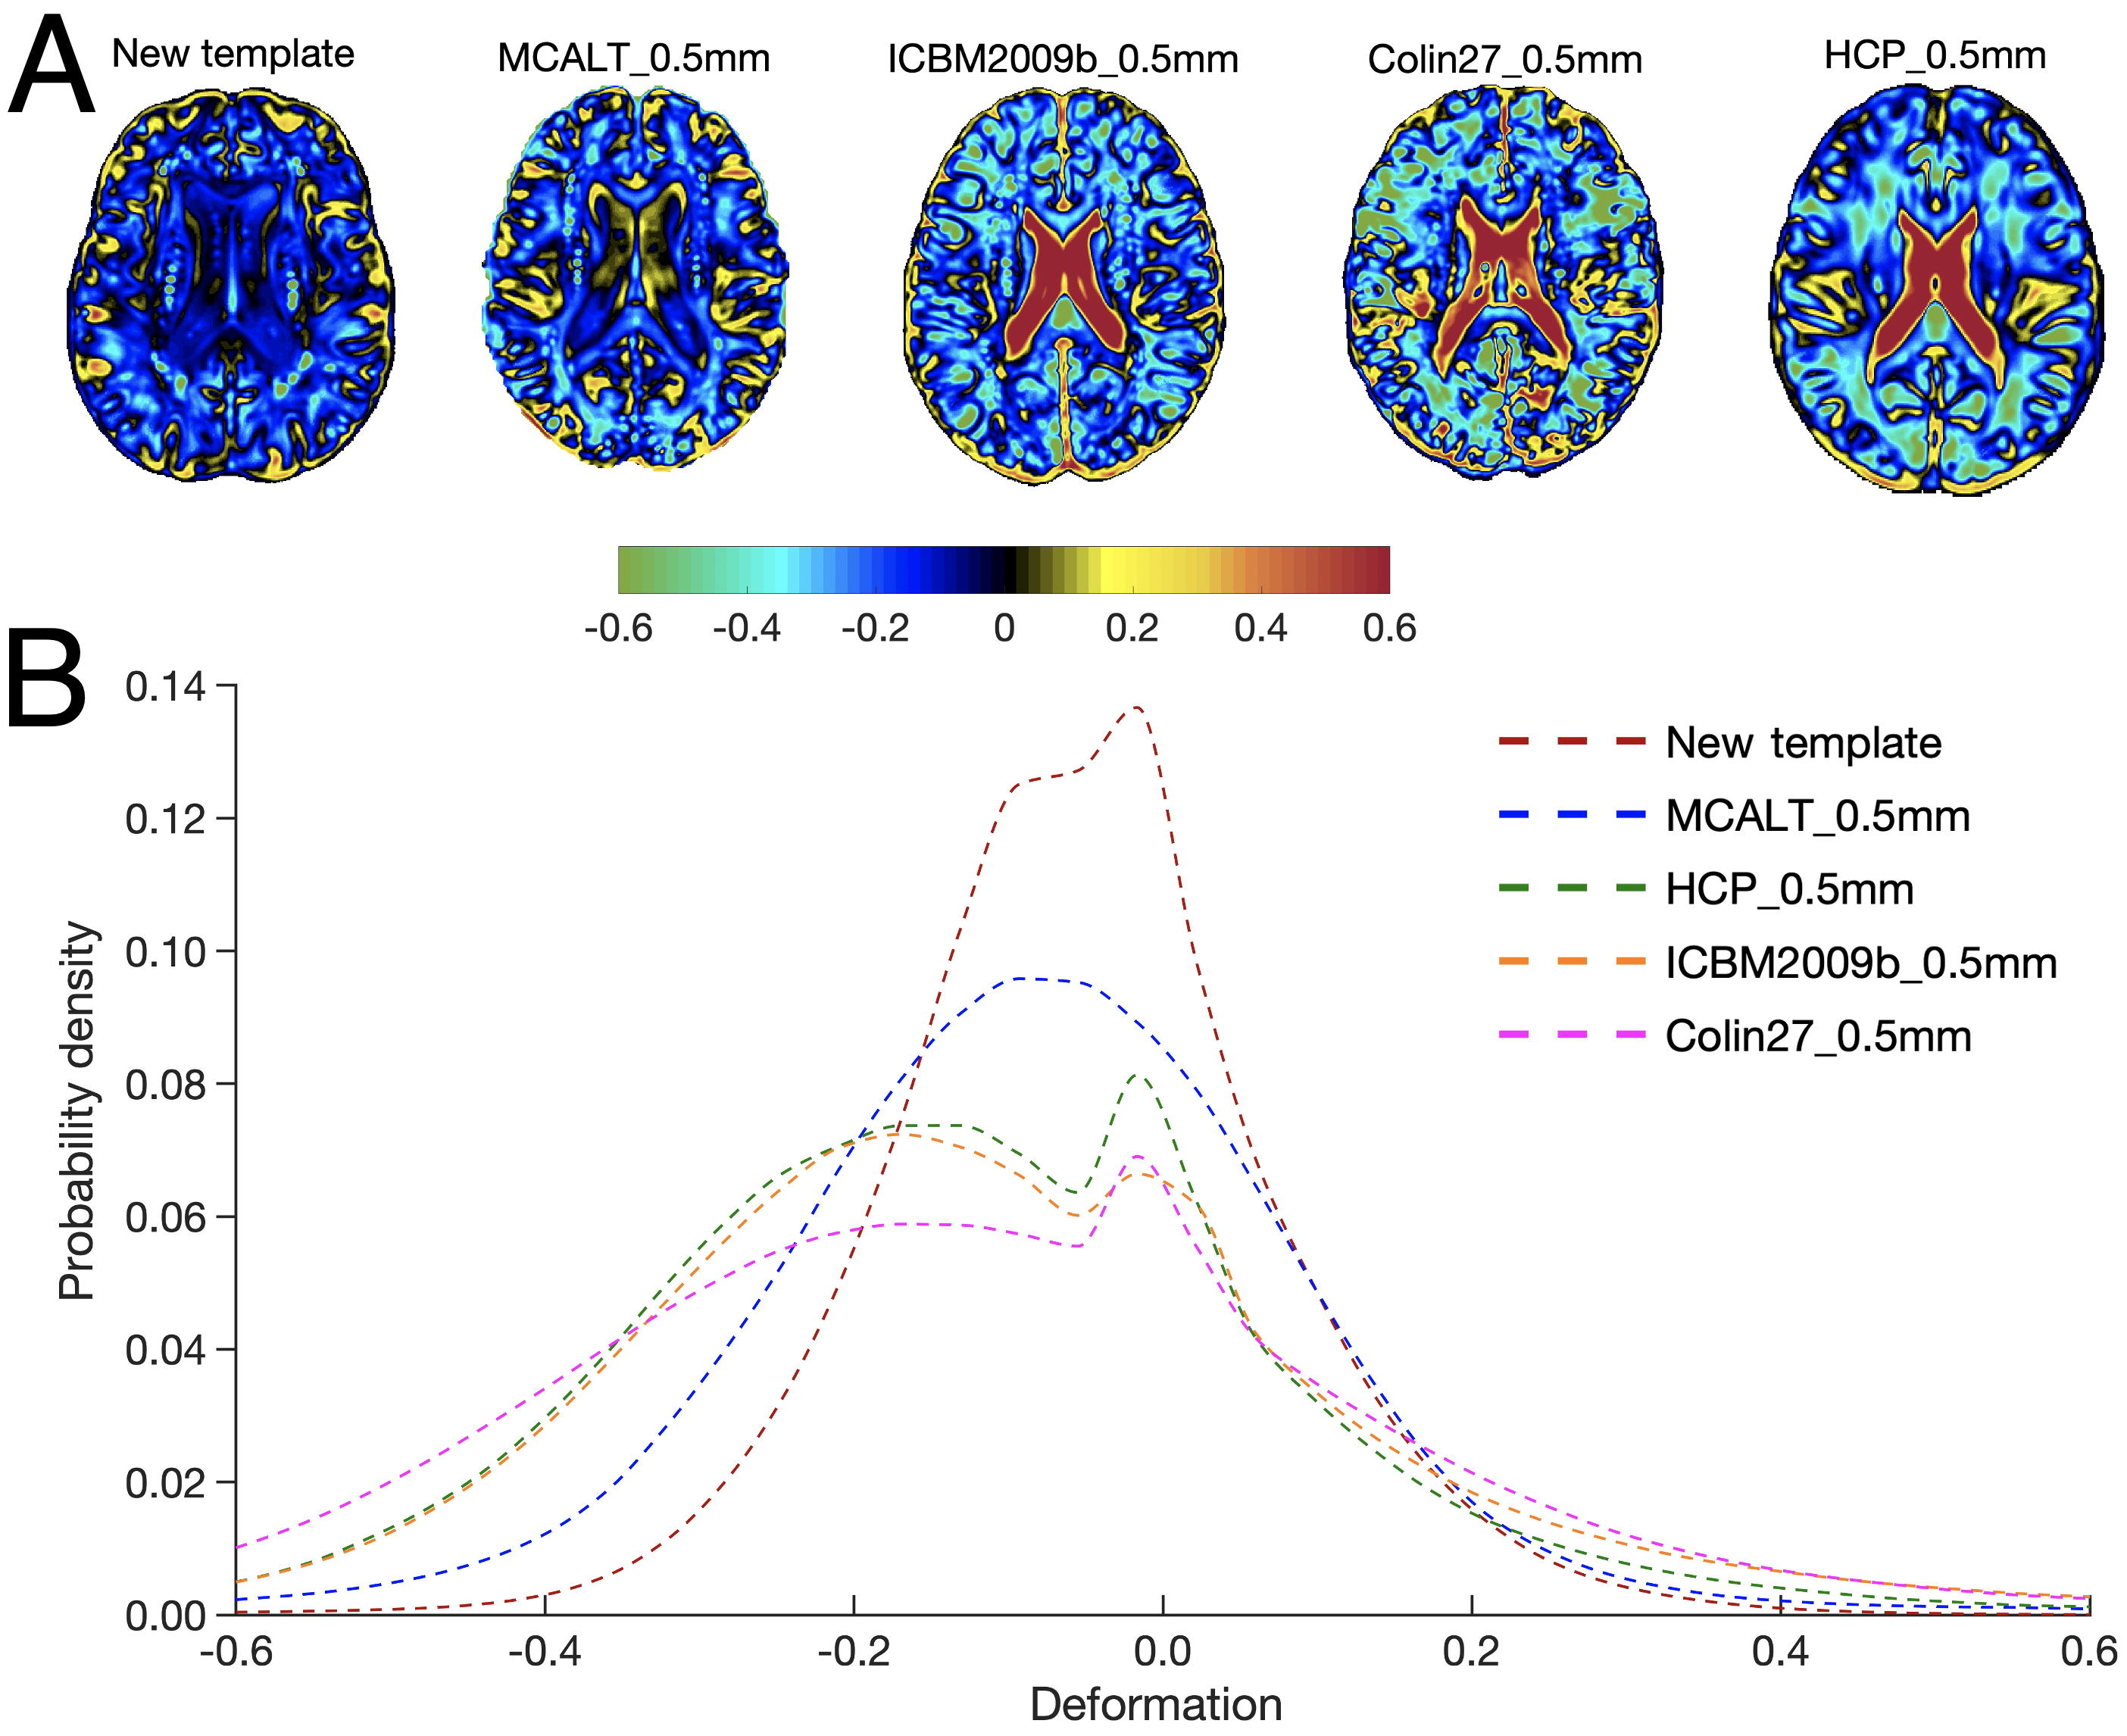
The new template (from Step 4) was compared to the weighted average template (from Step 3) (Fig. 1) and other 0.5mm templates of i) mainly middle-aged and older adults (MCALT_0.5mm14) and ii) young adults (HCP_0.5mm15, ICBM2009b_0.5mm16,17 and Colin27_0.5mm18) The templates were first compared by visual inspection, and then in terms of image sharpness as demonstrated by the normalized power spectral density, and intersubject spatial normalization accuracy achieved when used as references for normalization of T1w data (1mm isotropic) from 202 non-demented ADNI319 participants. Normalization accuracy was assessed for each template by means of the average pairwise normalized cross correlation (PNCC), and the average pairwise gray matter and ventricle Jaccard index (APJI) across normalized ADNI3 datasets. The average logJacobian determinant of the deformations of ADNI3 datasets was also calculated for each template20.
Results
The new template maintained anatomical consistency in the brain and exhibited higher image sharpness compared to other templates as demonstrated by larger high spatial frequency content in the normalized power spectra (Fig.2 & Fig.3A,C). Detailed cortical features were better resolved with the new template compared to MCALT_0.5mm (Fig.3A,B). Visual inspection revealed atypical anatomical structures in the cortex of MCALT_0.5mm (red circles) (Fig.3B), which are not present in the other templates. The accuracy of inter-subject spatial normalization was higher when using the new template compared to the other templates (Fig.4A,B,C). Finally, the new template required less spatial deformation for normalizing ADNI3 data than other templates (Fig.5).Discussion
The new template demonstrated high image quality, had high sharpness, resolved fine brain structures, and was free from structural discrepancies. The new template provided higher spatial normalization accuracy and required less deformation for older adult data compared to other templates. The above were mainly due to the use of older adult data for template construction and due to the unbiased template building approach.Conclusion
The findings of this work have important implications for template selection in studies of older adults. The new template is an unbiased high-resolution detail-preserving structural template of the older adult brain that requires lower deformation and provides higher spatial normalization accuracy for older adult data than other templates.Acknowledgements
National Institute on Aging (NIA) R01AG052200
National Institute on Aging (NIA) P30AG010161
National Institute on Aging (NIA) R01AG017917
National Institute on Aging (NIA) RF1AG022018
National Institute on Aging (NIA) R01AG056405
References
1. Joshi S, Davis B, Jomier M, Gerig G. Unbiased diffeomorphic atlas construction for computational anatomy. Neuroimage. 2004;23(SUPPL. 1).
2. Fletcher PT, Venkatasubramanian S, Joshi S. The geometric median on Riemannian manifolds with application to robust atlas estimation. Neuroimage. 2009;45(1 Suppl):S143-S152.
3. Seghers D, D'Agostino E, Maes F, Vandermeulen D, Suetens P. Construction of a brain template from MR images using state-of-the-art registration and segmentation techniques. Lect Notes Comput Sci. 2004;3216(PART 1):696-703.
4. Bajaj S, Alkozei A, Dailey NS, Killgore WDS. Brain aging: Uncovering cortical characteristics of healthy aging in young adults. Front Aging Neurosci. 2017;9(DEC):1-14.
5. Bennett DA, Buchman AS, Boyle PA, Barnes LL, Wilson RS, Schneider JA. Religious Orders Study and Rush Memory and Aging Project. J Alzheimers Dis. 2018;64(s1):S161-S189.
6. Barnes LL, Shah RC, Aggarwal NT, Bennett DA, Schneider JA. The Minority Aging Research Study: Ongoing Efforts to Obtain Brain Donation in African Americans without Dementia. Curr Alzheimer Res. 2012;9(6):734-745.
7. Serag A, Aljabar P, Ball G, et al. Construction of a consistent high-definition spatio-temporal atlas of the developing brain using adaptive kernel regression. Neuroimage. 2012;59(3):2255-2265.
8. Seghers D, D'Agostino E, Maes F, Vandermeulen D, Suetens P. Construction of a brain template from MR images using state-of-the-art registration and segmentation techniques. Lect Notes Comput Sci. 2004;3216(PART 1):696-703.
9. Gutman B, Leow AD, Yanovsky I, Toga AW, Thompson PM. Creating Unbiased Minimal Deformation Templates for Brain Volume Registration. Organ Hum Brain Mapp. 2010;M.
10. Avants B, Tustison N, Song G. Advanced Normalization Tools (ANTS). Insight J. Published online 2009:1-35.
11. Avants, Brian B., et al. "The optimal template effect in hippocampus studies of diseased populations." Neuroimage49.3 (2010): 2457-2466.
12. Shi F, Wang L, Wu G, et al. Neonatal atlas construction using sparse representation. Hum Brain Mapp. 2014;35(9):4663-4677.
13. Liu J, Ji S, Ye J. Multi-task feature learning via efficient ℓ2, 1-norm minimization. In: Proceedings of the 25th Conference on Uncertainty in Artificial Intelligence, UAI 2009;339-348
14. Schwarz CG, et al. THE MAYO CLINIC ADULT LIFE SPAN TEMPLATE: BETTER QUANTIFICATION ACROSS THE LIFE SPAN. Alzheimer's & Dementia: The Journal of the Alzheimer's Association. 2017;13(7):P93-4.
15. Glasser, M. F., Sotiropoulos, S. N., Wilson, J. A., et al. The minimal preprocessing pipelines for the Human Connectome Project. Neuroimage, 2013;80:105-124.
16. Fonov V, Evans AC, Botteron K, et al. Brain Development Cooperative Group. Unbiased average age-appropriate atlases for pediatric studies. Neuroimage. 2011;54(1):313-27.
17. Fonov VS, Evans AC, McKinstry RC, et al. Unbiased nonlinear average age-appropriate brain templates from birth to adulthood. NeuroImage. 2009(47):S102.
18. Holmes CJ, Hoge R, Collins L, et al. Enhancement of MR images using registration for signal averaging. Journal of computer assisted tomography. 1998;22(2):324-33.
19. Alzheimer's & Dementia: The Journal of the Alzheimer's Association , Volume 14 , Issue 7 , P852 - P853
20. Ridwan, A.R., et al. Development and evaluation of a high performance T1-weighted brain template for use in studies on older adults. Human Brain Mapping 2021(in press)
Figures