1920
T2*-weighted ex vivo whole-hemisphere 7 T MRI localizes novel focal iron-rich pathology in frontotemporal lobar degeneration1Radiology, Perelman School of Medicine, University of Pennsylvania, Philadelphia, PA, United States, 2Neurology, Perelman School of Medicine, University of Pennsylvania, Philadelphia, PA, United States, 3Pathology and Laboratory Medicine, Perelman School of Medicine, University of Pennsylvania, Philadelphia, PA, United States
Synopsis
We describe novel, focal iron-rich pathology in frontotemporal lobar degeneration (FTLD), detected via combined ex vivo 7 T whole-hemisphere MRI and MRI-guided histopathology. While previous work has shown iron-positive plaques in AD, and focal iron-positive pathology in the motor cortex of ALS patients, we find novel focal pathologic features across a diverse range of FTLD patients, including both FTLD-tau and FTLD-TDP. These focal features occurred in regions often missed with standardized diagnostic sampling, demonstrating the sensitivity of an MRI-guided approach to histopathology. Additionally, these focal iron deposits are candidates for future in vivo detection, providing new sources of imaging contrast.
Introduction
T2*-weighted (T2*w) ex vivo imaging of human brain samples at 7 T has high sensitivity to iron, as validated by combined MRI/pathology studies1. In Alzheimer’s disease (AD) iron localizes in amyloid-beta plaques and microglia2–4, while in amyotrophic lateral sclerosis (ALS) iron-positive glia are detected in the motor cortex5–7. Here we evaluate MRI-guided histopathology to detect and characterize focal iron deposits in frontotemporal lobar degeneration (FTLD), a family of proteinopathies that has not been well-explored using these imaging methods.FTLD, a common cause of young-onset dementia, includes two main pathologic categories: tau (FTLD-tau) and TDP-43 (FTLD-TDP) proteinopathies. Histopathological studies find divergent patterns of microscopic degeneration between FTLD-tau and FTLD-TDP. However, to the best of our knowledge, ex vivo MRI has not been previously used to compare a mixed population of FTLD brains, nor have MRI-guided FTLD samples previously been correlated with histopathologic staining.
Methods
Patients selected for study were diagnosed at the Penn Frontotemporal Degeneration Center (FTDC). We examined 3 FTLD-tau (2 four-repeat tauopathies and 1 three-repeat tauopathy) brains, 2 FTLD-TDP brains (1 TDP-A and 1 TDP-C), and 1 age-matched healthy control brain. At the time of autopsy, one hemisphere was selected for standard neuropathological sampling for diagnostics and frozen storage8 while the other hemisphere was immersed in 10% neutral buffered formalin for at least 28 days prior to imaging.Samples were bagged in Fomblin (California Vacuum Technology, Freemont, CA), placed in a custom-modified quadrature birdcage (Varian, Palo Alto, CA, USA) transmit/receive coil attached to a two-channel transmit-receive adapter (Stark Contrast, Erlangen, Germany), and scanned in a whole-body 7 T scanner (MAGNETOM Terra, Siemens Healthineers, Erlangen, Germany).
T2*w gradient echo (GRE) images were acquired with non-selective RF pulses, 3D encoding, and an 8-echo readout with matched polarity, followed by an additional navigator for dynamic correction of frequency drifts. Each line of k-space was acquired with multiple averages sequentially before advancing to the next phase-encode step. Sequence parameters were: 280 um isotropic resolution, FA 25°, TR 60 ms, min TE 3.48 ms, echo spacing 6.62 ms, bandwidth 400 Hz/px. FOV was adapted to each sample, occasionally requiring slight changes to TEs and TR. Total scan time was 8-10 hours for each sample.
Consistent with previous work, TEs of roughly 20 ms provided strong intracortical and GM/WM contrast while maintaining excellent SNR and minimizing susceptibility induced drop-outs. We performed all subsequent analyses on these single-echo images.
Images were reviewed by one reader (MDT) to localize abnormal hypointensities within the cortex, comparing to both the control brain and neighboring cortex within the disease samples. These prospective abnormalities where then discussed with the group, and agreed locations were sampled for subsequent histopathology.
All histopathology samples were processed and embedded in paraffin. Adjacent 6 um sections were stained for myelin using luxol-fast blue (LFB) with hematoxylin and eosin counterstain, Meguro method for Perl’s Fe stain with DAB amplification9,10, ferritin light chain (Abcam; Catalogue No ab69090), microglia (IBA-1; Santa Cruz Biotechnology Inc, Dallas, TX; Catalogue No sc-32725) and activated astrocytes (GFAP; Dako; Santa Clara, CA; Catalogue No Z0334).
Results
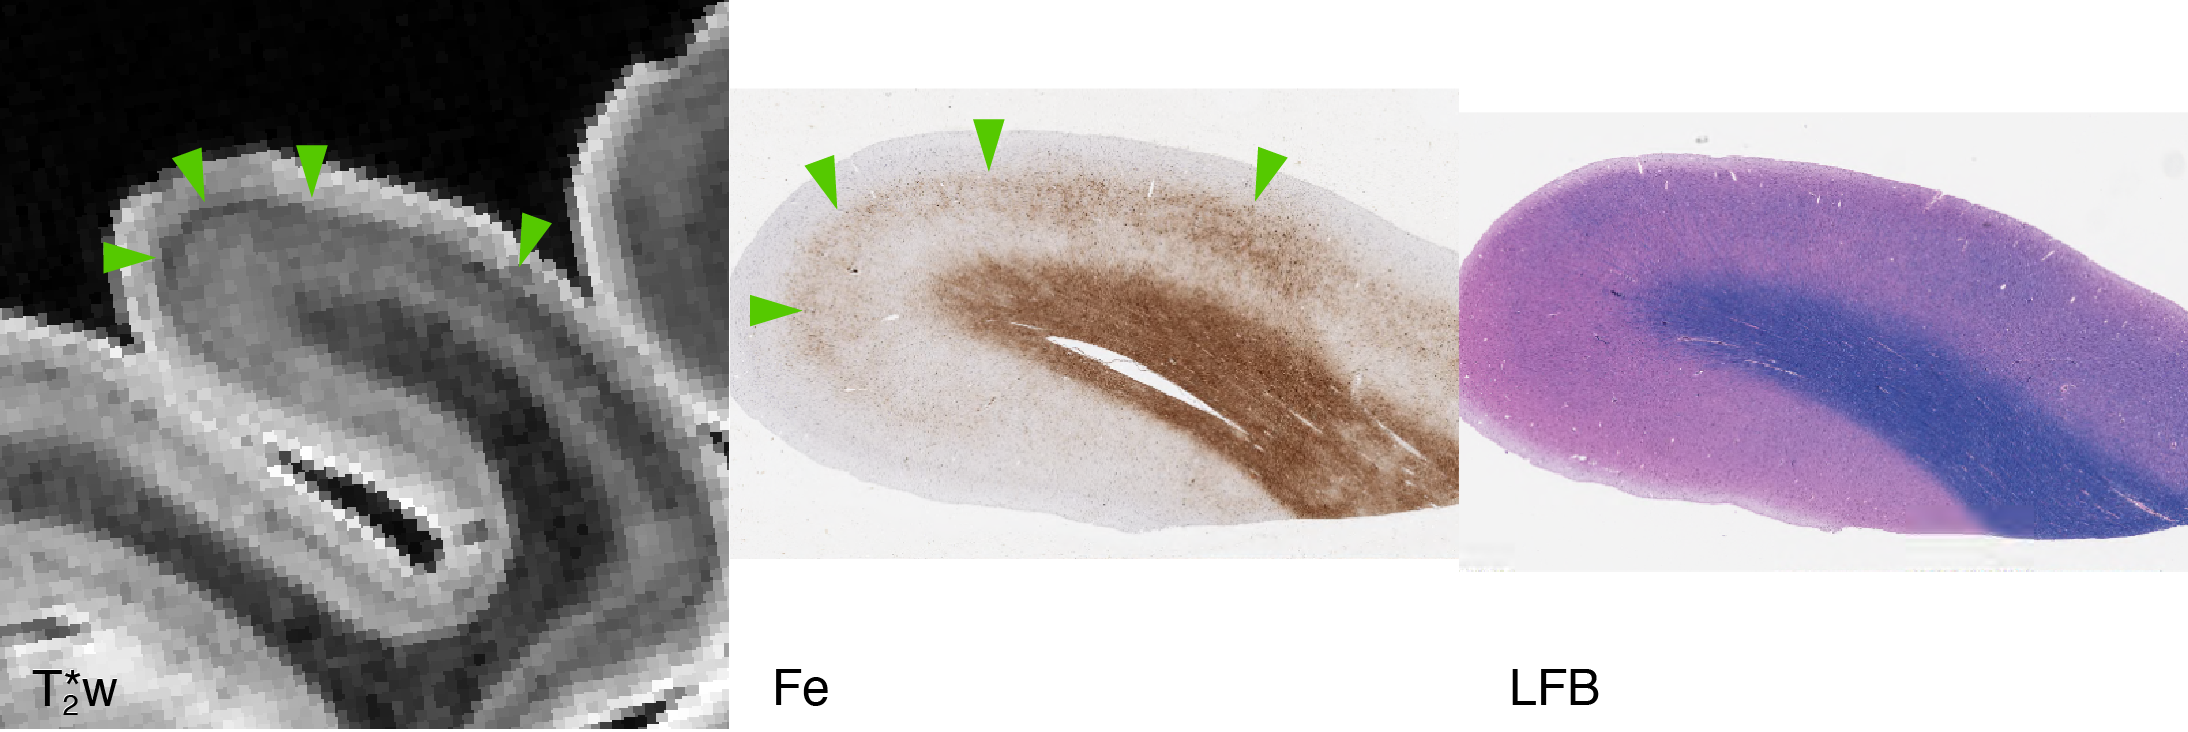
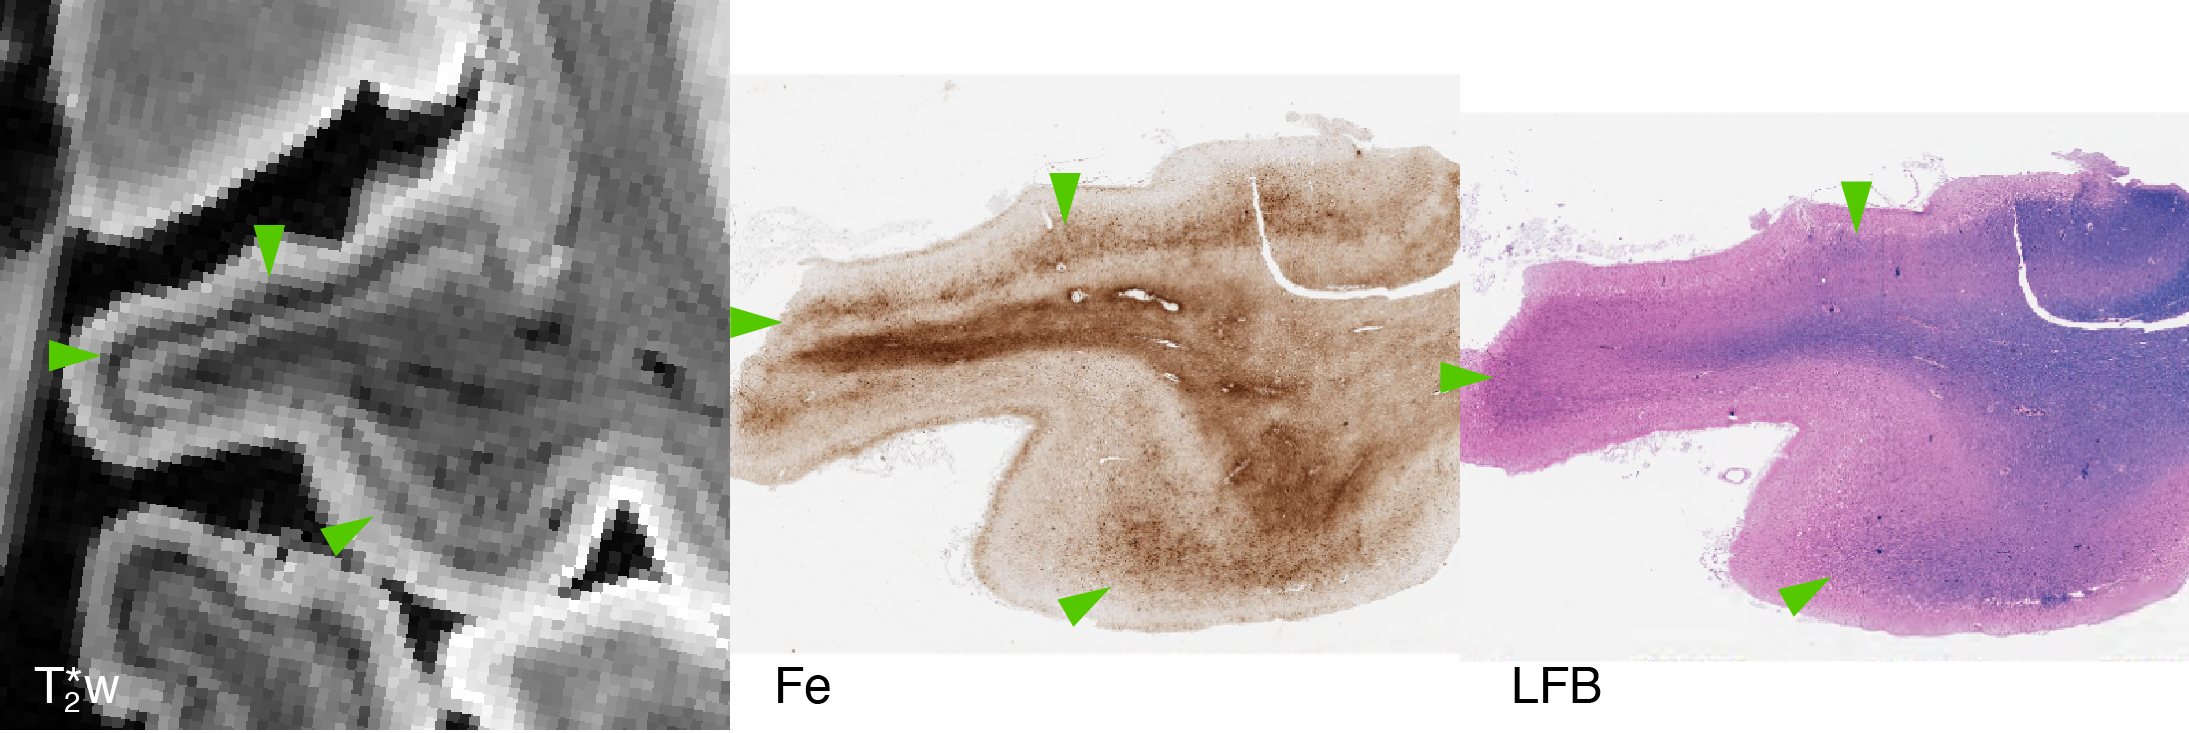
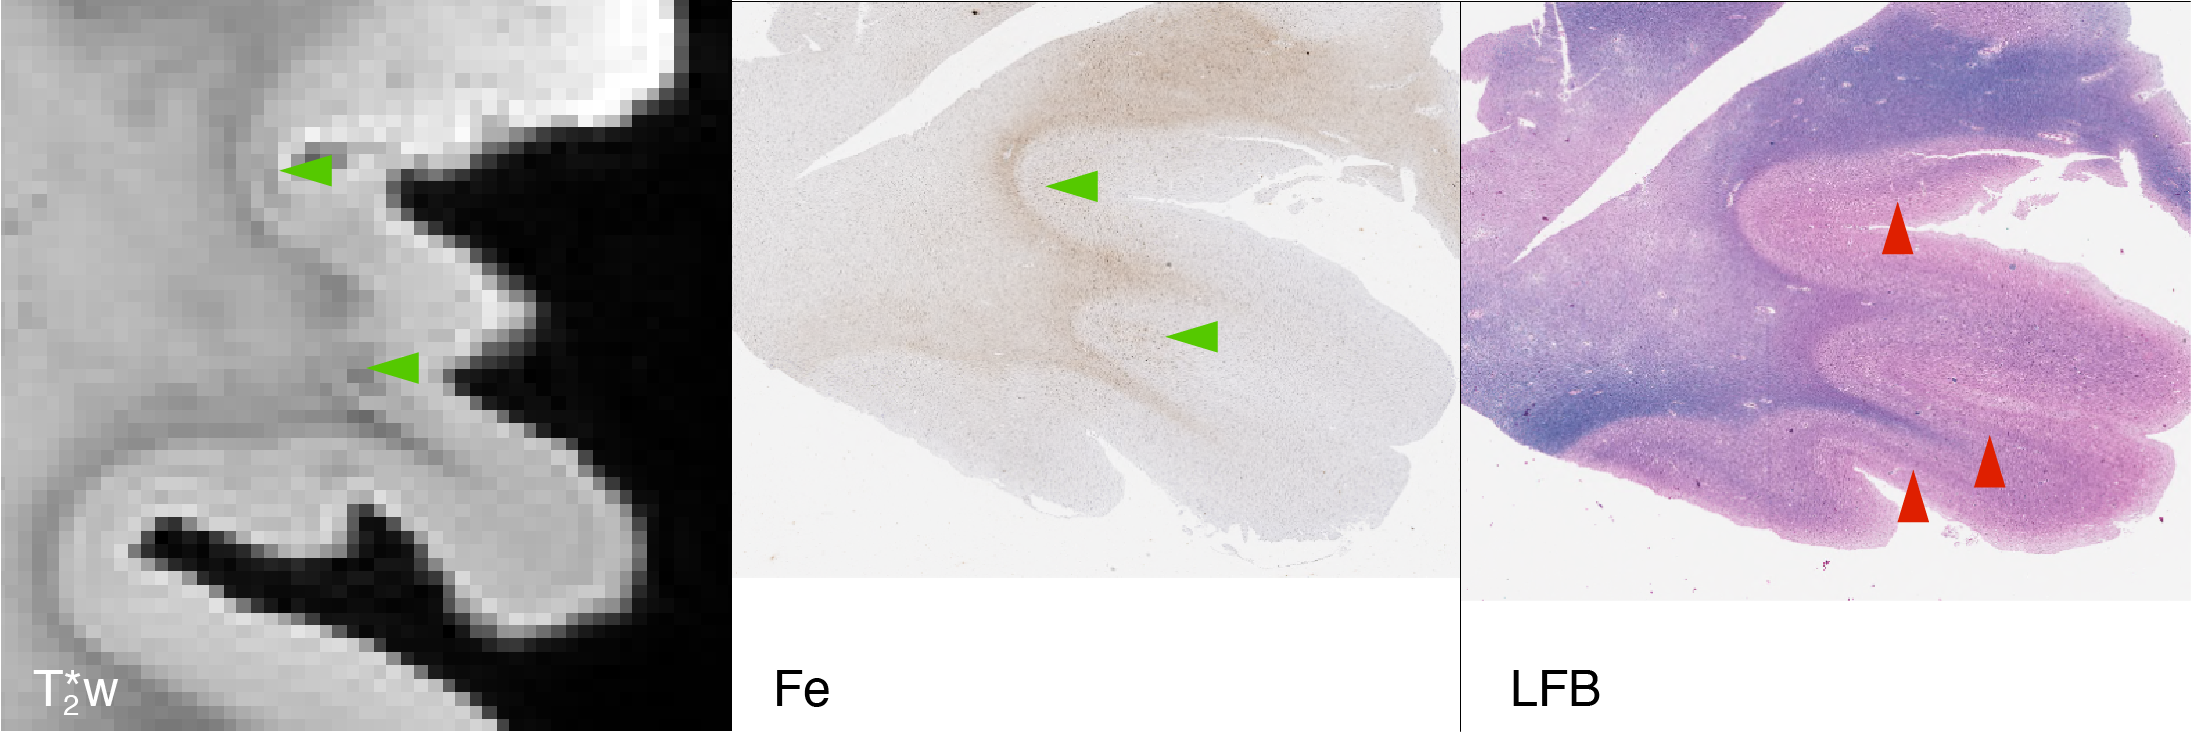
Focal, iron-positive regions were found within the cortex of all FTLD brains, with no similar regions found in the control brain.On MRI, both the four-repeat tauopathies (progressive supranuclear palsy (PSP) and globular glial tauopathy (GGT)) showed significant hypointense banding in mid- to lower-layers of primary motor cortex, and diffuse hypointensity in adjactent WM, corresponding to substantial iron-positive hypertrophic microglia on histopathology (Figs 1 and 2). The three-repeat tauopathy sample (Pick’s disease (PD)) showed widespread neuronal loss and WM degeneration within the frontal cortex on histopathology, and a marked absence of cortical laminar contrast on MRI. However, there was a notable focal hypointense mid-layer cortical band in inferior lateral prefrontal cortex (ILPFC), which was correlated with iron-positive microglia (Fig 3).
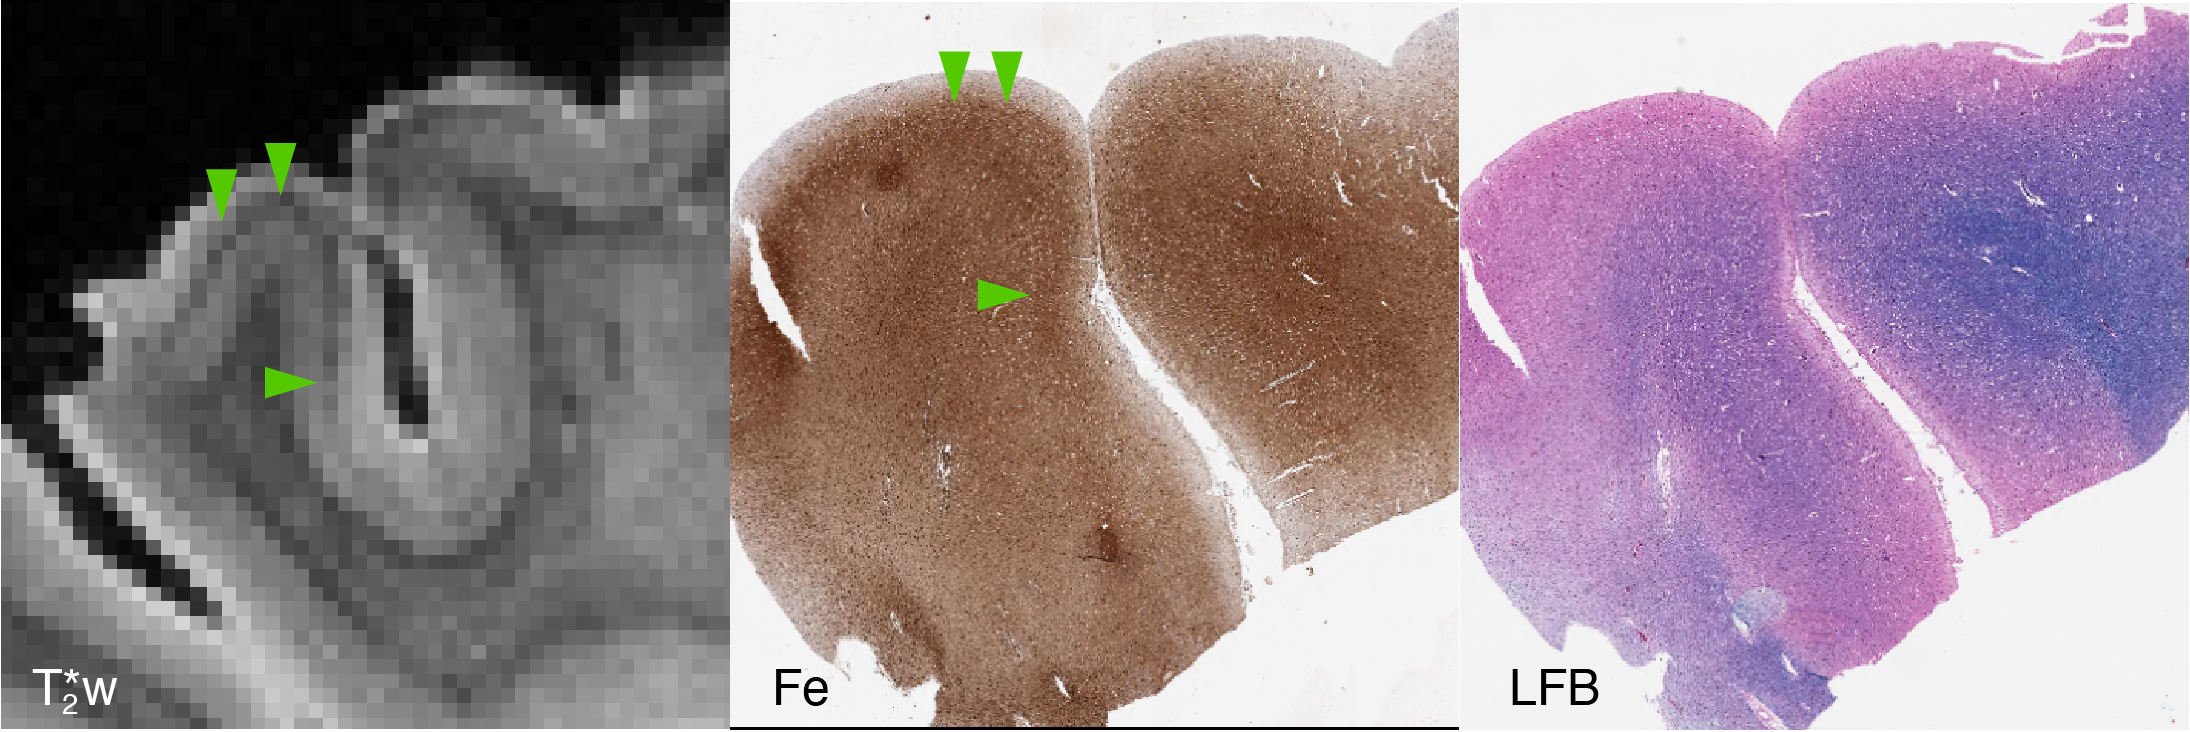
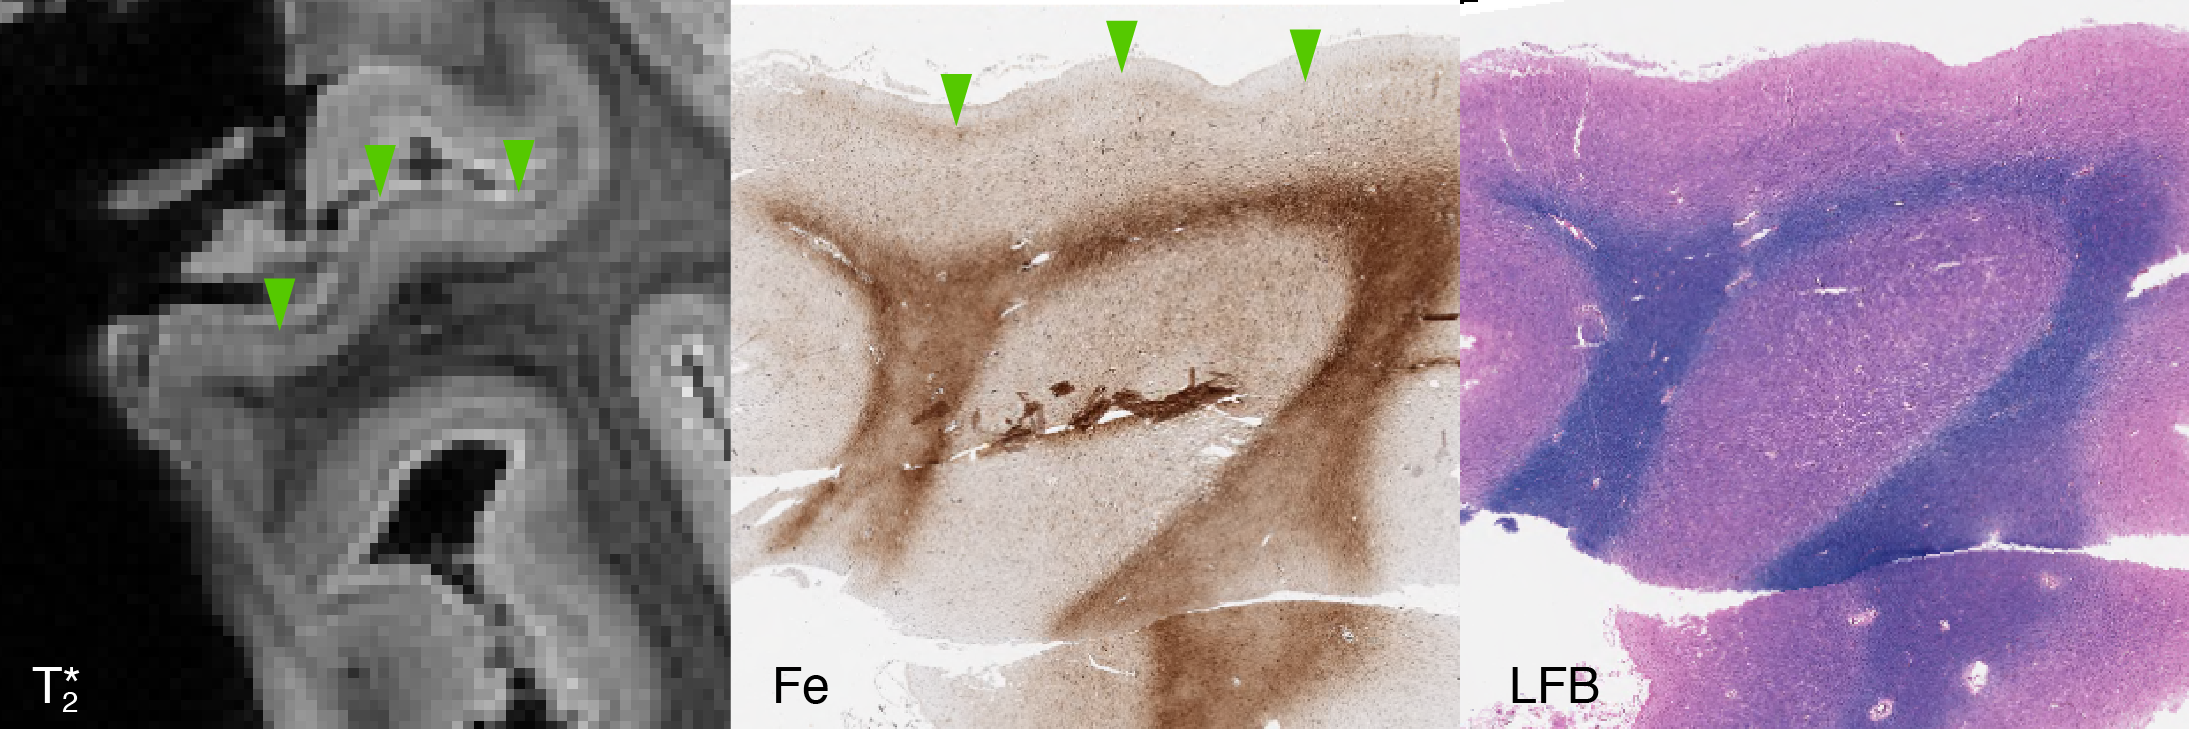
Our 2 FTLD-TDP samples (TDP-A with behavioral variant frontotemporal dementia (bvFTD) and TDP-C with semantic variant primary progressive aphasia (svPPA)) both showed hypointense bands in the upper cortical layers of lateral orbital frontal cortex and ventral lateral temporal cortex respectively (Figs 4 and 5). These correlated with iron-positive dystrophic-appearing microglia processes and iron-positive astrocytes.
Discussion
While focal iron deposits have been described in ALS, our results show for the first time that these features are likely common across both FTLD-tau and FTLD-TDP. However, due to their focal nature and heterogeneous spatial distribution, traditional diagnostic histopathological sampling may miss them.Our results recapitulate previous findings that T2*w ex vivo MRI of human brain samples is highly sensitive to iron, appearing as hypointensities. The lack of cortical laminar contrast in our PD sample correlated most prominently with the loss of iron associated with healthy intra-cortical myelin. Therefore, in our sample iron distribution was the most significant driver of apparent T2*w contrast.
Conclusion
T2*w imaging can detect novel iron-positive pathology with disparate laminar distributions between forms of FTLD-tau and FTLD-TDP. MRI-guided sampling provides a critical method to study mechanisms of disease in frontotemporal regions often neglected in standard histopathological approaches. Conversely, ex vivo imaging can also inform a translational pathway to in vivo protocols sensitized to laminar iron-rich pathology, improving antemortem diagnosis of underlying neuropathology.Acknowledgements
This work was funded by NIH awards P01AG066597, R01NS109260, P30AG10124, and P01AG017586; the Penn Institute on Aging; and the Wyncote Foundation.References
1. Fukunaga M, Li T-Q, van Gelderen P, de Zwart JA, Shmueli K, Yao B, Lee J, Maric D, Aronova MA, Zhang G, Leapman RD, Schenck JF, Merkle H, Duyn JH. Layer-specific variation of iron content in cerebral cortex as a source of MRI contrast. Proceedings of the National Academy of Sciences. 2010 Feb 23;107(8):3834–3839.
2. van Duijn S, Bulk M, van Duinen SG, Nabuurs RJA, van Buchem MA, van der Weerd L, Natté R. Cortical Iron Reflects Severity of Alzheimer’s Disease. Journal of Alzheimer’s Disease. 2017 Nov 7;60(4):1533–1545.
3. Bulk M, Abdelmoula WM, Nabuurs RJA, van der Graaf LM, Mulders CWH, Mulder AA, Jost CR, Koster AJ, van Buchem MA, Natté R, Dijkstra J, van der Weerd L. Postmortem MRI and histology demonstrate differential iron accumulation and cortical myelin organization in early- and late-onset Alzheimer’s disease. Neurobiology of Aging. 2018 Feb;62:231–242.
4. Gong N-J, Dibb R, Bulk M, van der Weerd L, Liu C. Imaging beta amyloid aggregation and iron accumulation in Alzheimer’s disease using quantitative susceptibility mapping MRI. NeuroImage. 2019 May;191:176–185.
5. Kwan JY, Jeong SY, Van Gelderen P, Deng H-X, Quezado MM, Danielian LE, Butman JA, Chen L, Bayat E, Russell J, Siddique T, Duyn JH, Rouault TA, Floeter MK. Iron Accumulation in Deep Cortical Layers Accounts for MRI Signal Abnormalities in ALS: Correlating 7 Tesla MRI and Pathology. Ashizawa T, editor. PLoS ONE. 2012 Apr 17;7(4):e35241.
6. Pallebage-Gamarallage M, Foxley S, Menke RAL, Huszar IN, Jenkinson M, Tendler BC, Wang C, Jbabdi S, Turner MR, Miller KL, Ansorge O. Dissecting the pathobiology of altered MRI signal in amyotrophic lateral sclerosis: A post mortem whole brain sampling strategy for the integration of ultra-high-field MRI and quantitative neuropathology. BMC Neuroscience. 2018 Dec;19(1).
7. Wang C, Foxley S, Ansorge O, Bangerter-Christensen S, Chiew M, Leonte A, Menke RA, Mollink J, Pallebage-Gamarallage M, Turner MR, Miller KL, Tendler BC. Methods for quantitative susceptibility and R2* mapping in whole post-mortem brains at 7T applied to amyotrophic lateral sclerosis. NeuroImage. 2020 Nov;222:117216
8. Toledo JB, Van Deerlin VM, Lee EB, Suh E, Baek Y, Robinson JL, Xie SX, McBride J, Wood EM, Schuck T, Irwin DJ, Gross RG, Hurtig H, McCluskey L, Elman L, Karlawish J, Schellenberg G, Chen-Plotkin A, Wolk D, Grossman M, Arnold SE, Shaw LM, Lee VM-Y, Trojanowski JQ. A platform for discovery: The University of Pennsylvania Integrated Neurodegenerative Disease Biobank. Alzheimer’s & Dementia. 2014 Jul;10(4):477-484.e1
9. Meguro R, Asano Y, Odagiri S, Li C, Iwatsuki H, Shoumura K. Nonheme-iron histochemistry for light and electron microscopy: a historical, theoretical and technical review. Archives of histology and cytology. International Society of Histology and Cytology; 2007;70(1):1–19
10. van Duijn S, Nabuurs RJA, van Duinen SG, Natté R. Comparison of Histological Techniques to Visualize Iron in Paraffin-embedded Brain Tissue of Patients with Alzheimer’s Disease. Journal of Histochemistry & Cytochemistry. 2013 Nov;61(11):785–792
Figures