1918
APOE genotype influences cerebral myelination in normative aging1Laboratory of Clinical Investigation, National Institute on Aging, Baltimore, MD, United States, 2Laboratory of Behavioral Neuroscience, National Institute on Aging, Baltimore, MD, United States
Synopsis
Little is known about the role of APOE isoforms in cerebral myelination. Although several quantitative MRI studies have demonstrated the influence of APOE on cerebral tissue integrity, its specific implication in brain myelination remains to be established. In this work, we investigated associations between APOE isoforms ε2 or ε4 and myelination, probed using specific and nonspecific measures of myelin content, in multiple brain regions in a cohort of cognitively unimpaired participants spanning a wide age range. We show significant correlations between APOE isoforms ε2 or ε4 and myelin content in several brain structures.
INTRODUCTION
The apolipoprotein E ε4 (APOE ε4) allele has been linked to greater risk of Alzheimer’s disease (AD) development (1), while emerging evidence suggests a protective effect of the APOE ε2 allele (2-4). Indeed, several magnetic resonance imaging (MRI) studies have examined and corroborated the differential effect of APOE isoforms on cerebral microstructural tissue integrity using MR relaxation times and diffusion tensor imaging (5-7). However, while sensitive to myelin content, these MR metrics are not specific so that the association between the APOE genotype and myelination remains to be established. In this study, we provide data on the effects of the APOE ε2 or APOE ε4 isoform on myelin content probed using our method of myelin water fraction (MWF) mapping, a surrogate of myelin content (8-10), and longitudinal relaxation rate (R1), a sensitive but nonspecific measure of myelin content (11). Our study was conducted on a large cohort of cognitively unimpaired subjects spanning a wide age-range.METHODS
Data acquisitionThe study cohort consisted of 92 cognitively unimpaired volunteers ranging in age from 24 to 94 years (61.2±19.8 years) of which 53 were men. The cohort consisted of 58 APOE ε33, 13 APOE ε2 homozygous or heterozygous, and 21 APOE ε4 homozygous or heterozygous. Each participant underwent our BMC-mcDESPOT protocol for MWF and R1 mapping (8-10).
Data analysis
For each participant, a whole-brain MWF map was generated using the BMC-mcDESPOT analysis from the SPGR, bSSFP, and DAM datasets (8-10). Moreover, corresponding whole-brain R1 map was derived from the SPGR and DAM datasets using the DESPOT1 approach (12). Further, using the FSL software (13), the averaged SPGR image over FAs was nonlinearly registered to the MNI space and the computed transformation matrix was then applied to the corresponding MWF and R1 maps. Eighteen white matter (WM) and gray matter (GM) cerebral regions-of-interest (ROIs) were defined from MNI. To investigate the effect APOE isoforms on MWF or R1, multi linear regression was applied using the mean MWF, or R1, value within each ROI as the dependent variable and the APOE status, sex, race, age, and age2 as the independent variables. APOE was defined as a 3-level categorical variable with ε33 as the reference group. The inclusion of age2 is based on our and others’ observations of a quadratic relationship between MWF and age (14-16).
RESULTS & DISCUSSION
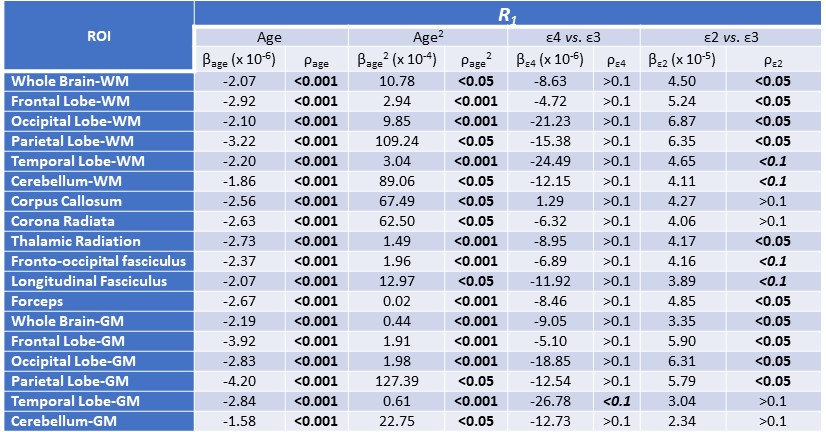
Figures 1&2 show, respectively, the relative mean MWF and R1 values, for the eighteen ROIs studied, of the APOE ε2/- and APOE ε4/- groups with respect to the reference group, that is, APOE ε33. For most ROIs, the APOE ε2/- group showed significantly greater mean MWF or R1 values than the reference or APOE ε4/- groups. Moreover, the APOE ε4/- group exhibits, overall, lower mean MWF or R1 values as compared to the reference group. Our statistical analysis indicated that this higher MWF or R1 values exhibited by the APOE ε2/- group were significant in several brain structures after accounting for age, age2, sex, and race (Tables 1&2). However, the lower MWF or R1 values exhibited by the APOE ε4/- group were significant in a limited number of cerebral regions (Tables 1&2).Although not significant, our results indicate a trend toward lower myelin content in adult ε4 carriers. These results support and extend on Dean and colleagues’ observation of lower MWF in several WM and GM regions in infant carriers of ε4 (17). Furthermore, our new finding of significantly higher myelin content in adult ε2 carriers agrees with Bartzokis et al. finding of higher relaxation rates in ε2 carriers as compared to ε4 and ε33 carriers, with a steeper slope of decline in relaxation rates with age than ε2 carriers (18, 19). Although these results were interpreted in terms of myelin differences, the relaxation rates measures while sensitive to myelin content, they are not specific. Therefore, our results add further evidence to these observations using a more specific measure of myelin content through MWF imaging. This motivates further investigations on larger cohorts of the role of APOE in normal human brain myelination and development including at very early stages.
APOE is primarily responsible for lipid transport and cholesterol homeostasis, the main constituents of myelin, in the central nervous system (20). Human APOE isoforms differ in the extent to which they are expressed and folded, and differentially modulate brain energy metabolism (21); these perhaps account for the differential effects on amyloid and tau proteins accumulation and clearance, as well as other physiological processes including myelin production. Further investigations are required to elucidate the implication of APOE in neuronal, synaptic, and myelin development.
Finally, as expected, the effects of age and age2 on MWF or R1 were significant on most ROIs while the effects of sex and race were, overall, not significant. These results agree with previous reports (14-16).
CONCLUSIONS
Using specific and nonspecific measures of myelin content to examine the relationship between APOE genotype in normative aging, we found significantly higher myelin content in ε2 carriers as compared to ε33 or ε4 carriers, while ε4 carriers exhibit trends toward lower myelin content. Further study on larger cohorts will be necessary to further elucidate this relationship between APOE genotype and cerebral myelination.Acknowledgements
This work was supported by the Intramural Research Program of the National Institute on Aging of the National Institutes of Health.References
1. Farrer LA, Cupples LA, Haines JL, Hyman B, Kukull WA, Mayeux R, et al. Effects of age, sex, and ethnicity on the association between apolipoprotein E genotype and Alzheimer disease. A meta-analysis. APOE and Alzheimer Disease Meta Analysis Consortium. Jama. 1997;278(16):1349-56.
2. Corder EH, Saunders AM, Risch NJ, Strittmatter WJ, Schmechel DE, Gaskell PC, Jr., et al. Protective effect of apolipoprotein E type 2 allele for late onset Alzheimer disease. Nat Genet. 1994;7(2):180-4.
3. Reiman EM, Arboleda-Velasquez JF, Quiroz YT, Huentelman MJ, Beach TG, Caselli RJ, et al. Exceptionally low likelihood of Alzheimer's dementia in APOE2 homozygotes from a 5,000-person neuropathological study. Nat Commun. 2020;11(1):667.
4. Shinohara M, Kanekiyo T, Tachibana M, Kurti A, Shinohara M, Fu Y, et al. APOE2 is associated with longevity independent of Alzheimer's disease. Elife. 2020;9:e62199.
5. Chiang GC, Zhan W, Schuff N, Weiner MW. White matter alterations in cognitively normal apoE ε2 carriers: insight into Alzheimer resistance? AJNR American journal of neuroradiology. 2012;33(7):1392-7.
6. Operto G, Cacciaglia R, Grau-Rivera O, Falcon C, Brugulat-Serrat A, Ródenas P, et al. White matter microstructure is altered in cognitively normal middle-aged APOE-ε4 homozygotes. Alzheimers Res Ther. 2018;10(1):48.
7. Williams OA, An Y, Beason-Held L, Huo Y, Ferrucci L, Landman BA, et al. Vascular burden and APOE ε4 are associated with white matter microstructural decline in cognitively normal older adults. NeuroImage. 2019;188:572-83.
8. Bouhrara M, Spencer RG. Incorporation of nonzero echo times in the SPGR and bSSFP signal models used in mcDESPOT. Magnetic resonance in medicine. 2015;74(5):1227-35.
9. Bouhrara M, Spencer RG. Improved determination of the myelin water fraction in human brain using magnetic resonance imaging through Bayesian analysis of mcDESPOT. NeuroImage. 2016;127:456-71.
10. Bouhrara M, Spencer RG. Rapid simultaneous high-resolution mapping of myelin water fraction and relaxation times in human brain using BMC-mcDESPOT. NeuroImage. 2017;147:800-11.
11. Yeatman JD, Wandell BA, Mezer AA. Lifespan maturation and degeneration of human brain white matter. Nature communications. 2014;5:4932-.
12. Deoni SC, Peters TM, Rutt BK. High-resolution T1 and T2 mapping of the brain in a clinically acceptable time with DESPOT1 and DESPOT2. Magnetic resonance in medicine. 2005;53(1):237-41.
13. Jenkinson M, Beckmann CF, Behrens TE, Woolrich MW, Smith SM. FSL. NeuroImage. 2012;62(2):782-90.
14. Arshad M, Stanley JA, Raz N. Adult age differences in subcortical myelin content are consistent with protracted myelination and unrelated to diffusion tensor imaging indices. NeuroImage. 2016;143:26-39.
15. Bouhrara M, Rejimon AC, Cortina LE, Khattar N, Bergeron CM, Ferrucci L, et al. Adult brain aging investigated using BMC-mcDESPOT based myelin water fraction imaging. Neurobiology of aging. 2020;85:131-9.
16. Qian W, Khattar N, Cortina LE, Spencer RG, Bouhrara M. Nonlinear associations of neurite density and myelin content with age revealed using multicomponent diffusion and relaxometry magnetic resonance imaging. NeuroImage. 2020;223:117369.
17. Dean DC, Iii, Jerskey BA, Chen K, et al. Brain differences in infants at differential genetic risk for late-onset alzheimer disease: A cross-sectional imaging study. JAMA Neurology. 2014;71(1):11-22.
18. Bartzokis G, Lu PH, Geschwind DH, Edwards N, Mintz J, Cummings JL. Apolipoprotein E genotype and age-related myelin breakdown in healthy individuals: implications for cognitive decline and dementia. Arch Gen Psychiatry. 2006;63(1):63-72.
19. Bartzokis G, Lu PH, Geschwind DH, Tingus K, Huang D, Mendez MF, et al. Apolipoprotein E affects both myelin breakdown and cognition: implications for age-related trajectories of decline into dementia. Biological psychiatry. 2007;62(12):1380-7.
20. Hauser PS, Narayanaswami V, Ryan RO. Apolipoprotein E: from lipid transport to neurobiology. Prog Lipid Res. 2011;50(1):62-74.
21. Wu L, Zhang X, Zhao L. Human ApoE Isoforms Differentially Modulate Brain Glucose and Ketone Body Metabolism: Implications for Alzheimer's Disease Risk Reduction and Early Intervention. The Journal of neuroscience : the official journal of the Society for Neuroscience. 2018;38(30):6665-81.
Figures
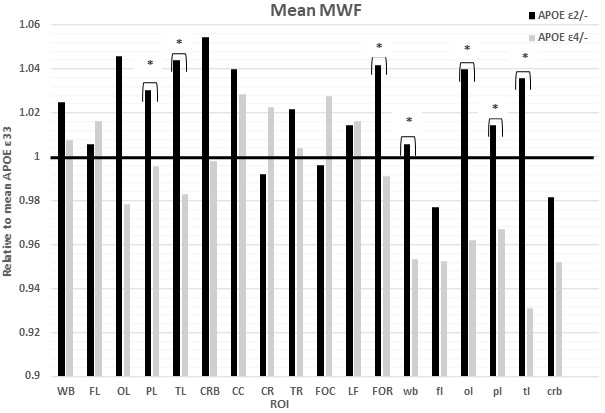
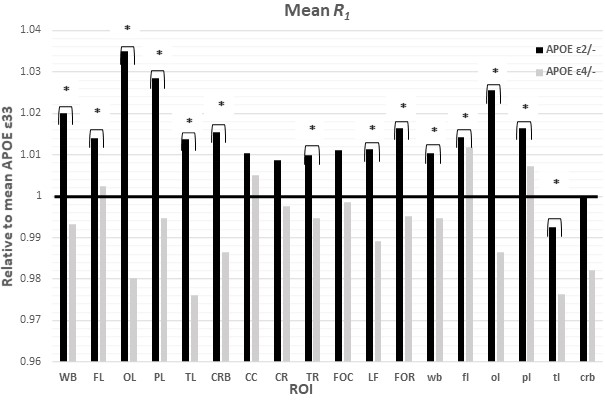
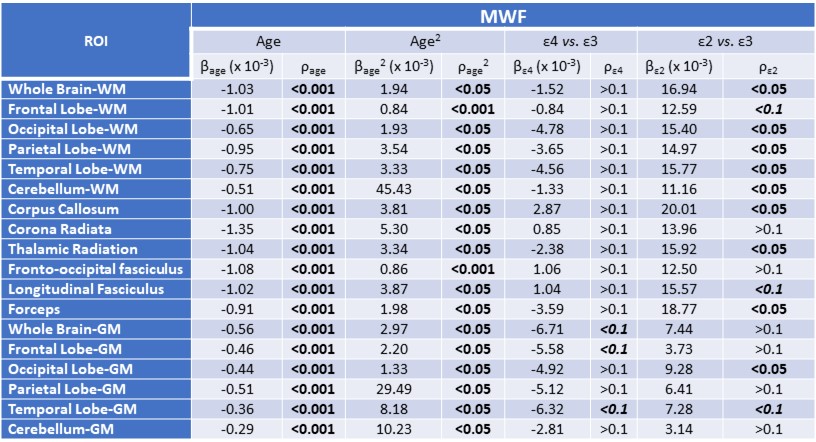
Table 1. Slope, β, and significance, ρ, of the regression terms incorporated in the multiple linear regression given by MWF ~ β0 + βage × age + βsex × sex + βAPOE × APOE + βrace × race + βage2 × age2. Sex and race results are not shown as they exhibited overall non-significant associations with MWF in most ROIs.