1917
Neurite dispersion and density across the adult lifespan investigated using a modified NODDI approach1National Institute on Aging, NIH, Baltimore, MD, United States
Synopsis
The NODDI approach has been shown to overestimate the CSF and neurite density (NDI) fractions in white matter. We propose a new modification to the NODDI algorithm to address these issues. Our approach requires minimal extension of the total acquisition time. While the neurite orientation dispersion (ODI) values were consistent between the two approaches, the modified NODDI approach provides lower, more physiologically plausible, NDI values as compared to those derived using the original NODDI approach. Further, NDI and ODI exhibit, overall, quadratic associations with age. These associations were more pronounced and significant from results derived using the modified NODDI approach.
Intoduction
The neurite orientation dispersion and density imaging (NODDI) is a multicomponent diffusion MRI technique that provides measures of both neurite density and dispersion through computation of the orientation dispersion index (ODI) and the neurite density index (NDI), respectively (1). Although NODDI has gained rapid popularity and has been extensively used in studies of aging and neurodegeneration (2-4), it has been criticized as it overestimates the isotopically diffusing water fraction (fiso) of the cerebrospinal fluid (CSF) compartment (Fig.1), while providing unrealistically large values of the NDI in white matter (WM) (1, 5, 6); this is likely due to the assumption of equal transverse relaxation time values for all three compartments modelled in NODDI (5). In a recent work, Bouyagoub and colleagues have suggested rescaling fiso using predetermined T2 values of the CSF and intra/extra cellular water compartments (6). Although this approach has led to lower fiso and plausible NDI values in WM, it drastically extends the total acquisition needed for the estimation of these transverse relaxation times. Here, we propose a simple modification of the NODDI approach which requires minimal extension of the acquisition time. Derived NDI and ODI results from the original and our modified NODDI approaches were compared on a wide age-range cohort of cognitively unimpaired subjects.Methods
Modified NODDI: In the original NODDI approach, fiso is derived along with NDI and ODI (1) (Fig.1). We modified the NODDI MATLAB toolbox so that fiso can be used as an input (i.e. known) parameter/map. Here the fiso map is derived, from a structural SPGR image, using the hidden Markov random field model and the expectation-maximization algorithm (7), as implemented in the FSL software (8) (Fig.1).Image acquisition: NODDI images were acquired from 58 cognitively unimpaired participants spanning a wide range of ages from 21 to 83 years (45.4±18.3years), including 31 males. Specifically, diffusion-weighted images were acquired along 32 directions, with two b-values of 700 and 2000s/mm2, using a single-shot EPI sequence, TR=10000ms, TE=67ms, matrix size=120×120, 50 slices, voxel size=2mm×2mm×3mm, and acquisition time=~12min. Further, a 3D SPGR image was acquired with TR=5ms, TE=1.37ms, flip angle=10o, and acquisition time=~30s. All images were acquired with field-of-view=240mm×208mm×150mm, SENSE factor=2, and reconstructed to voxel size of 2mm×2mm×2mm.
Image processing: For each participant, NDI and ODI maps were generated using NODDI or modified NODDI. Derived maps were nonlinearly registered to the MNI space using FSL (8). Finally, 21 ROIs were selected from the MNI atlas (Fig.5).
Data analysis: To investigate age and sex effects on NDI or ODI in each ROI, linear regression analyses were performed using the mean value of NDI or ODI within each ROI as the dependent variable and sex, age, and age2 as independent variables.
Results and Discussion
Fig.2 shows average NDI or ODI maps, derived using NODDI (Fig.2a) or modified NODDI (Fig.2b), by age decade. Visual inspection indicates an increase in NDI values from early adulthood until middle age, followed by decreases in several brain regions, while ODI values appear to exhibit minimal differences with age. More importantly, the NDI maps derived from NODDI exhibit unrealistic values exceeding 0.7 in different brain structures, while NDI values derived from the modified NODDI approach are much lower and within the physiological ranges. Furthermore, ODI maps derived using both NODDI approaches are very similar. These results agree with Bouyagoub et al. observations (6).Figs.3&4 shows, respectively, NDI or ODI values as a function of age for representative WM regions. The best-fit curves indicate that while the fundamental quadratic relationships between NDI or ODI and age, were consistent across ROIs, these patterns differed in detail among regions and between NODDI approaches. Interestingly, the quadratic effect of age, age2, on NDI was significant (p<0.05) or close to significance (p<0.1) in most regions using the modified NODDI approach, while this inverted U-shape association was limited to a few cerebral regions using the original NODDI approach (Fig.5). This likely indicates the higher sensitivity of the modified NODDI approach to capture differences in neurite density with age, corresponding to brain maturation through middle age followed by a more rapid decrease in axonal density at older ages, in agreement with recent literature (2, 4). Finally, our results show that ODI follows a U-shaped relationship with age, reflecting decreased neurite dispersion until middle age followed by a rapid increase afterward. While this agrees with Nazeri and colleagues’ finding (9), results of the patterns of ODI with age are sparse and further investigations are required (4, 9-11). Finally, derived ODI values from NODDI and modified NODDI as well as their corresponding statistical analysis results were identical (Fig.5); this indicates that ODI is less affected by the fiso rescaling, in agreement with Bouyagoub et al. observation (6).
Conclusions
We introduced a new modification of the NODDI approach for improved determination of the neurite density and dispersion. This approach is clinically feasible requiring the minimal extension of the acquisition time. Our results show significant associations between axonal density or dispersion and age as described by quadratic trends in several cerebral WM regions. These associations were markedly pronounced and significant using our modified NODDI approach as compared to the results derived from the original NODDI.Acknowledgements
This work was supported by the Intramural Research Program of the National Institute on Aging of the National Institutes of Health.
References
1. Zhang H, Schneider T, Wheeler-Kingshott CA, Alexander DC. NODDI: practical in vivo neurite orientation dispersion and density imaging of the human brain. NeuroImage. 2012;61(4):1000-16. 2. Qian W, Khattar N, Cortina LE, Spencer RG, Bouhrara M. Nonlinear associations of neurite density and myelin content with age revealed using multicomponent diffusion and relaxometry magnetic resonance imaging. NeuroImage. 2020;223:117369.
3. Colgan N, Siow B, O'Callaghan JM, Harrison IF, Wells JA, Holmes HE, et al. Application of neurite orientation dispersion and density imaging (NODDI) to a tau pathology model of Alzheimer's disease. NeuroImage. 2016;125:739-44.
4. Beck D, de Lange A-MG, Maximov II, Richard G, Andreassen OA, Nordvik JE, et al. White matter microstructure across the adult lifespan: A mixed longitudinal and cross-sectional study using advanced diffusion models and brain-age prediction. NeuroImage. 2021;224:117441.
5. Gong T, Tong Q, He H, Sun Y, Zhong J, Zhang H. MTE-NODDI: Multi-TE NODDI for disentangling non-T2-weighted signal fractions from compartment-specific T2 relaxation times. NeuroImage. 2020;217:116906.
6. Bouyagoub S, Dowell N, Hurley S, TC. W, M. C. Overestimation of CSF fraction in NODDI: possible correction techniques and the effect on neurite density and orientation dispersion measures. ISMRM; Singapore2016.
7. Zhang Y, Brady M, Smith S. Segmentation of brain MR images through a hidden Markov random field model and the expectation-maximization algorithm. IEEE transactions on medical imaging. 2001;20(1):45-57.
8. Jenkinson M, Beckmann CF, Behrens TE, Woolrich MW, Smith SM. FSL. NeuroImage. 2012;62(2):782-90.
9. Nazeri A, Chakravarty MM, Rotenberg DJ, Rajji TK, Rathi Y, Michailovich OV, et al. Functional consequences of neurite orientation dispersion and density in humans across the adult lifespan. The Journal of neuroscience : the official journal of the Society for Neuroscience. 2015;35(4):1753-62.
10. Billiet T, Vandenbulcke M, Mädler B, Peeters R, Dhollander T, Zhang H, et al. Age-related microstructural differences quantified using myelin water imaging and advanced diffusion MRI. Neurobiology of aging. 2015;36(6):2107-21.
11. Chang YS, Owen JP, Pojman NJ, Thieu T, Bukshpun P, Wakahiro MLJ, et al. White Matter Changes of Neurite Density and Fiber Orientation Dispersion during Human Brain Maturation. PloS one. 2015;10(6):e0123656.
Figures
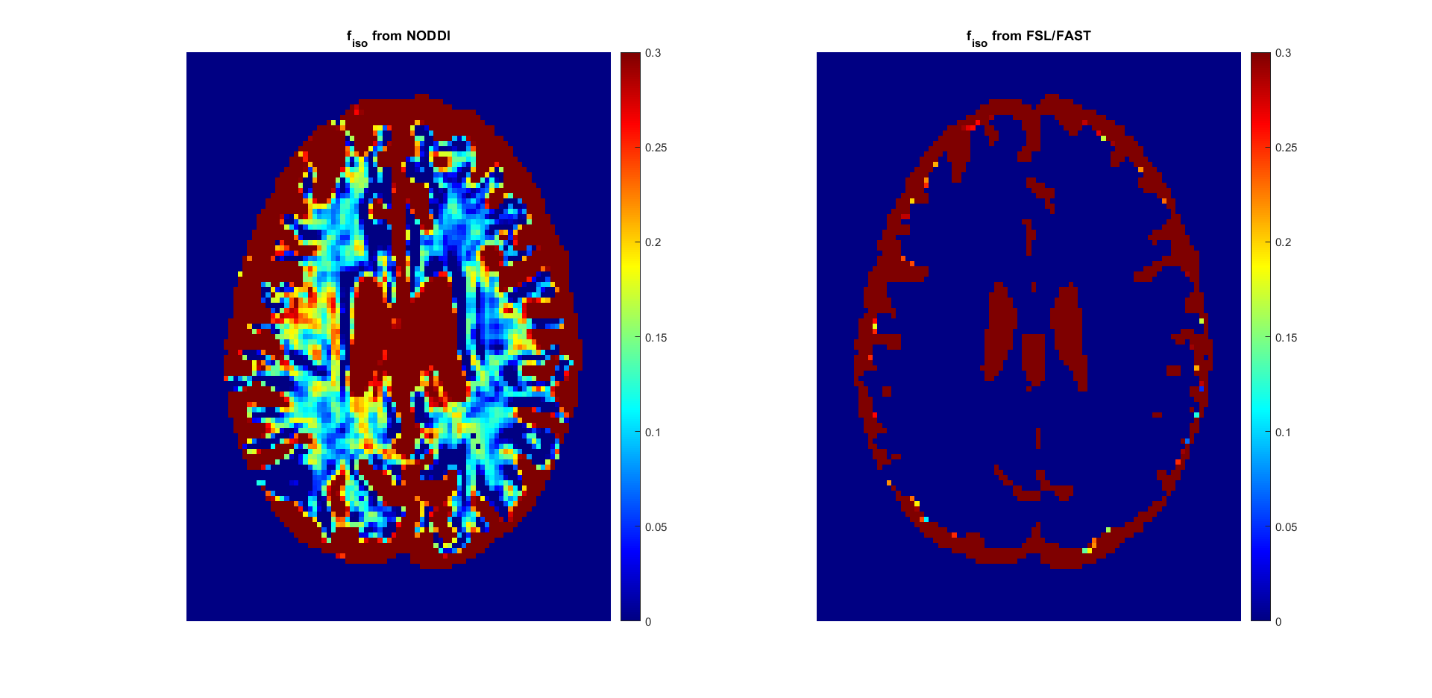
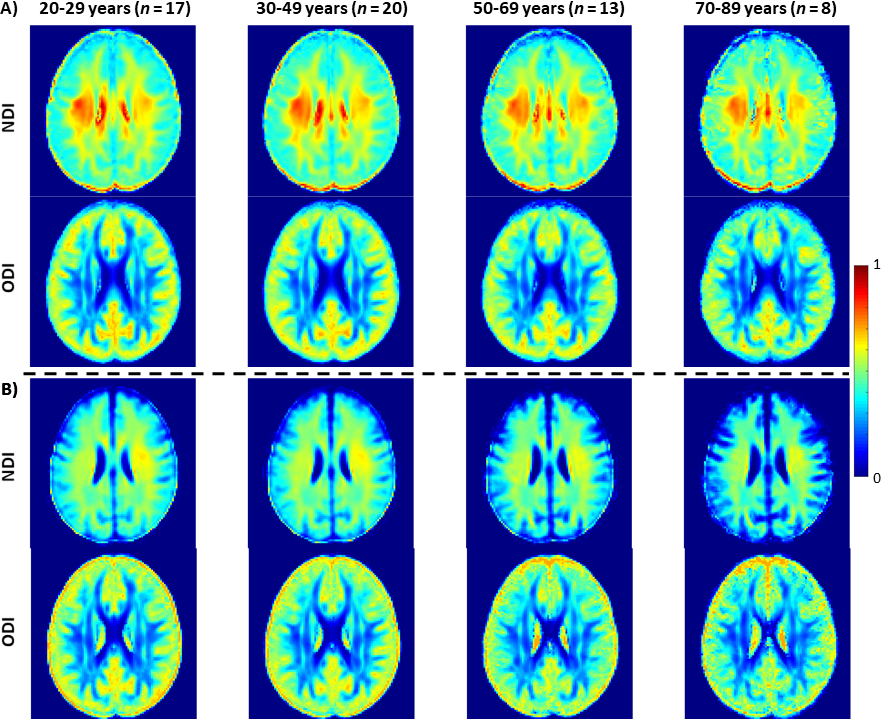
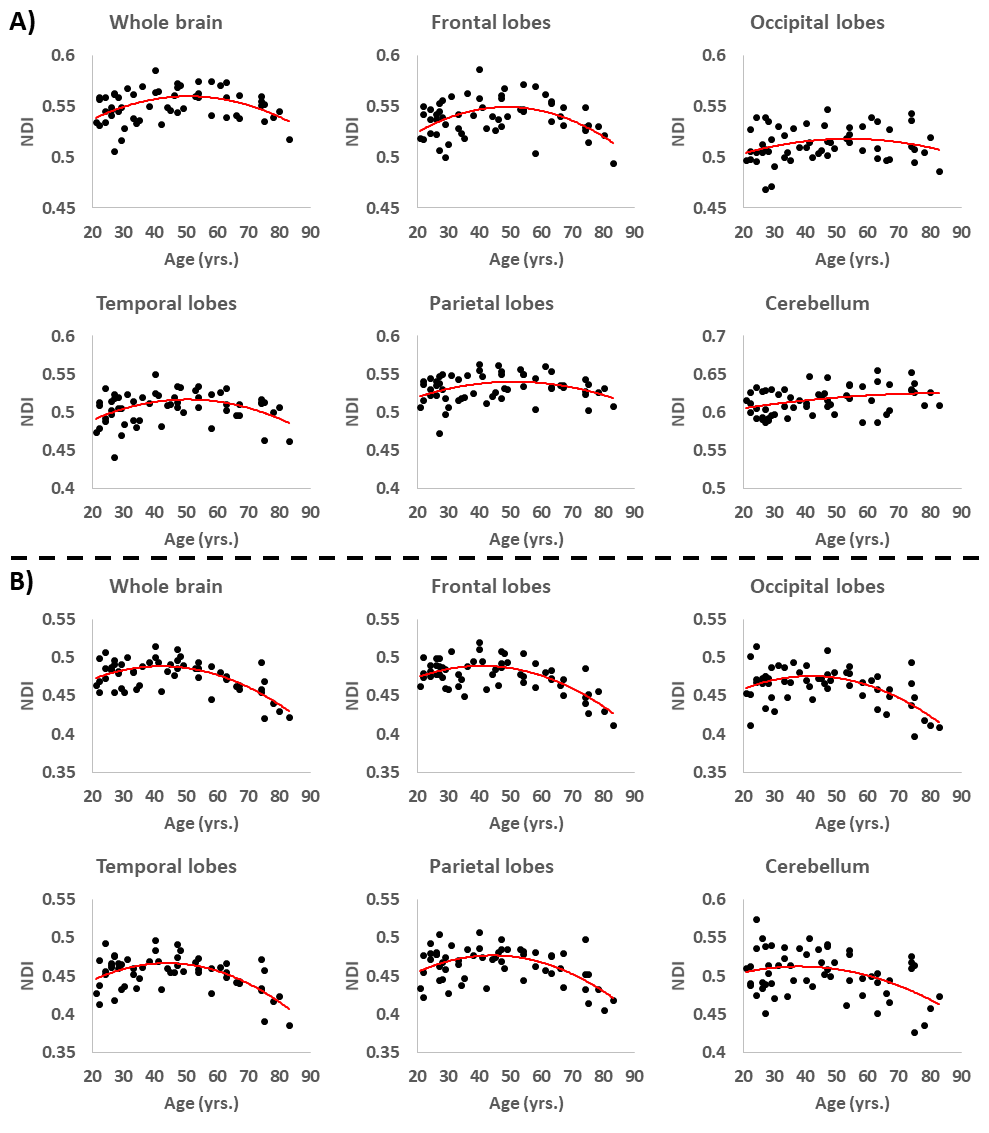
Figure 3. Examples of regional NDI trends as a function of age. A) NDI results derived from the original NODDI approach, and B) NDI results derived using our modified NODDI approach. Although most regions investigated show inverted U-shaped trends of NDI with age, these quadratic trends were more noticeable and significant from the NDI results derived using our modified NODDI approach (see Fig.5).
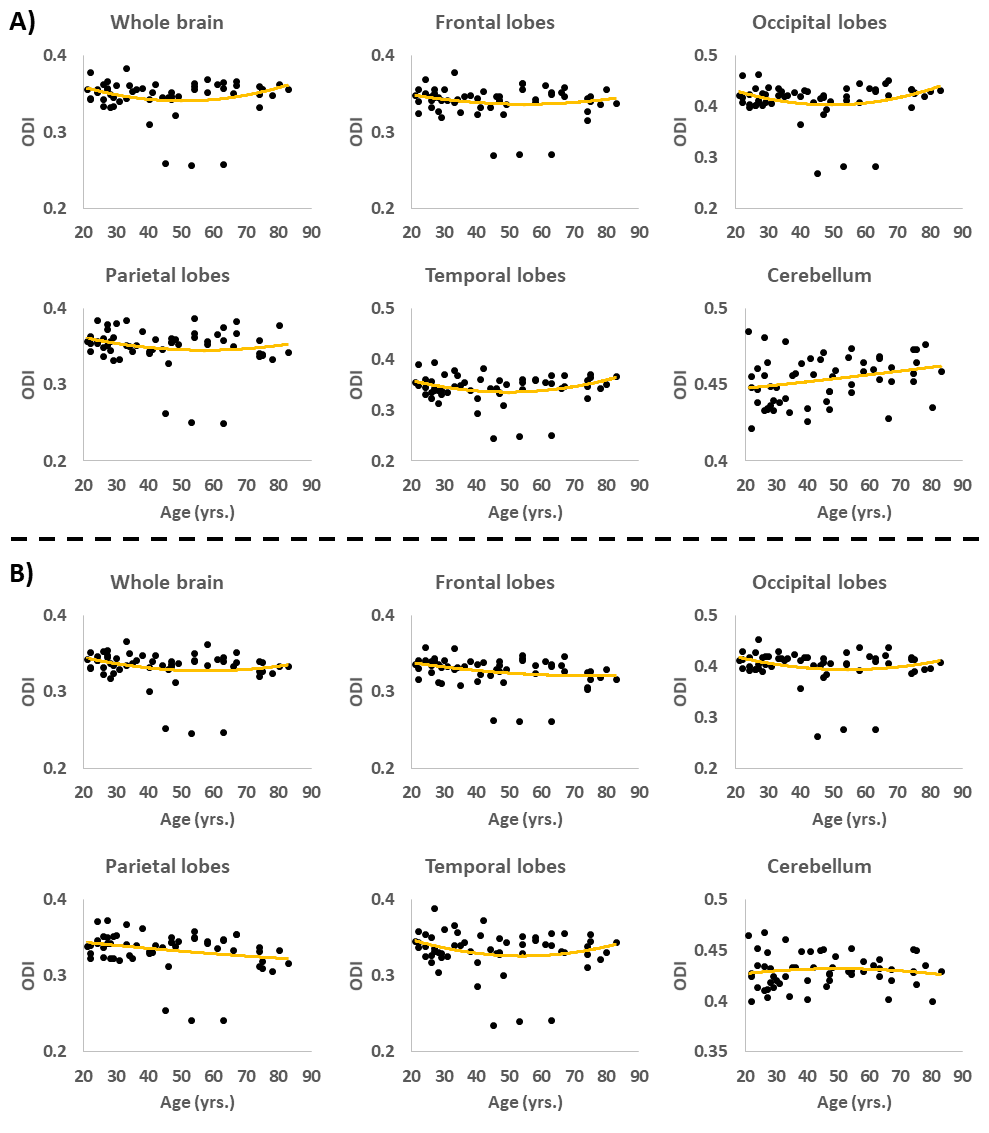
Figure 4. Examples of regional ODI trends as a function of age. A) ODI results derived from the original NODDI approach, and B) ODI results derived using our modified NODDI approach. Several regions investigated show U-shaped trends of ODI with age. Results were very similar for both NODDI approaches (see Fig. 5).
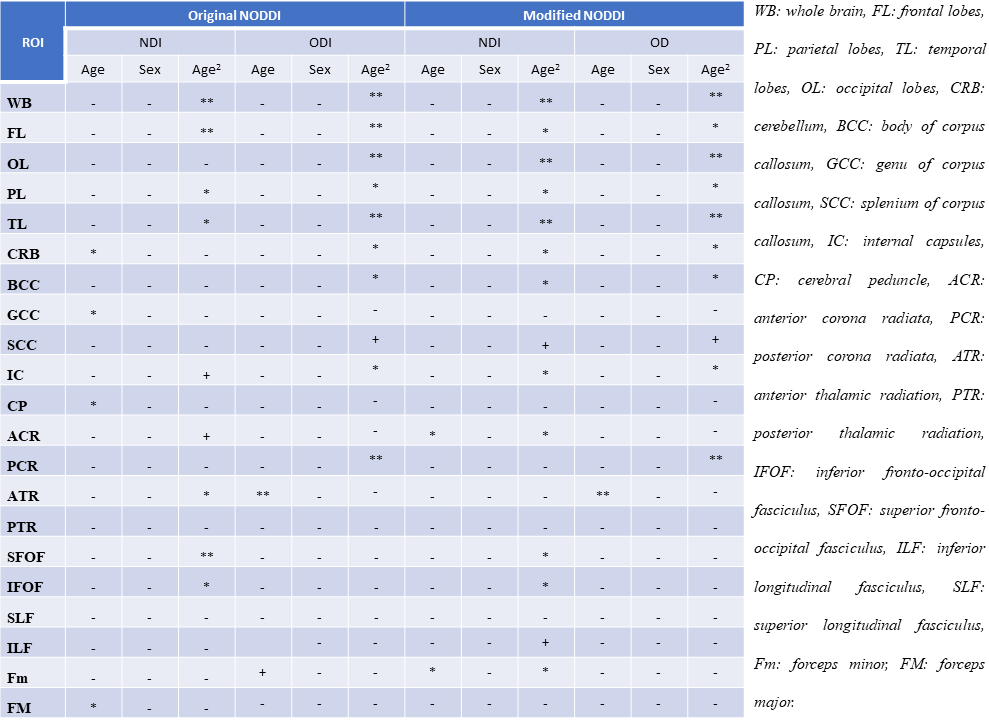
Figure 5. Significance of each coefficient incorporated into the linear regression analysis of NDI or ODI derived from NODDI or modified NODDI in each region-of-interest (ROI). * indicates p < 0.05, ** indicates p < 0.01, + indicates p < 0.1, and - indicates non-significant effects. All p-values presented are obtained after FDR correction.