1914
Associations between Resting-state EEG and fMRI signals in Brain Aging1Rotman Research Institute, Baycrest Health Sciences, Toronto, ON, Canada, 2Department of Medical Biophysics, University of Toronto, Toronto, ON, Canada
Synopsis
Frequency and amplitude features for EEG and resting-state functional magnetic resonance imaging (rs-fMRI) data are individually used in human brain aging research. However, the association between the age effects on these two modalities is still unknown. In this study, we examined age effects on EEG and rs-fMRI from both frequency and amplitude perspectives. We found that while both EEG and fMRI are affected by age, there is no association between these respective age effects.
Introduction
Investigating the association between electroencephalography (EEG) and resting-state fMRI (rs-fMRI) signals in aging could help us better understand the mechanism of rs-fMRI signal variations in brain aging. Recent research published by Kumral et. al [1] produced the first direct comparison of the effects of age and sex on resting-state EEG and fMRI amplitudes from the same subject and concluded that there is no correlation between age effects on fMRI and EEG power. Nevertheless, age effects on EEG and fMRI frequency were not examined. Moreover, the association between the EEG and rs-fMRI remains unanswered. In prior literature, the relationship between EEG and fMRI signal amplitudes have been used to assess neurovascular coupling [2][3]. In this study, we apply the same principle to the resting state, and assess the effect of aging. Furthermore, we quantify the mediating effect of EEG metrics on the age effect as detected using rs-fMRI metrics.Method
Subjects: The “Leipzig Study for Mind-Body-Emotion Interaction” (LEMON, publicly available at http://fcon_1000.projects.nitrc.org/indi/retro/MPI_LEMON.html) [4] dataset comprises 227 healthy subjects in two age groups (older: N = 74, 37 females, 59-77 years old; younger: N=153, 45 females, 20-35 years old). No participant reported a history of cardiovascular disease, psychiatric disease, neurological disorders, malignant disease, or medication/drug use that could affect the study.MRI Image Acquisition: Structural T1-weighted image was acquired using an MP2RAGE sequence. rs-fMRI BOLD images were acquired with gradient-echo EPI sequence with parameters, TR=1400 ms, TE=30 ms, flip angle=69 deg, bandwidth=1776 Hz/pixel, partial Fourier ⅞, voxel size 2.3 mm isotropic. Participants were informed to keep their eyes open while focusing on a low-contrast cross during the scan.
EEG Acquisition: Sixteen minutes of resting-state EEG was recorded with BrainAmp MR-plus amplifiers using 62-channel active ActiCAP electrodes attached according to the international standard 10-10 system and referenced to FCz. The ground electrode located at the sternum and skin-electrode interface impedance was kept below 5 kOhm. Only eye-open sessions of EEG were used in the analysis.
fMRI Preprocessing: (I) 3D motion correction (II) slice-timing correction, (III) brain extraction, (IV) rigid body coregistration of functional data to the individual T1 image, (V) white-matter and CSF regression, (VI) bandpass filtering to obtain band 1 ( 0.01-0.1 Hz) and band 2 (0.1-0.3 Hz), (VII) spatial normalization to MNI152 (Montreal Neurological Institute) standard space with spatial resolution 2mm isotropic, (VIII) spatial smoothing with 6 mm full-width half-maximum Gaussian kernel.
EEG Preprocessing: (I) down-sampling from 2500 Hz to 250 Hz, (II) band-pass filtering within 1-45 Hz 4th order back and forth Butterworth filter (III) splitting into eyes-open and eyes-closed condition, (IV) Visual inspection and ICA to remove noise, (V) source reconstruction with eLORETA (exact low-resolution brain electromagnetic tomography) [5] implemented in the M/EEG toolbox of Hamburg (METH) [6]. (VI) Temporal smoothing with moving epochs that match the TR of the fMRI data (1.4 sec).
Data analysis: The standard deviation and peak frequency (central of mass approach defined by Eq. 1) of both rs-fMRI and EEG were calculated voxel-based and averaged based on Harvard-Oxford atlas [7].
$${frequency\;at\;centre\;of\;mass} = \frac{\sum_{i=0}^m {P_i f_i}}{\sum_{i=0}^m {P_i}}\,(Eq. 1) $$
Where P is power and f is frequency
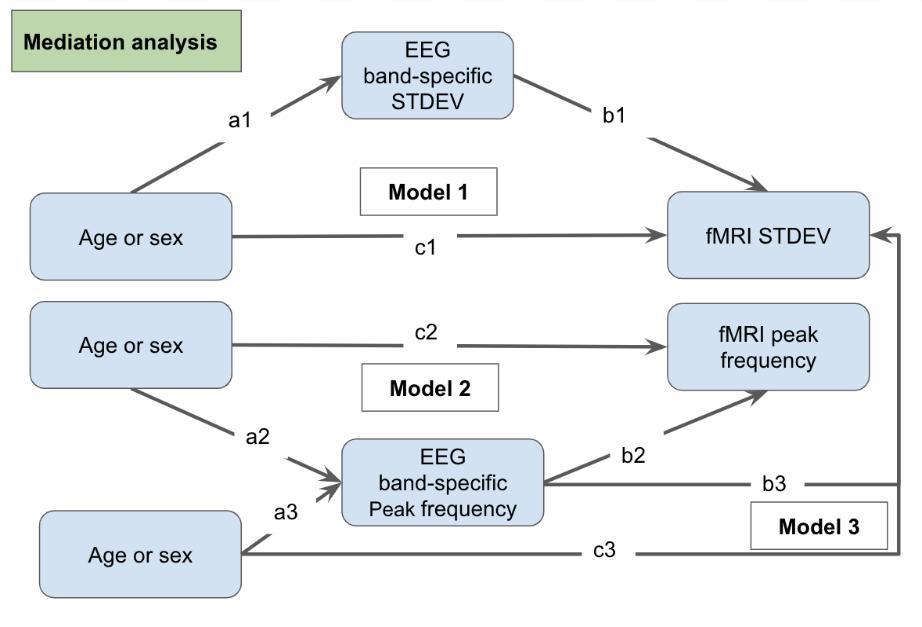
Mediation pathway analysis [8] was applied to investigate the association between EEG frequency and BOLD frequency as well as EEG standard deviation and BOLD standard deviation with 3 different models (Fig 1). Also, the standard deviation ratio between EEG and fMRI was calculated for each ROI (Eq. 2). Non-parametric analysis of covariance (ANCOVA, type III) and Tukey's HSD post-hoc comparisons was employed to investigate age effects in standard deviation ratio in these ROIs.
$$ SD{ratio} = \frac{SD_{BOLD}}{SD_{EEG}}(Eq. 2)\,$$
Results
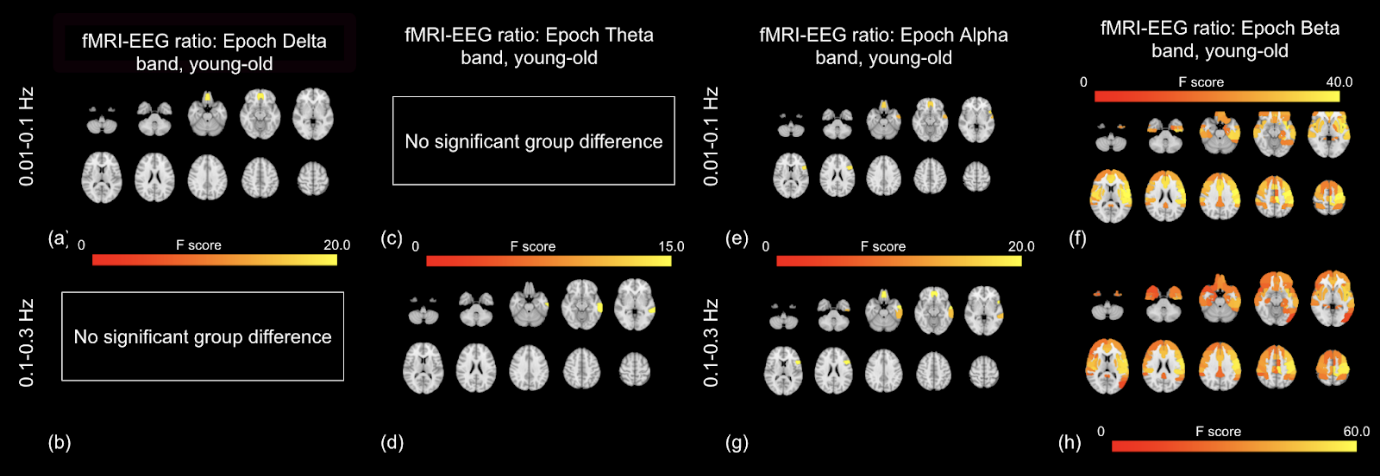
The percentages of mediation for all 3 models are < 1% in all ROIs, indicating the mediation effects are negligible. The spatial distributions of significant age effects in rs-fMRI-EEG power ratio (SDratio) are shown in Fig. 2. The alpha SDratio in the 0.01-0.1 Hz fMRI frequency band is significantly higher in younger adults. The same is true for the beta SDratio in both the 0.01-0.1 Hz band and 0.1-0.3 Hz bands. The age effect is negligible for the fMRI-delta power ratio in the 0.01-0.1Hz band, the fMRI-alpha band in the 0.1-0.3 Hz frequency band, and the fMRI-theta power ratio.Discussion
The fMRI-EEG ratio in 0.01-0.1 Hz band has been suggested to reflect neurovascular coupling and to be lower in older adults [9]. This is consistent with our results. Conversely, fMRI-EEG ratio in the 0.1-0.3 Hz band reflects low EEG-fMRI association in this band, suggesting non-neuronal origins. These are consistent with our finding shown in Fig 2. Conversely, although resting delta power has been reported to be strongly correlated with rs-fMRI signal amplitude [10], the mediation effect of EEG (amplitude or frequency) on fMRI fluctuation amplitude was negligible. Alternative mediators, including vascular [11] and metabolic ones [12], will be the subject of future research.Acknowledgements
The authors acknowledge funding support from the Canadian Institutes of Health Research (CIHR) and the Natural Sciences and Engineering Research Council of Canada (NSERC).References
[1] Kumral, D., Şansal, F., Cesnaite, E., Mahjoory, K., Al, E., Gaebler, M., Nikulin, V.V., Villringer, A., 2019. BOLD and EEG signal variability at rest differently relate to aging in the human brain. Neuroimage 116373.
[2] Mullinger, K.J., Cherukara, M.T., Buxton, R.B., Francis, S.T., Mayhew, S.D., 2017. Post-stimulus fMRI and EEG responses: Evidence for a neuronal origin hypothesised to be inhibitory. Neuroimage 157, 388–399.
[3] Mullinger, K.J., Mayhew, S.D., Bagshaw, A.P., Bowtell, R., Francis, S.T., 2013. Poststimulus undershoots in cerebral blood flow and BOLD fMRI responses are modulated by poststimulus neuronal activity. Proc. Natl. Acad. Sci. U. S. A. 110, 13636–13641.
[4] Babayan, A., Erbey, M., Kumral, D., Reinelt, J.D., Reiter, A.M.F., Röbbig, J., Schaare, H.L., Uhlig, M., Anwander, A., Bazin, P.-L., Horstmann, A., Lampe, L., Nikulin, V.V., Okon-Singer, H., Preusser, S., Pampel, A., Rohr, C.S., Sacher, J., Thöne-Otto, A., Trapp, S., Nierhaus, T., Altmann, D., Arelin, K., Blöchl, M., Bongartz, E., Breig, P., Cesnaite, E., Chen, S., Cozatl, R., Czerwonatis, S., Dambrauskaite, G., Dreyer, M., Enders, J., Engelhardt, M., Fischer, M.M., Forschack, N., Golchert, J., Golz, L., Guran, C.A., Hedrich, S., Hentschel, N., Hoffmann, D.I., Huntenburg, J.M., Jost, R., Kosatschek, A., Kunzendorf, S., Lammers, H., Lauckner, M.E., Mahjoory, K., Kanaan, A.S., Mendes, N., Menger, R., Morino, E., Näthe, K., Neubauer, J., Noyan, H., Oligschläger, S., Panczyszyn-Trzewik, P., Poehlchen, D., Putzke, N., Roski, S., Schaller, M.-C., Schieferbein, A., Schlaak, B., Schmidt, R., Gorgolewski, K.J., Schmidt, H.M., Schrimpf, A., Stasch, S., Voss, M., Wiedemann, A., Margulies, D.S., Gaebler, M., Villringer, A., 2019. A mind-brain-body dataset of MRI, EEG, cognition, emotion, and peripheral physiology in young and old adults. Sci Data 6, 180308.
[5] Pascual-Marqui, R.D., 2007. Discrete, 3D distributed, linear imaging methods of electric neuronal activity. Part 1: exact, zero error localization. arXiv [math-ph].
[6] Haufe, S., Ewald, A., 2019. A Simulation Framework for Benchmarking EEG-Based Brain Connectivity Estimation Methodologies. Brain Topogr. 32, 625–642.
[7] Desikan, R.S., Ségonne, F., Fischl, B., Quinn, B.T., Dickerson, B.C., Blacker, D., Buckner, R.L., Dale, A.M., Maguire, R.P., Hyman, B.T., Albert, M.S., Killiany, R.J., 2006. An automated labeling system for subdividing the human cerebral cortex on MRI scans into gyral based regions of interest. Neuroimage 31, 968–980.
[8] Hayes, A.F., 2013. Introduction to mediation, moderation, and conditional process analysis: A regression-based approach. Methodology in the social sciences. 507.
[9] Fabiani, M., Gordon, B.A., Maclin, E.L., Pearson, M.A., Brumback-Peltz, C.R., Low, K.A., McAuley, E., Sutton, B.P., Kramer, A.F., Gratton, G., 2014. Neurovascular coupling in normal aging: a combined optical, ERP and fMRI study. Neuroimage 85 Pt 1, 592–607.
[10] Portnova, G.V., Tetereva, A., Balaev, V., Atanov, M., Skiteva, L., Ushakov, V., Ivanitsky, A., Martynova, O., 2017. Correlation of BOLD Signal with Linear and Nonlinear Patterns of EEG in Resting State EEG-Informed fMRI. Front. Hum. Neurosci. 11, 654.
[11] Tsvetanov, K.A., Henson, R.N.A., Tyler, L.K., Davis, S.W., Shafto, M.A., Taylor, J.R., Williams, N., Cam-Can, Rowe, J.B., 2015. The effect of ageing on fMRI: Correction for the confounding effects of vascular reactivity evaluated by joint fMRI and MEG in 335 adults. Hum. Brain Mapp. 36, 2248–2269.
[12] Jamadar, S.D., Ward, P.G.D., Liang, E.X., Orchard, E.R., Chen, Z., Egan, G.F., 2020. Metabolic and haemodynamic resting-state connectivity of the human brain: a high-temporal resolution simultaneous BOLD-fMRI and FDG-fPET multimodality study. Cold Spring Harbor Laboratory.
Figures