1911
Association between Brain Tissue Loss and Blood Biomarkers of HO-1, PPIA, and IRE1 in Patients with Alzheimer's Disease1Radiology, Kyung Hee University Hospital at Gangdong, Seoul, Korea, Republic of, 2Medicine, Kyung Hee University, Seoul, Korea, Republic of, 3Biomedical Engineering, Kyung Hee University, Yongin-si, Korea, Republic of, 4Neurology, Kyung Hee University Hospital at Gangdong, Seoul, Korea, Republic of, 5Biochemistry and Molecular Biology, Kyung Hee University, Seoul, Korea, Republic of
Synopsis
We evaluated the relationship between imaging biomarker by GMV changes and blood biomarkers by plasma levels of HO-1, PPIA, and IRE1 in the groups of cognitively normal (CN), amnestic mild cognitive impairment (MCI), and AD participants. Our study demonstrates that subjects with AD have lower circulating levels of HO-1 than subjects with MCI and the plasma HO-1 levels were positively associated with the global GMV. Considering the potential roles of each enzyme in pathogenesis of AD, the plasma circulating levels of these enzymes possibly reflect the pathological changes of the brain in AD and would be candidates for blood-based biomarkers.
Background
Many researchers have focused on the identification of blood-based biomarkers for Alzheimer's disease (AD). However, until now, no blood-based biomarker having a direct association with the pathogenesis of AD has been found. In this study, we interested in three possible blood-based targets, which may have an association with the AD pathogeneses. First, heme oxygenase-1 (HO-1) is known as up-regulator in AD and is associated with free radicals and oxidative stress which play a role in neurofibrillary tangles (1). Second, peptidylprolyl isomerase A (PPIA) (also known as cyclophilin A, CyPA) provides protection of neurons against copper-mediated oxidative stress (2). In AD, PPIA can influence Aβ levels (2). Finally, inositol-requiring enzyme 1 (IRE1) is a major stress transducer in endoplasmic reticulum (ER) stress and abnormal protein aggregation, highlighted in unfolded protein response (UPR) which reflects disturbed homeostasis in the ER (3).Purpose
There is no study to evaluate the relationship between GMV loss and the levels of the three blood-based biomarkers. We thought that GMV loss in AD may be associated with HO-1, PPIA, and/or IRE1. Therefore, in this study, we evaluated the relationship between imaging biomarkers by brain tissue volume changes and blood biomarkers by plasma levels of HO-1, PPIA, and IRE1 in the groups of cognitively normal (CN), amnestic mild cognitive impairment (MCI)I, and AD participants.Methods
Participants: Table 1 summarizes the demographic data, results of the neuropsychological test, the three blood-based biomarkers, and results of statistical analyses.Plasma levels of HO-1, PPIA, and IRE1: Target proteins in plasma levels were obtained according to manufacturer's recommended protocol (Elabscience, Houston, TX, USA). Plasma protein concentrations were then calculated from the standard curve.
MRI acquisition: To evaluate the brain tissue volumes, a sagittal structural 3D T1-weighted (T1W) image was acquired with the magnetization-prepared rapid acquisition of gradient echo (MPRAGE) sequence with voxel size =1× 1× 1 mm3 using a 3 T MRI system (Achieva, Philips Medical Systems) equipped with an eight-channel SENSE head coil.
Imaging processing: The post-processing steps were performed using a Statistical Parametric Mapping Version 12 (SPM12) program (Wellcome Department of Imaging Neuroscience, University College, London, UK). The spatially normalized both GMV and WMV was smoothed using the Gaussian kernel of 8× 8× 8 mm3 FWHM for the following statistical analyses.
Statistical analyses: To assess the relationship between GMV or WMV loss and the levels of the three blood biomarkers, the voxel-based multiple regression analysis was performed for using all participant data. In addition, region-of-interest (ROI)-based analysis was performed to determine correlations between ROI-based brain tissue volumes and the levels of the plasma biomarkers. To investigate the relationship between GMV or WMV at each ROI and the plasma levels of HO-1, PPIA, and IRE1, we performed the Pearson correlation analyses. This analysis was performed using MedCalc statistical software (http://www.medcalc.org/, Ostend, Belgium).
Results
Correlation Analyses between Subject’s Characteristics and Blood Biomarkers:Table 1 summarizes of the demographic data, results of the neuropsychological test, the three blood-based biomarkers, and results of statistical analyses.First, the CypA value was significantly positively correlated with MMSE scores (r=0.2154, p=0.0192). Second, the HO-1 value was significantly negatively correlated with age (r=-0.2262, p=0.0138), but was positively correlated with the K-MMSE score (r=0.2495, p=0.0064). Finally, the IRE1 value was significantly positively correlated with age (r=0.2220, p=0.0157), but was negatively correlated with K-MMSE scores (r=-0.2411, p=0.0085).
Voxel-based multiple regression Analyses:
The results of the voxel-based multiple regression analyses between GMV/WMV and the three blood biomarkers are summarized in Figure 1. GMV was positively correlated with CypA and HO-1, but negatively correlated with IRE1. CypA values were increased with increasing GMV at the occipital lobe (Cluster 1), temporal lobe, and cerebellum. HO-1 values were increased with increasing GMV at uncus (Cluster 2) and the postcentral gyrus. IRE1 values were decreased with increasing GMV at the lateral globus pallidus and putamen (Cluster 3), and hypothalamus. WMV was positively correlated with CypA, but negatively correlated with IRE1. CypA values were increased with increasing WMV at the inferior parietal lobule and the middle temporal gyrus (Cluster 4). IRE1 values were decreased with increasing WMV at the precuneus and cuneus (Cluster 5).
ROI-based correlation analyses:
Figure 2 shows the results of correlation analyses between ROI-based GMV and the levels of the three plasma biomarkers. CypA was positively correlated with GMV and with WMV. HO-1 was positively correlated with GMV. IRE1 was negatively correlated with GMV and WMV.
Conclusion
Our study demonstrates that subjects with AD have lower circulating levels of HO-1 than subjects with MCI and the plasma HO-1 levels were positively associated with the global GMV. This also shows that subjects with AD have lower circulating levels of CyPA than cognitively normal control and the plasma CyPA levels were positively associated with the GMV whereas subjects with AD have higher circulating levels of IRE1 than subjects with MCI and normal control. The plasma IRE1 value was negatively correlated with the global GMV among all subjects. Considering the potential roles of each enzyme in pathogenesis of AD, the plasma circulating levels of these enzymes possibly reflect the pathological changes of the brain in AD and would be candidates for blood-based biomarkers.Acknowledgements
The research was supported by the grant of the Korean Health Technology R & D Project, Ministry for Health, Welfare & Family Affairs (No. A092125, GHJ), the grant of the Korean Health Technology R&D Project, Ministry of Health & Welfare (No. HI11C1238, GHJ), and the National Research Foundation of Korea (NRF) grants funded by the Korean government (MEST) (No. 2020R1A2C1004749, GHJ; No. 2018M3A9E8078808, CWR), Republic of Korea.References
1)Smith, M.A., et al., 1994. Am J Pathol 145, 42-47.
2)Nigro, P., et. Al. 2013. Cell Death Dis 4, e888.
3)Cohen, N., et al. 2017. J Cell Sci 130, 3222-3233.
Figures
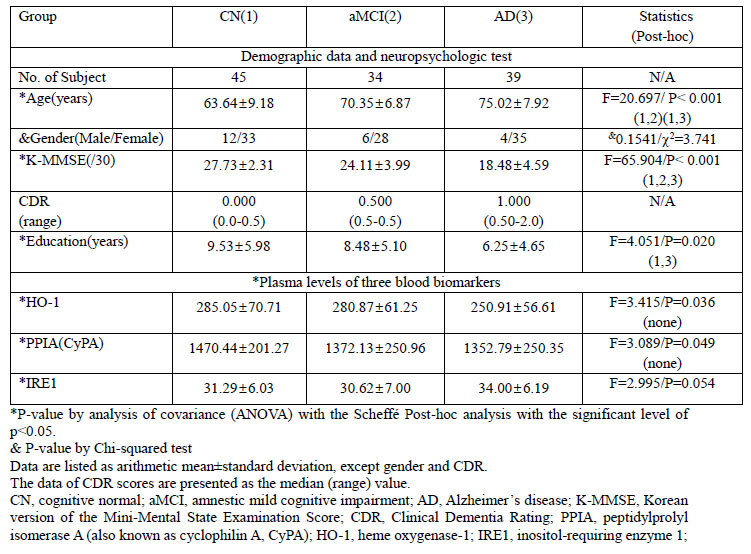
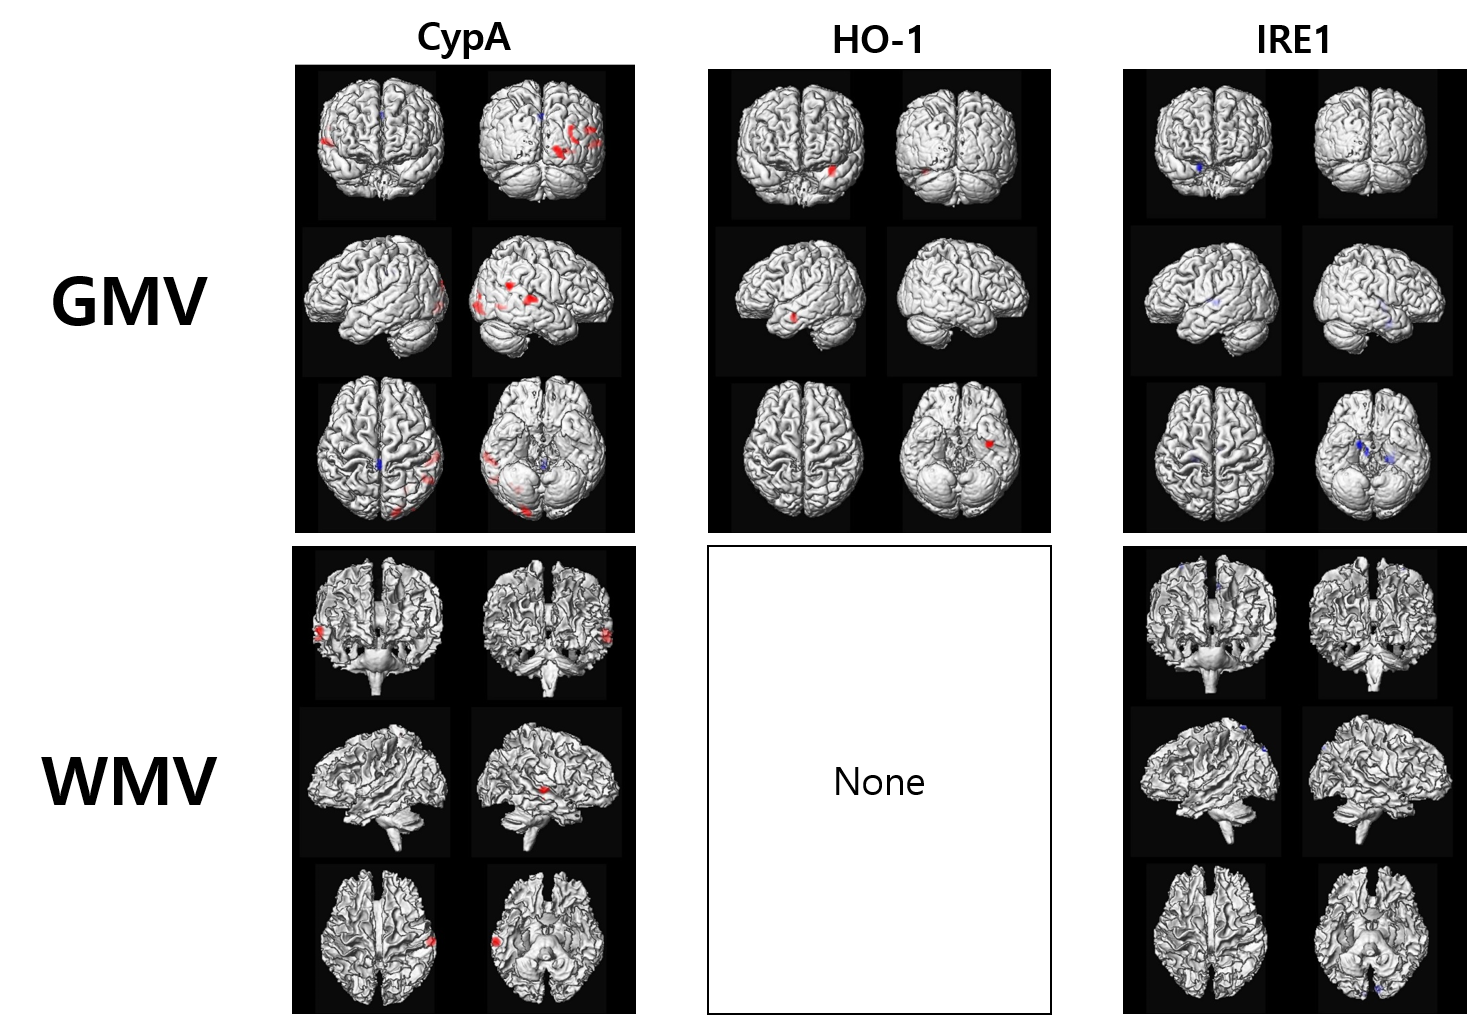
Figure 1. Results of the voxel-based multiple regression analyses between brain tissue volumes and the levels of the three blood biomarkers
GMV, gray matter volume; WMV, white matter volume; PPIA, peptidylprolyl isomerase A (PPIA, known as cyclophilin A, CyPA); HO-1, heme oxygenase-1; IRE1, and inositol-requiring enzyme 1
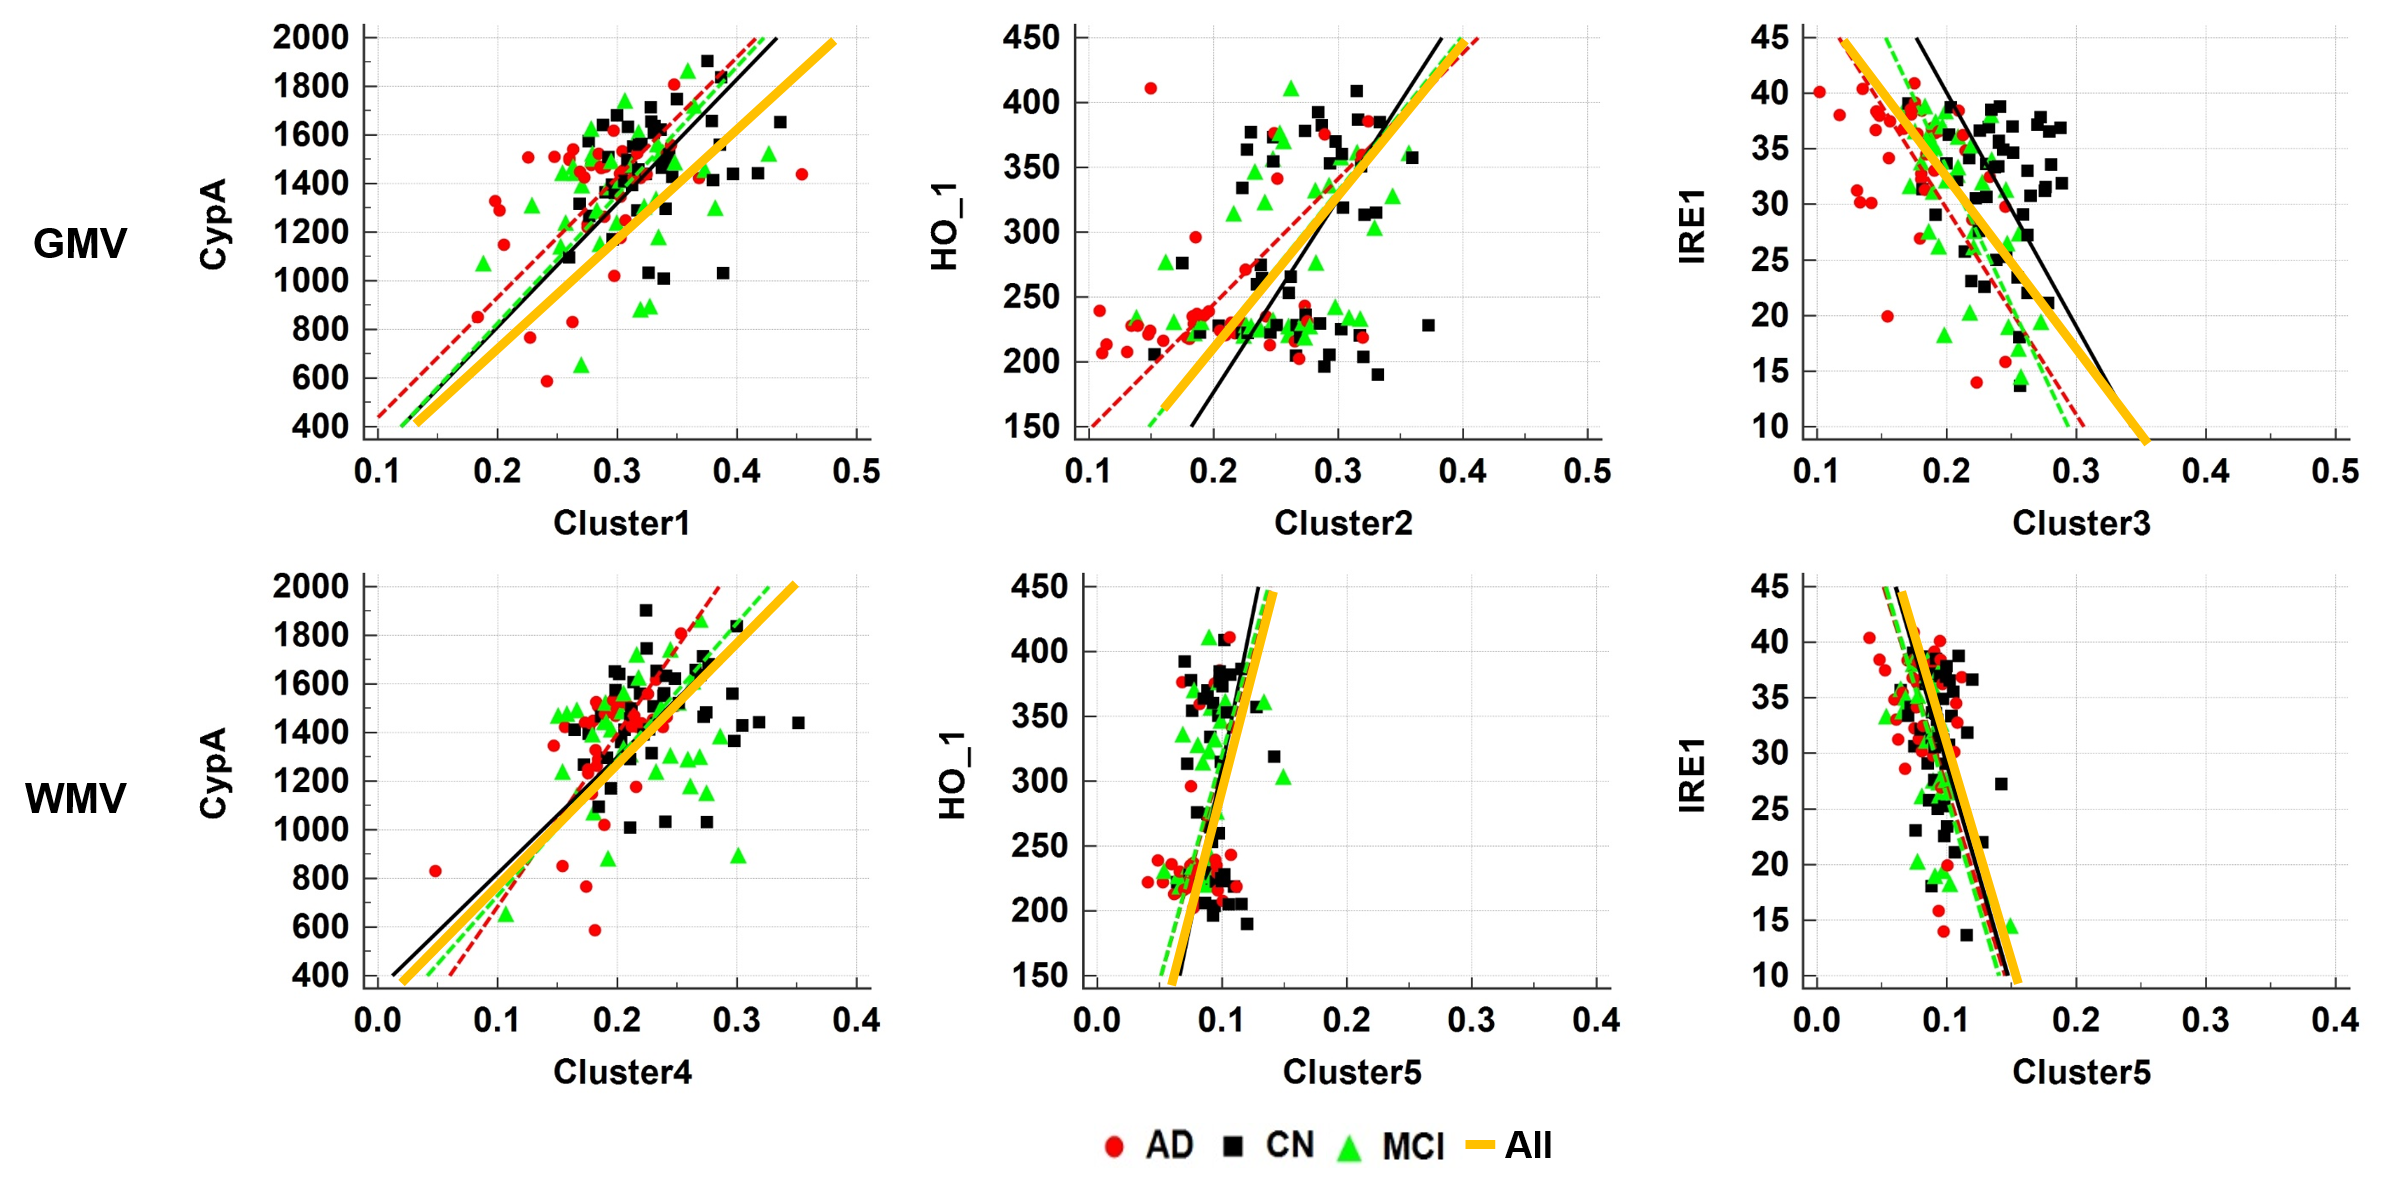
Figure 2. Results of ROI-based correlation analyses between brain tissue volumes and the levels of the three plasma biomarkers
PPIA, peptidylprolyl isomerase A (PPIA, known as cyclophilin A, CyPA); HO-1, heme oxygenase-1; IRE1, and inositol-requiring enzyme 1