1908
Myelin Water Fraction Imaging in Patients with Alzheimer's Disease and Mild Cognitive Impairment1Radiology, Kyung Hee University Hospital at Gangdong, Seoul, Korea, Republic of, 2Medicine, Kyung Hee University, Seoul, Korea, Republic of, 3Biomedical Engineering, Kyung Hee University, Yongin-si, Korea, Republic of, 4Neurology, Kyung Hee University Hospital at Gangdong, Seoul, Korea, Republic of, 5Electrical and Computer Engineering, Seoul National University, Seoul, Korea, Republic of
Synopsis
The objective of this study was to investigate myelin loss in participants with AD, MCI, and cognitively normal (CN) elderly using the whole brain MWF map. The ViSTa-GRASE sequence provides the good MWF map in a reasonable scan time to evaluate myelin loss in AD patients. MWF was significantly reduced in AD compared with CN, indicating the presence of widespread demyelination in AD. In addition, MWF was significantly correlated with memory decline, indicating that MWF could serve as a potential imaging biomarker for AD for evaluating demyelination and predicting treatment outcomes.
Background
Myelin pathology contribute to the cognitive decline characteristic of AD [1,2]. Myelin loss has been observed consistently in AD and the later-myelinated areas are also most vulnerable [3,4]. The development of an imaging biomarker for myelin loss has important clinical implications for the diagnosis and prognosis of diseases. Previous studies were investigated in the association between AD pathology and myelin water fraction measured by T2 relaxation rates using the mcDESPOT sequence acquired approximately 8 minutes [5,6] and using the multi-echo spin-echo sequence [7]. To improve signal-to-noise ratio (SNR) and reduce a scan time, the T1-based method called as visualization of short transverse relaxation time component (ViSTa) was introduced [8,9,10].Purpose
Since some studies were reported myelin changes in AD patient, it should be important to develop an imaging technique to map myelin changes in the brain within a reasonable imaging time in clinics, especially in AD patients who limits the MRI scan due to motion. Therefore, the primary objective of this study was to investigate myelin loss in participants with AD, MCI, and cognitively normal (CN) elderly using the whole brain MWF map. For this, we developed the ViSTa-GraSE sequence which can be imaged a whole brain data within three minutes. In addition, the secondary objective of this study was to investigate the clinical relevance of MWF by assessing the relationship between reduction of myelin water and memory decline or age. Voxel-based and regions-of-interest (ROI)-based comparisons of MWF maps were performed.Methods
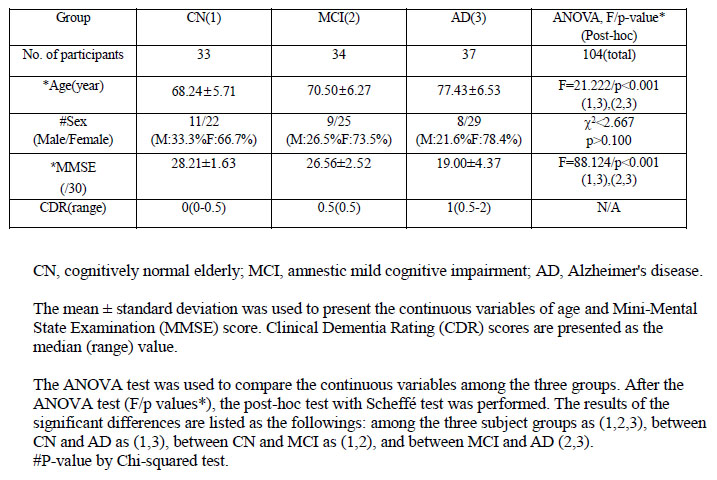
Participants: The institutional review board approved this cross-sectional prospective study. Table 1 summarizes the demographic characteristics and results of the neuropsychological tests.MRI acquisition: For calculating the myelin water fraction imaging, two whole brain images were acquired using a three-dimensional (3D) gradient and spin-echo (GraSE) sequence (Zhu et al., 2010) with and without inversion recovery preparation with a 32-channel sensitivity-encoding (SENSE) array coil. In the ViSTa-GraSE sequence, we acquired one-echo image, which is different to other myelin water imaging methods. The scan time was 2 min 35 sec. The GraSE sequence was run again with the same imaging parameters, except without using the inversion preparation pulse for using a reference image to quantify MWF in each voxel. The scan time was 28 sec.
Imaging processing: The post-processing steps were performed using a Statistical Parametric Mapping Version 12 (SPM12) program (Wellcome Department of Imaging Neuroscience, University College, London, UK). The MWF map for each voxel was created by the ViSTa-GraSE image divided by the reference image and multiplied by 100 percent*scaling factor. Finally, Gaussian smoothing was performed using the full-width at half maximum (FWHM) of 10×10×10 mm3 for voxel-based statistical analyses of all maps.
Statistical analyses:
Voxel-based analyses of MWF maps:
We performed two voxel-based analyses. First, the voxel-based full factorial ANCOVA test was used for group comparisons of MWF maps. Subject's total intracranial volume (TIV), age, and sex were used as covariates. Second, the voxel-based multiple regression analysis was performed to evaluate the relation between MWF maps and ages as well as MMSE scores.
Region-of-interest (ROI)-based analyses of MWF values:
The atlas-based ROIs were defined at the corpus callosum, anterior, middle, and posterior cingulum, hippocampus, parahippocampal gyrus, pons, thalamus, and cingulate gyrus based on the voxel-based analyses and the locations affected in AD patients. We performed an ANOVA test for group comparison and the Pearson correlation coefficient test for evaluating the degrees of association between ROI values and ages or MMSE scores. Finally, a receiver operating characteristic (ROC) curve analysis was used to evaluate the differentiation between the two groups for each ROI value, including MWF, GMV, and WMV.
Results
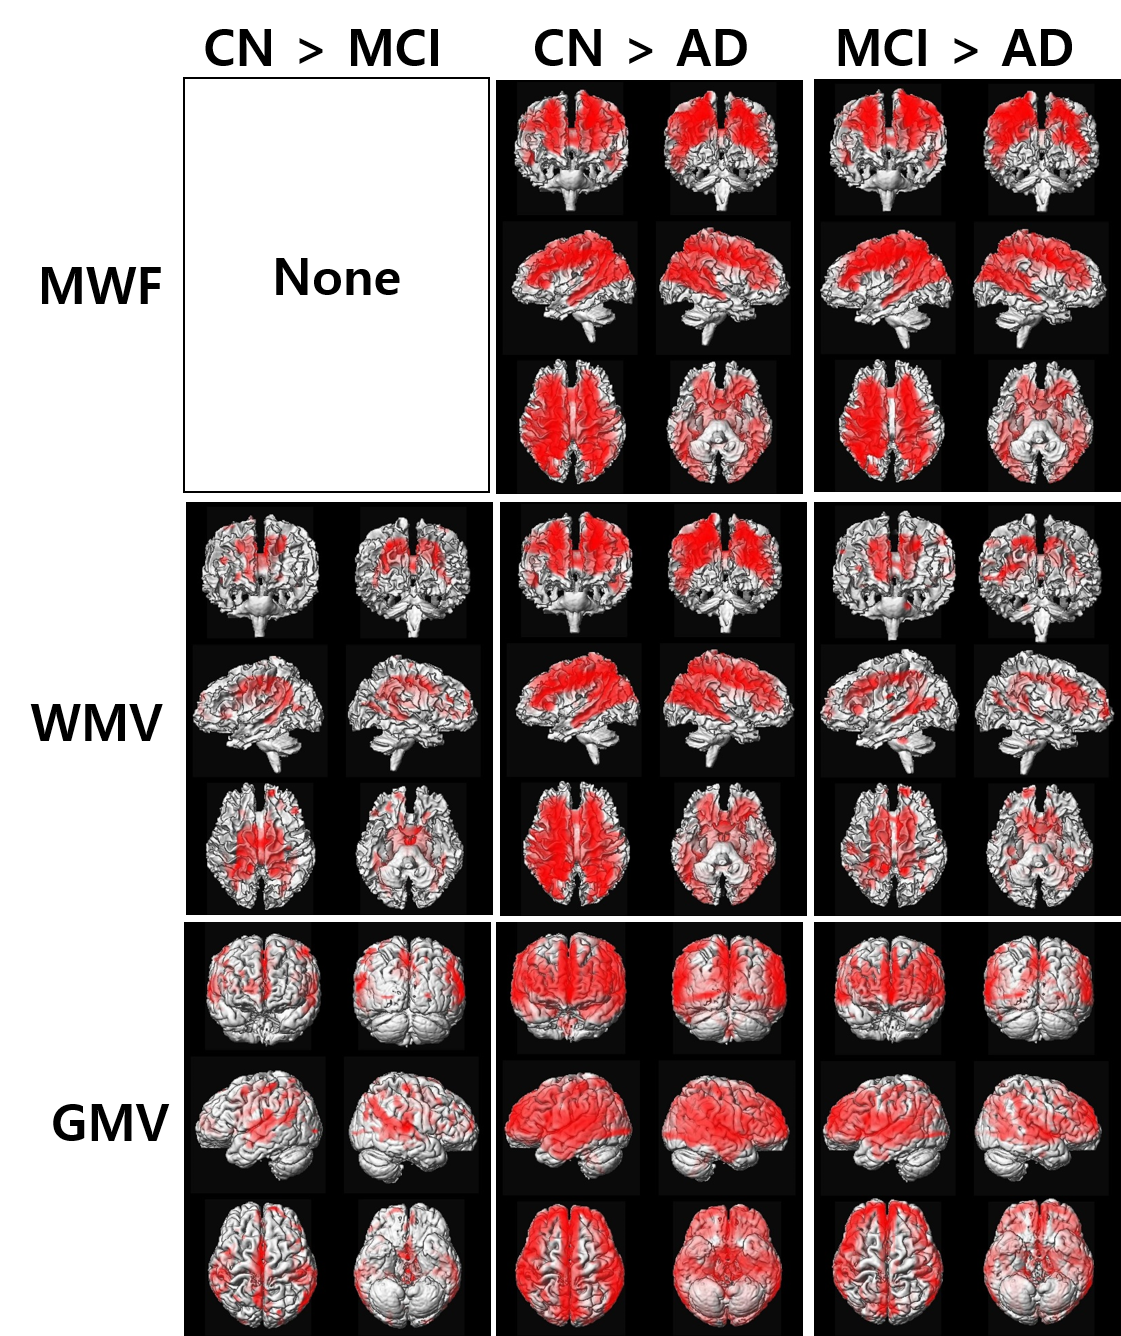
Results of voxel-based analyses of MWF maps:Figure 1 shows results of voxel-based ANCOVA analysis of maps of MWF, GMV, and WMV among the three participant groups. MWF was reduced in AD compared with CN and MCI at the cingulate gyrus, the temporal lobe, and the parietal lobe. MWF was decreased with increasing ages at the lateral ventricle areas. However, we did not find any association between MWF and MMSE scores.
Results of ROI-based analyses of MWF maps:
MWF values at all ROIs were significantly different among the three participant groups (F>4, p<0.009). MWF values at all ROIs were significantly negatively correlated with ages. MWF values at all ROIs were significantly positively correlated with MMSE scores. The participant groups between CN and AD and between MCI and AD were significantly differentiated by MWF values at all ROIs. Using MWF, for the classification between CN and AD groups, the largest AUC value was 0.927 with SE=87 and SP=83 at the lateral ventricle and the second largest AUC value was 0.898 with SE=81 and SP=89 at the corpus callosum.
Conclusion
The ViSTa-GRASE sequence provides the good MWF map in a reasonable scan time to evaluate myelin loss in AD patients. MWF was significantly reduced in AD compared with CN, indicating the presence of widespread demyelination in AD. In addition, MWF was significantly correlated with memory decline, indicating that MWF could serve as a potential imaging biomarker for AD for evaluating demyelination and predicting treatment outcomes. The differentiation AD from CN was very high, indicating its potential for clinical use.Acknowledgements
The research was supported by the National Research Foundation of Korea (NRF) grant funded by Ministry of Science and ICT (No. 2020R1A2C1004749, GHJ), Republic of Korea.References
1] Braak H, et al (2000). Ann NY Acad Sci 924:53–61;
2] Burns JM, et al (2005). Arch Neurol 62:1870–1876
3] Benitez A, et al (2014). NeuroImage Clinical 4:64–71.
4] Gao J, et al (2011). Journal of Alzheimer’s disease : JAD 26:47–58.
5] Douglas C. Dean III, et al (2017). JAMA Neurol.74(1):41-49.
6] Mustapha Bouhrara et al (2018). Alzheimer’s & Dementia 14:998-1004.
7] Eleftherios Kavroulakis, et al (2018). J MAGN RESON IMAGING 47:1359–1372.
8] Se-Hong Oh, et al (2013). NeuroImage 83:485–492.
9] Daeun Kim, et al (2015). Magn Reson Med 74:499–505.
10] Zhe Wu, et al (2018). Magn. Reson. Med. 80:1061–1073.
Figures