1906
MIITRA atlas: Development and evaluation of high-resolution gray matter labels1Biomedical Engineering, Illinois Institute of Technology, Chicago, IL, United States, 2Rush Alzheimer's Disease Center, Rush University Medical Center, Chicago, IL, United States
Synopsis
The Multichannel Illinois Institute of Technology & Rush university Aging (MIITRA) atlas contains high resolution (0.5mm) T1-weighted (T1w) and diffusion tensor imaging (DTI) templates, constructed using high quality MRI data on a large (N=400), diverse, community cohort of non-demented older adults. The purpose of this work was twofold: a) to construct high resolution gray matter labels for the MIITRA atlas based on manually edited gray matter labels of the older adults included in the atlas, and b) to evaluate the performance of the new labels in labeling the gray matter of a separate group of older adults.
INTRODUCTION
The Multichannel Illinois Institute of Technology & Rush university Aging (MIITRA) atlas1 contains high resolution (0.5mm) T1-weighted (T1w) and diffusion tensor imaging (DTI) templates, constructed using high quality MRI data on a large (N=400), diverse, community cohort of non-demented older adults. The purpose of this work was twofold: a) to construct high resolution gray matter labels for the MIITRA atlas based on manually edited gray matter labels of the older adults included in the atlas, and b) to evaluate the performance of the new labels in labeling the gray matter of a separate group of older adults.METHODS
Data and processing:T1w images (1mm isotropic resolution) from the older adults included in the MIITRA atlas (50% male; 64.9-98.9 years of age; 54% white, 43% black) were processed with Freesurfer’s standard recon-all pipeline2,3, which segmented subcortical4 and cortical gray matter into 84 regions according to the Desikan Killiany atlas5,6. The Freesurfer output for all images was manually edited. The same approach was followed for a separate group of 100 older adults participating in the same studies of aging as the persons included in MIITRA (1mm isotropic resolution, age-range 65-95, male-female ratio 40:60). This latter group was used in the evaluation of the MIITRA labels.
Construction of gray matter labels:
A recently introduced template building technique based on principles of super-resolution7 was modified and used to construct the high-resolution gray matter labels of the MIITRA atlas. The procedure consisted of the following steps:
Step 1: The ANTs8,9-derived transformations applied on individual T1w images to build the MIITRA T1w template were used to map the corresponding gray matter labels from raw space to exact physical locations in the final MIITRA space.
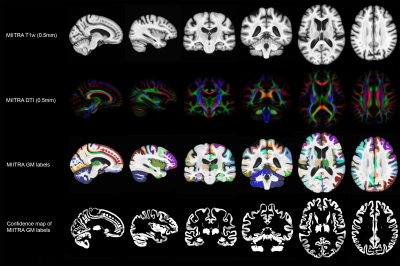
Step 2: The label in a 0.5mm isotropic voxel in MIITRA space was calculated using majority voting among all the labels that were mapped to that voxel. Applying this technique to every gray matter voxel produced the gray matter labels of the MIITRA atlas (Fig.1). The confidence for the final label in each voxel was calculated as the percent of votes for the winning label.
Evaluation:
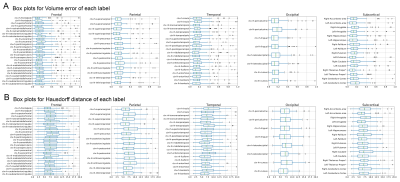
T1w images from the 100 older adults of the evaluation group were nonlinearly normalized to the 0.5mm MIITRA T1w template using ANTs8,9. The gray matter labels of the MIITRA atlas were warped to each individual’s space using the corresponding inverse transformations. For each individual, the warped gray matter labels from the MIITRA atlas were compared to the Freesurfer (reference) labels of that individual. The comparison was conducted within an individual’s gray matter mask. First, the overlap between warped and reference labels was evaluated using the Dice coefficient, Jaccard coefficient, sensitivity, and specificity. Next, the geometry of the labels was compared using the average volume and average surface area of each label. Then the label dissimilarity was assessed using the volume error and Hausdorff distance. All measures were calculated using SimpleITK10,11.
RESULTS
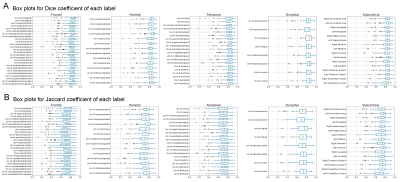
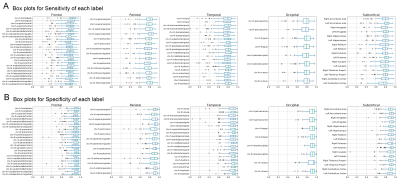
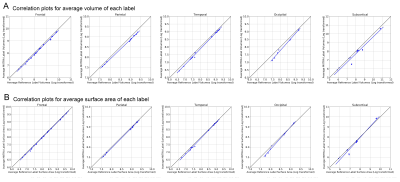
Examples of the MIITRA gray matter labels and corresponding confidence maps are shown in Figure 1. The measures of overlap between the warped and reference labels were generally high, with an average Dice coefficient of 0.82±0.10, average Jaccard coefficient of 0.70±0.13 (Fig.2), sensitivity of 0.77±0.13, and specificity of 0.89±0.09 (Fig.3). The geometry of the warped labels showed a high correlation with the geometry of the reference labels both in terms of the average volume of each label (correlation coefficient = 0.997, p-value < 10-10) and in terms of the average surface area of each label (correlation coefficient = 0.988, p-value < 10-10) (Fig.4). The values of dissimilarity between the warped and reference labels were low, with an average volume error of 0.18±0.18 and an average Hausdorff distance of 8.69±8.78.DISCUSSION
High-resolution gray matter labels were constructed for the MIITRA atlas in this work. When used for regional segmentation of the gray matter of older adults, the gray matter labels of the MIITRA atlas showed high overlap, high geometric correlation, and low dissimilarity with the manually edited reference labels, demonstrating that there is a high agreement between the labels obtained from the MIITRA atlas and the manually edited Freesurfer labels.CONCLUSION
This work developed high-resolution gray matter labels for the MIITRA atlas. The new labels, in combination with the high-resolution T1w template of the atlas, allow segmentation of the gray matter of older adults that is in good agreement with the manually-edited Freesurfer-based segmentationAcknowledgements
National Institute on Aging (NIA) R01AG052200
National Institute on Aging (NIA) P30AG010161
National Institute on Aging (NIA) R01AG017917
National Institute on Aging (NIA) RF1AG022018
National Institute on Aging (NIA) R01AG056405
References
1. Ridwan AR, Niaz MR, Wu Y, et al. Development and evaluation of a high performance T1-weighted brain template for use in studies on older adults. Human Brain Mapping. 2021(in press).
2. Dale AM, Fischl B, Sereno MI. Cortical surface-based analysis. I. Segmentation and surface reconstruction. Neuroimage. 1999 Feb;9(2):179-94.
3. Fischl B, Sereno MI, Dale AM. Cortical surface-based analysis. II: Inflation, flattening, and a surface-based coordinate system. Neuroimage. 1999 Feb;9(2):195-207.
4. Fischl B, Salat DH, Busa E, et al. Whole brain segmentation: automated labeling of neuroanatomical structures in the human brain. Neuron. 2002 Jan 31;33(3):341-55.
5. Desikan RS, Ségonne F, Fischl B, et al. An automated labeling system for subdividing the human cerebral cortex on MRI scans into gyral based regions of interest. Neuroimage. 2006 Jul 1;31(3):968-80.
6. Fischl B, van der Kouwe A, Destrieux C, et al. Automatically parcellating the human cerebral cortex. Cereb Cortex. 2004 Jan;14(1):11-22.
7. Niaz MR, Ridwan AR, Qi X, et al. Development and evaluation of a 0.5mm isotropic resolution structural template of the older adult brain. Proc. Int. Soc. for Magn. Reson. In Med. 2019
8. Avants BB, Tustison NJ, Song G, et al. A reproducible evaluation of ANTs similarity metric performance in brain image registration. Neuroimage. 2011 Feb 1;54(3):2033-44.
9. Avants BB, Yushkevich P, Pluta J, et al. The optimal template effect in hippocampus studies of diseased populations. Neuroimage. 2010 Feb 1;49(3):2457-66.
10. Lowekamp BC, Chen DT, Ibáñez L, et al. The Design of SimpleITK. Front Neuroinform. 2013 Dec 30;7:45.
11. Yaniv Z, Lowekamp BC, Johnson HJ, et al. SimpleITK Image-Analysis Notebooks: a Collaborative Environment for Education and Reproducible Research. J Digit Imaging. 2018 Jun;31(3):290-303.
Figures
