1905
Sexual dimorphism in Alzheimer’s disease evaluated by free-water DTI and voxel-based morphometry1Neuroimaging Research, Barrow Neurological Institute, Phoenix, AZ, United States, 2School of Life Sciences, Arizona State University, Tempe, AZ, United States, 3Muhammad Ali Parkinson Center at Barrow Neurological Institute, Phoenix, AZ, United States
Synopsis
The objective of this study was to investigate differences in white matter (WM) integrity and grey matter (GM) volumes between males and females in healthy aging and Alzheimer’s Disease using free-water diffusion tensor imaging (FW-DTI) and voxel-based morphometry (VBM) analyses, respectively.
Introduction
Alzheimer's disease (AD) is a neurodegenerative disorder and the most common cause of dementia worldwide1. Diffusion tensor imaging (DTI) and voxel-based morphometry (VBM) are two powerful MRI methods used to assess white matter (WM) integrity and grey matter (GM) volume, respectively. Previous studies have observed sex differences using MRI in healthy elderly2 and in mild cognitive impairment (MCI)3 populations. Today, it is well recognized that standard DTI is susceptible to the effects of extracellular free-water (FW), the effects of which may be further exacerbated in neurodegenerative diseases; therefore, in this study, we evaluated sex differences in AD using free-water diffusion tensor imaging (FW-DTI) and VBM analyses.Methods
MRI data were downloaded from the OASIS-3 database (http://oasis-brains.org/). This study included 158 healthy controls (HC, 86 females and 72 males with a mean age (S.D.) of 71 (8) and 70 (7) years, respectively) and 46 AD (24 females and 22 males with a mean age (S.D.) of 73 (7) and 74 (6) years, respectively). All subjects completed the Mini-Mental State Exam (MMSE)4. Diffusion MRI acquisition included 65 diffusion-encoding directions and two b-values: b=0 (one volume) and b=1000 s/mm². T1-w MPRAGE images were used for VBM analysis by FSL-VBM5. All GM images were non-linearly registered to a study-specific GM template in 2×2×2 mm3 standard space and smoothed using a sigma value of 3 mm. DTI pre-processing was performed by Mrtrix36, FSL7, and ANTs (http://stnava.github.io/ANTs/) and included denoising, eddy current, motion, and bias field corrections. FW-DTI metrics were computed using an in-house Matlab script for FW-DTI single-shell acquisition8. Fractional anisotropy (FA) and FW index were normalized to the MNI standard space and smoothed using a sigma value of 3 mm. For both analyses, a two-way ANCOVA model, with age as covariate, was run using R (http//www.R-project.org/) to calculate the partial-eta squared (p-η2) effect-size for main effects of group and sex and their interaction. Post-hoc comparisons, between sex and groups, were analyzed using Hedges’ g effect-size.Results
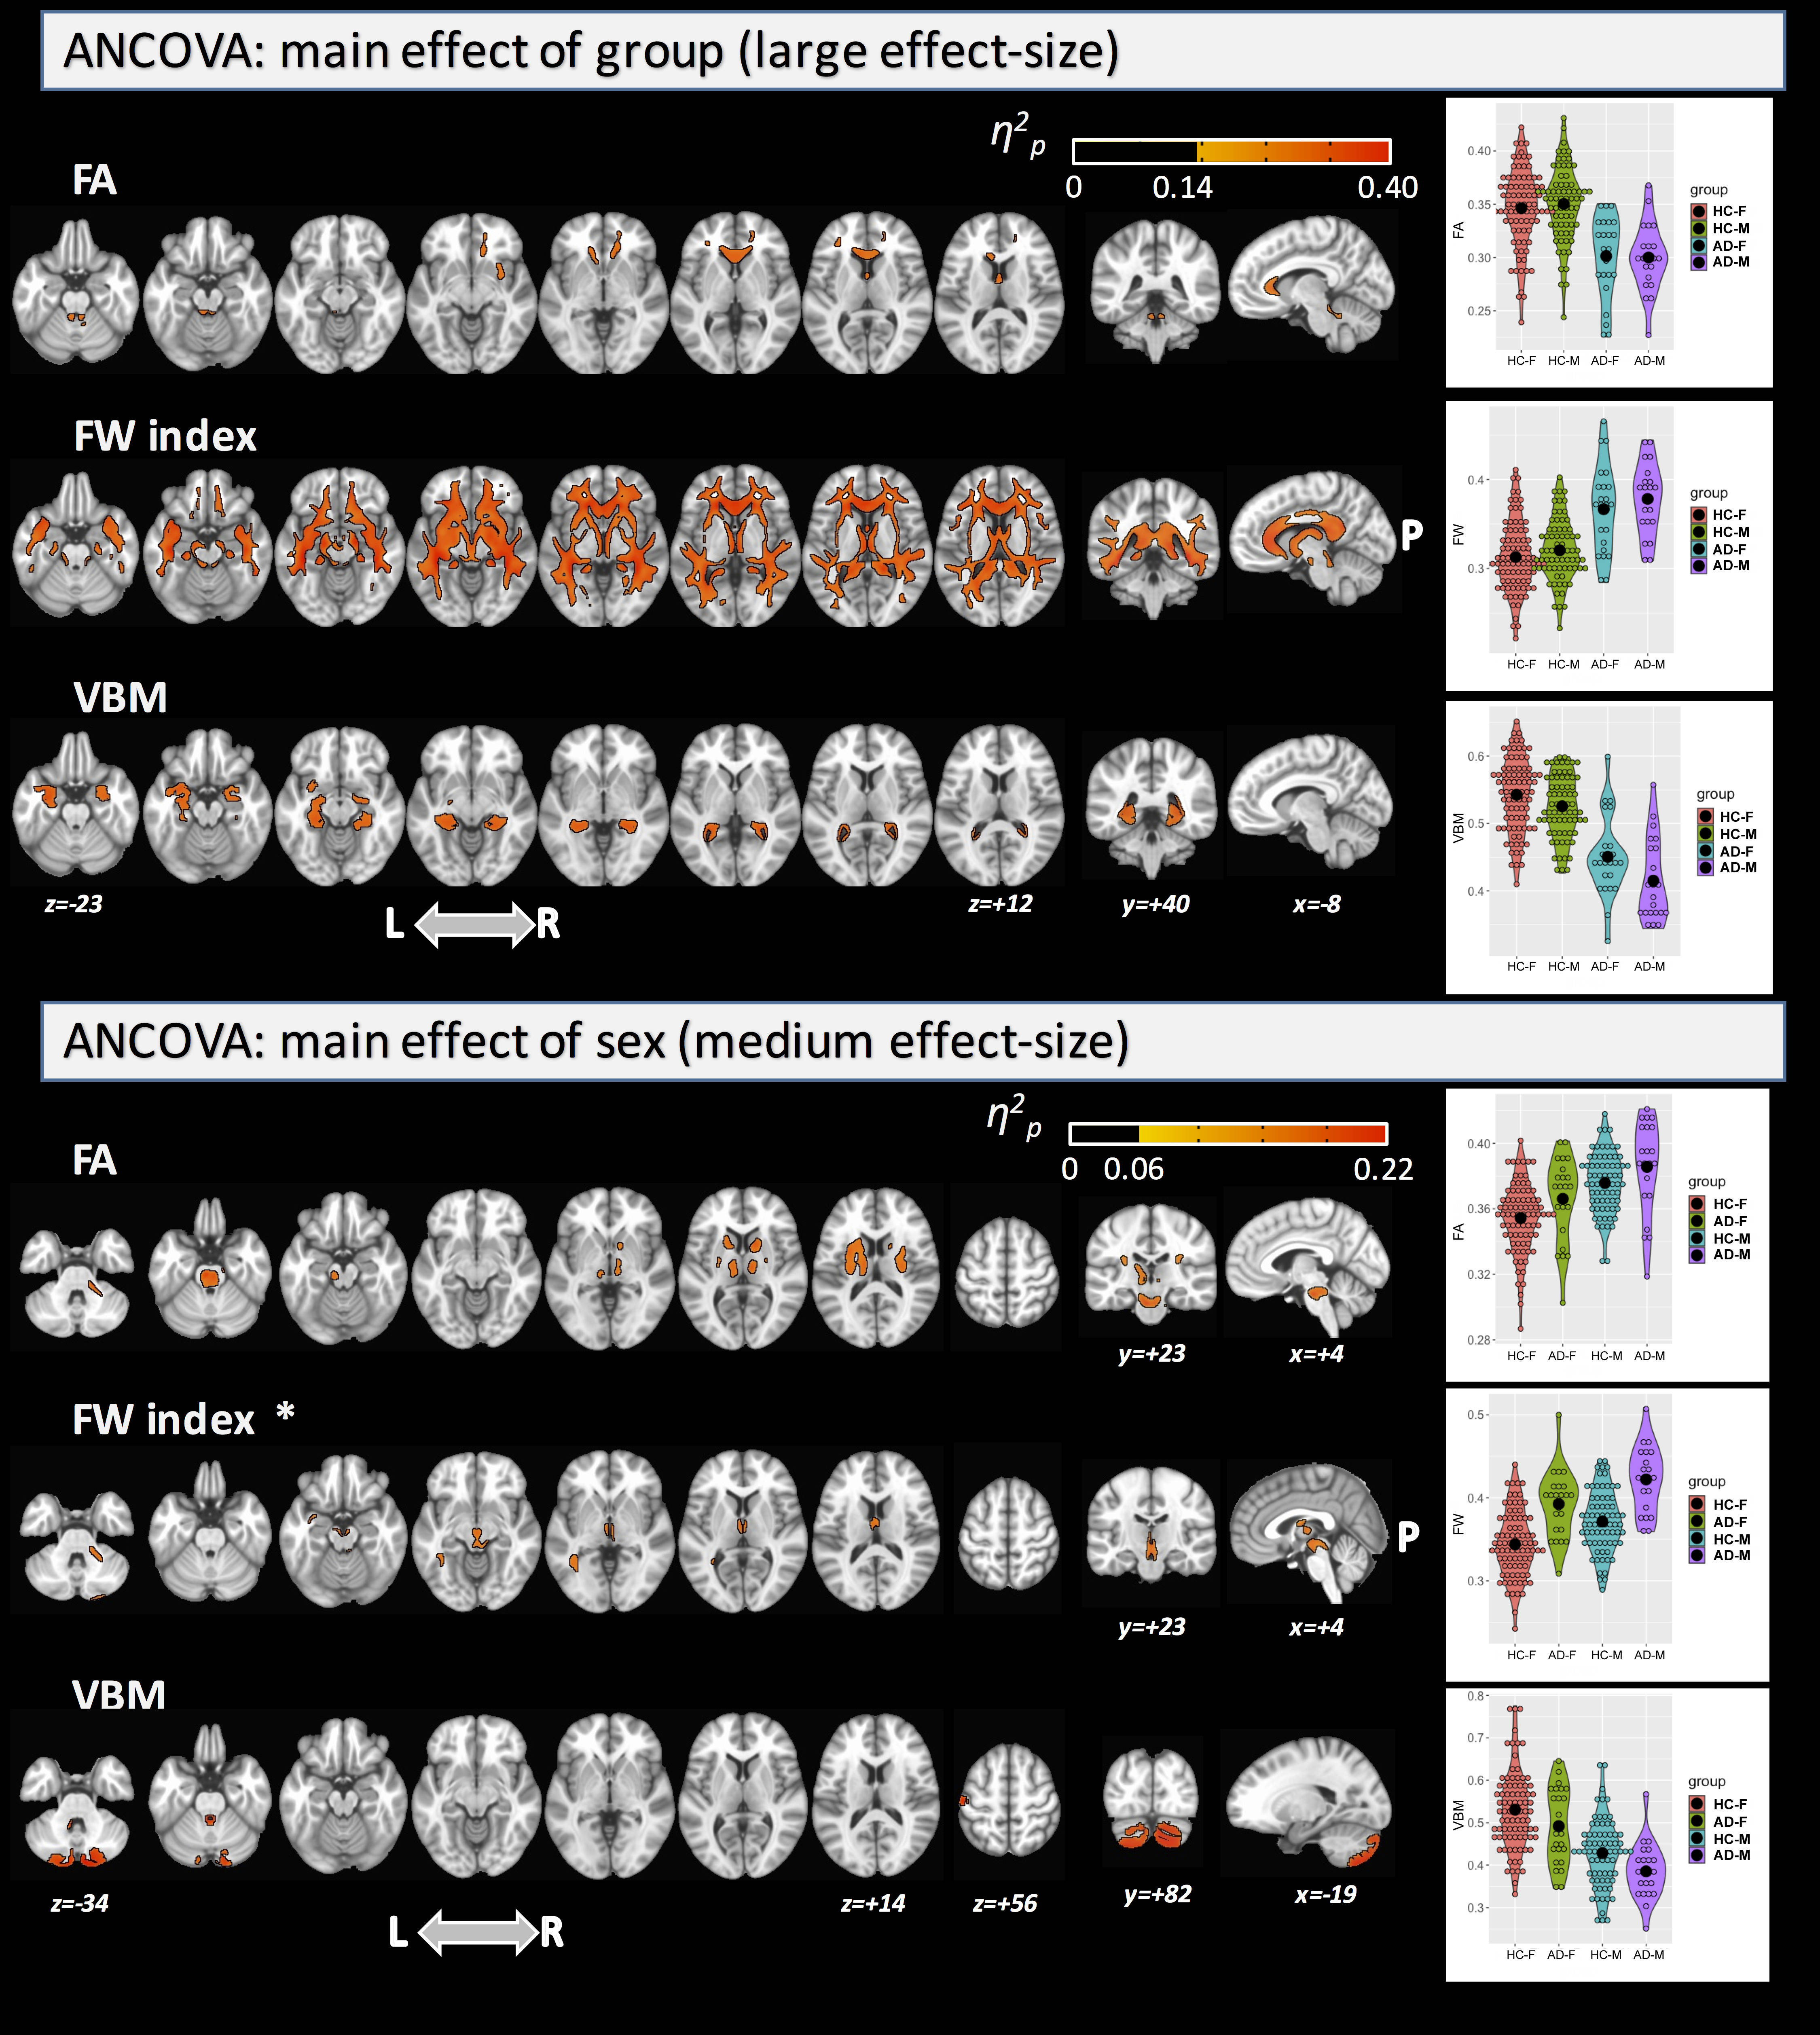
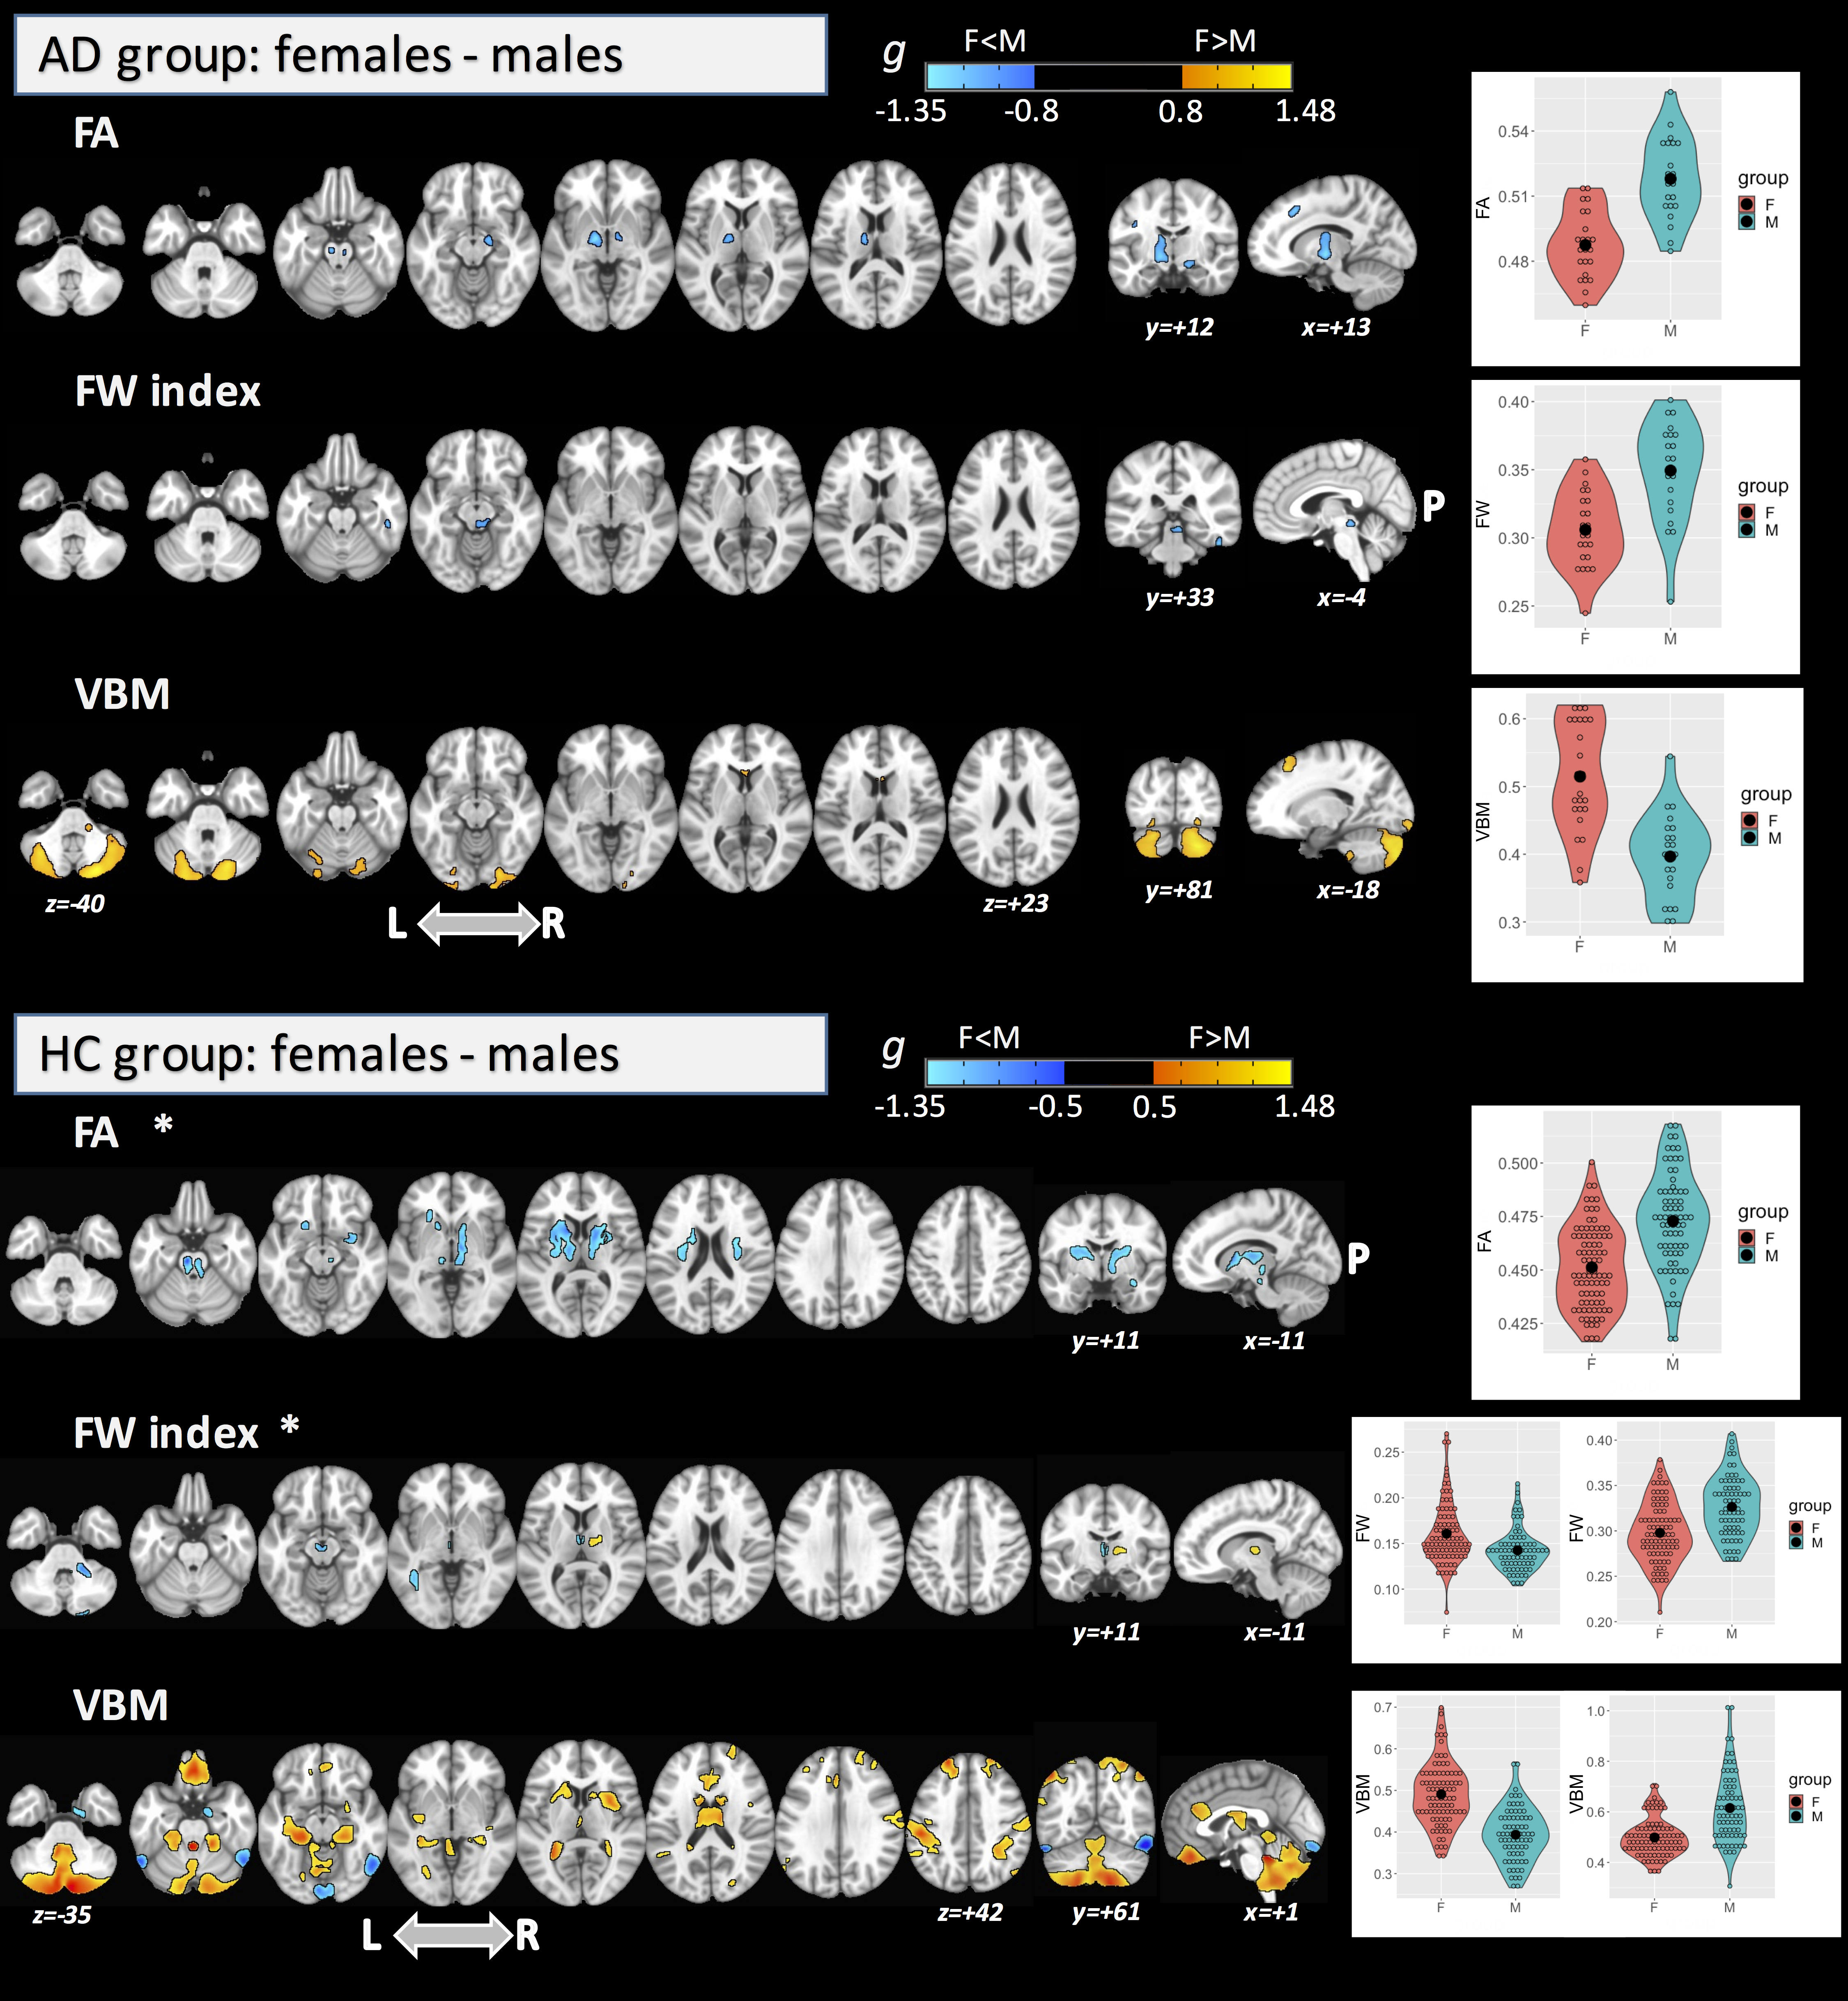
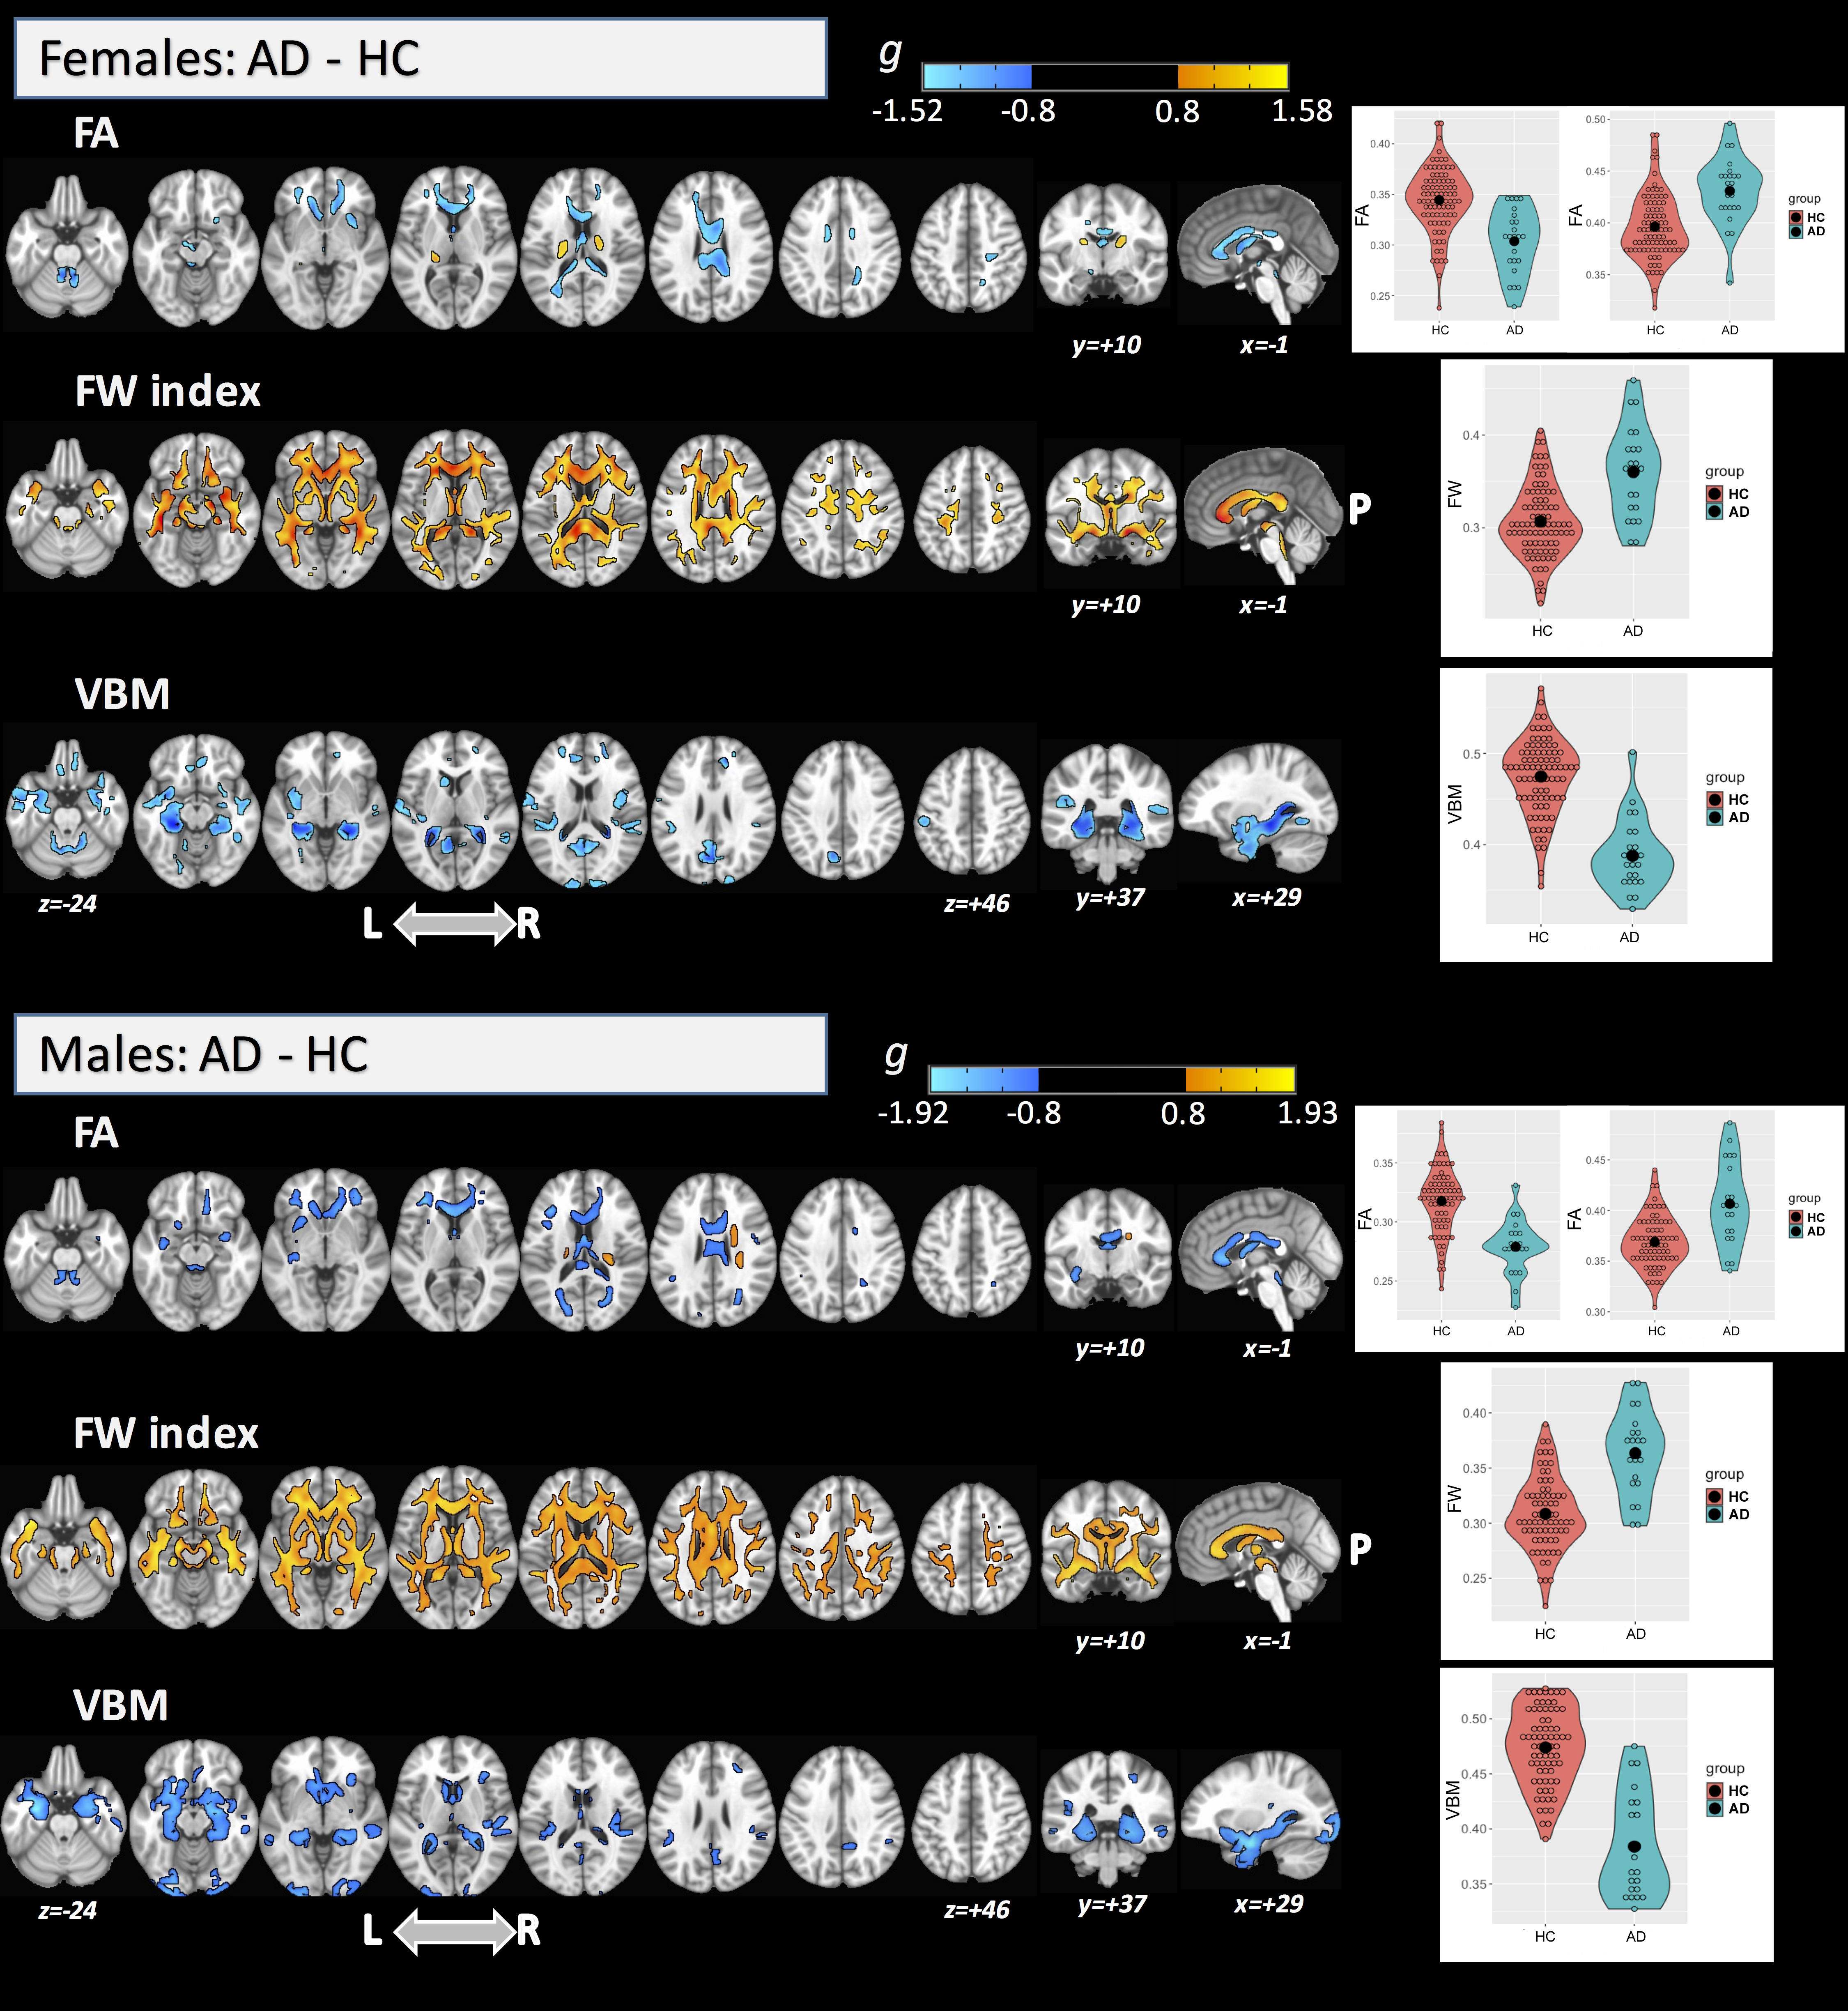
We divided the subjects into four groups: HC females, HC males, AD females, and AD males. The groups did not differ significantly in age (ANOVA: df=3, F=1.49, p=0.218) but did differ in MMSE score (Krustal-Wallis rank-sum test: df=3, χ2=49.2, p<0.0001) between AD and HC groups as expected. For the main effect of group (large effect-size; p-η2>0.14), significant differences across the groups were found for FA in the corpus callosum (CC), fornix, and superior cerebellar peduncle (SCP). Significant clusters were found in several WM areas for FW index, and in the hippocampus, amygdala, parahippocampal gyrus, and temporal fusiform cortex for VBM. For the main effect of sex, we found significant differences with a large effect-size only for FA (including in the anterior thalamic radiation; ATR, pontine crossing tract; PCT, and anterior/posterior limb of internal capsule; IC) and for VBM (mainly in the cerebellum) (see Figure 1). No significant differences were found for the interaction term. Interestingly, the post-hoc comparison for FA and FW metrics (Figure 2) found significant differences between females and males (with large effect-size (g>0.80)) only in the AD group. By FA and VBM, large differences between sexes in the AD group were found in the PCT, cerebral peduncle, posterior limb of IC, and cerebellum. In the AD group, males were found to have higher FA, higher FW index, and lower GM volumes than females. Figure 3 shows the post-hoc analysis between AD and HC for both females and males at a large effect-size level.Discussion
This study demonstrates that differences exist in WM integrity and GM volumes between males and females in AD. Sexual dimorphism has previously been observed using standard DTI in healthy participants in the CC and cingulum9,10,11,12. Previously, Cheng et al. also demonstrated, by VBM, that females had significantly larger GM volume in the pars opercularis and inferior parietal lobule than males13, while O’Dwyer et al. studied sexual dimorphism in MCI by standard DTI3. However, it is important to emphasize that sexual dimorphism in AD may not recapitulate the findings in HCs and that there are no published studies that analyzed differences between males and females in AD by combining FW-DTI and VBM. Because standard DTI acquisition is susceptible to the effects of extracellular FW14, we leveraged an advanced FW-DTI model8 to overcome this limitation. Using this approach, we found a large effect-size for the main effects of group and sex; however, we did not find any significant difference for the interaction term. The most important result was the difference between males and females (with large effect-size) in AD regarding FA and FW metrics. Similar differences were also found in HC but only at a medium effect-size level.Conclusions
This study showed that sexual dimorphism exists in Alzheimer’s Disease beyond that seen in healthy brain aging in both white and grey matter. Furthermore, these differences are region-specific in AD including brain regions important in the development and symptomatology of AD. Lastly, these results argue that sex differences must be considered in the development of novel therapeutic strategies for the treatment of AD, as well as in consideration of brain imaging findings of AD cohorts.Acknowledgements
No acknowledgement found.References
1. Weller J. and A. Budson, Current understanding of Alzheimer's disease diagnosis and treatment. F1000Res, (2018). 7.
2. Murphy D.G., C. DeCarli, A.R. McIntosh, E. Daly, M.J. Mentis, P. Pietrini, et al., Sex differences in human brain morphometry and metabolism: an in vivo quantitative magnetic resonance imaging and positron emission tomography study on the effect of aging. Arch Gen Psychiatry, (1996). 53(7): 585-94.
3. O'Dwyer L., F. Lamberton, A.L. Bokde, M. Ewers, Y.O. Faluyi, C. Tanner, et al., Sexual dimorphism in healthy aging and mild cognitive impairment: a DTI study. PLoS One, (2012). 7(7): e37021.
4. Folstein M.F., S.E. Folstein and P.R. McHugh, "Mini-mental state". A practical method for grading the cognitive state of patients for the clinician. J Psychiatr Res, (1975). 12(3): 189-98.
5. Good C.D., I.S. Johnsrude, J. Ashburner, R.N. Henson, K.J. Friston and R.S. Frackowiak, A voxel-based morphometric study of ageing in 465 normal adult human brains. Neuroimage, (2001). 14(1 Pt 1): 21-36.
6. Tournier J.D., R. Smith, D. Raffelt, R. Tabbara, T. Dhollander, M. Pietsch, et al., MRtrix3: A fast, flexible and open software framework for medical image processing and visualisation. Neuroimage, (2019). 202: 116137.
7. Jenkinson M., C.F. Beckmann, T.E. Behrens, M.W. Woolrich and S.M. Smith, FSL. Neuroimage, (2012). 62(2): 782-90.
8. Pasternak O., N. Sochen, Y. Gur, N. Intrator and Y. Assaf, Free water elimination and mapping from diffusion MRI. Magn Reson Med, (2009). 62(3): 717-30.
9. Hsu J.L., A. Leemans, C.H. Bai, C.H. Lee, Y.F. Tsai, H.C. Chiu, et al., Gender differences and age-related white matter changes of the human brain: a diffusion tensor imaging study. Neuroimage, (2008). 39(2): 566-77.
10. Huster R.J., R. Westerhausen, F. Kreuder, E. Schweiger and W. Wittling, Hemispheric and gender related differences in the midcingulum bundle: a DTI study. Hum Brain Mapp, (2009). 30(2): 383-91.
11. Kanaan R.A., M. Allin, M. Picchioni, G.J. Barker, E. Daly, S.S. Shergill, et al., Gender differences in white matter microstructure. PLoS One, (2012). 7(6): e38272.
12. Menzler K., M. Belke, E. Wehrmann, K. Krakow, U. Lengler, A. Jansen, et al., Men and women are different: diffusion tensor imaging reveals sexual dimorphism in the microstructure of the thalamus, corpus callosum and cingulum. Neuroimage, (2011). 54(4): 2557-62.
13. Cheng Y., K.H. Chou, J. Decety, I.Y. Chen, D. Hung, O.J. Tzeng, et al., Sex differences in the neuroanatomy of human mirror-neuron system: a voxel-based morphometric investigation. Neuroscience, (2009). 158(2): 713-20.
14. Pierpaoli C., P. Jezzard, P.J. Basser, A. Barnett and G. Di Chiro, Diffusion tensor MR imaging of the human brain. Radiology, (1996). 201(3): 637-48.
Figures