1904
Maturation and degeneration of the human brainstem across the adult lifespan1NIA, Baltimore, MD, United States
Synopsis
Brainstem tissue microstructural properties change across the adult lifespan. However, investigations elucidating the biological processes that govern brainstem maturation and degeneration are lacking. Here, we implement a multi-parameter approach to characterize the sex- and age-differences in a large cognitively unimpaired adult cohort. Our findings demonstrate quadratic associations between MR metrics and age as well as sexual dimorphism in certain MR metrics. Finally, our results indicate that myelination follows a temporally symmetric time course across the adult lifespan, while axons appear to degenerate significantly more rapidly than they mature.
PURPOSE
White matter (WM) and gray matter (GM) are known to play crucial roles in neurodevelopment, normal aging, and neurodegeneration1-8. Although MRI-based studies have characterized these age-related differences in the cerebrum, comparative work in the brainstem has been limited, despite its central role in the regulation of vital functions and implications in normal aging and pathology9-13. Here, we implement a multi-parameter approach in a large sample of healthy adults over a wide age range to characterize the of biological mechanisms that may govern brainstem development and degeneration as well as to establish a time-course of myelination and axonal density in the human brainstem.METHODS
Subjects and MRIThe study cohort consisted of 140 subjects (53.4±21.4 years) with 78 men and 62 women spanning the age range between 22 and 94 years. Age was not statistically different between men and women. Each participant has undergone our BMC-mcDESPOT imaging protocol for myelin water fraction (MWF) mapping, and longitudinal and transverse relaxation rates (R1 and R2)14,15,26,27, and our DTI protocol for fractional anisotropy (FA), radial diffusivity (RD), mean diffusivity (MD), and axial diffusivity (AxD) mapping.
Image processing and statistical analysis
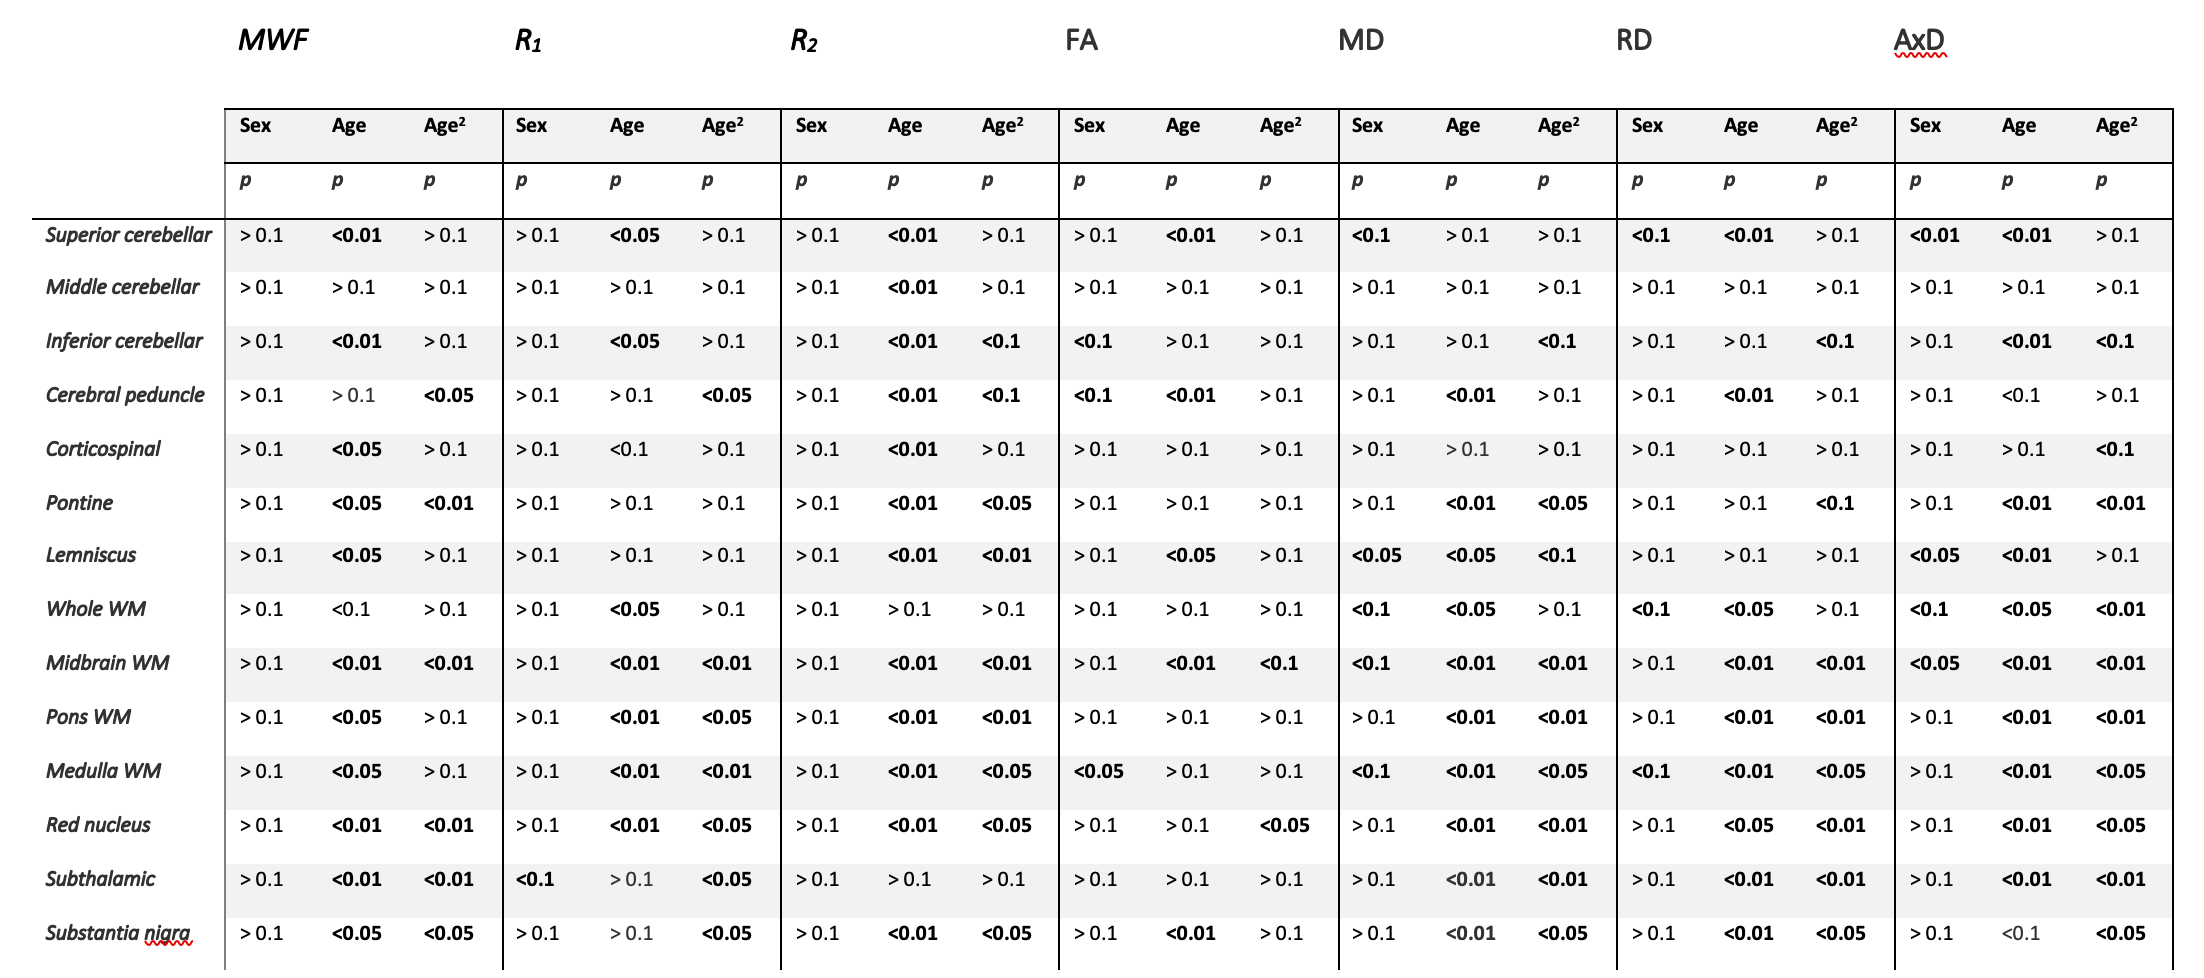
MWF, relaxation rates, and DTI indices were nonlinearly registered to MNI space using FSL. Fourteen brainstem structures were chosen as regions of interest (ROIs) from the JHU atlas18-19 and the Tailairach structural atlas (Table 1). Mean MWF, relaxation rates, and DTI indices were calculated for each ROI. The effects of age and sex for each modality were established using a linear regression model using mean MWF, relaxation rates, or the DTI index as the dependent variables and sex, age, and age2 as independent variables.
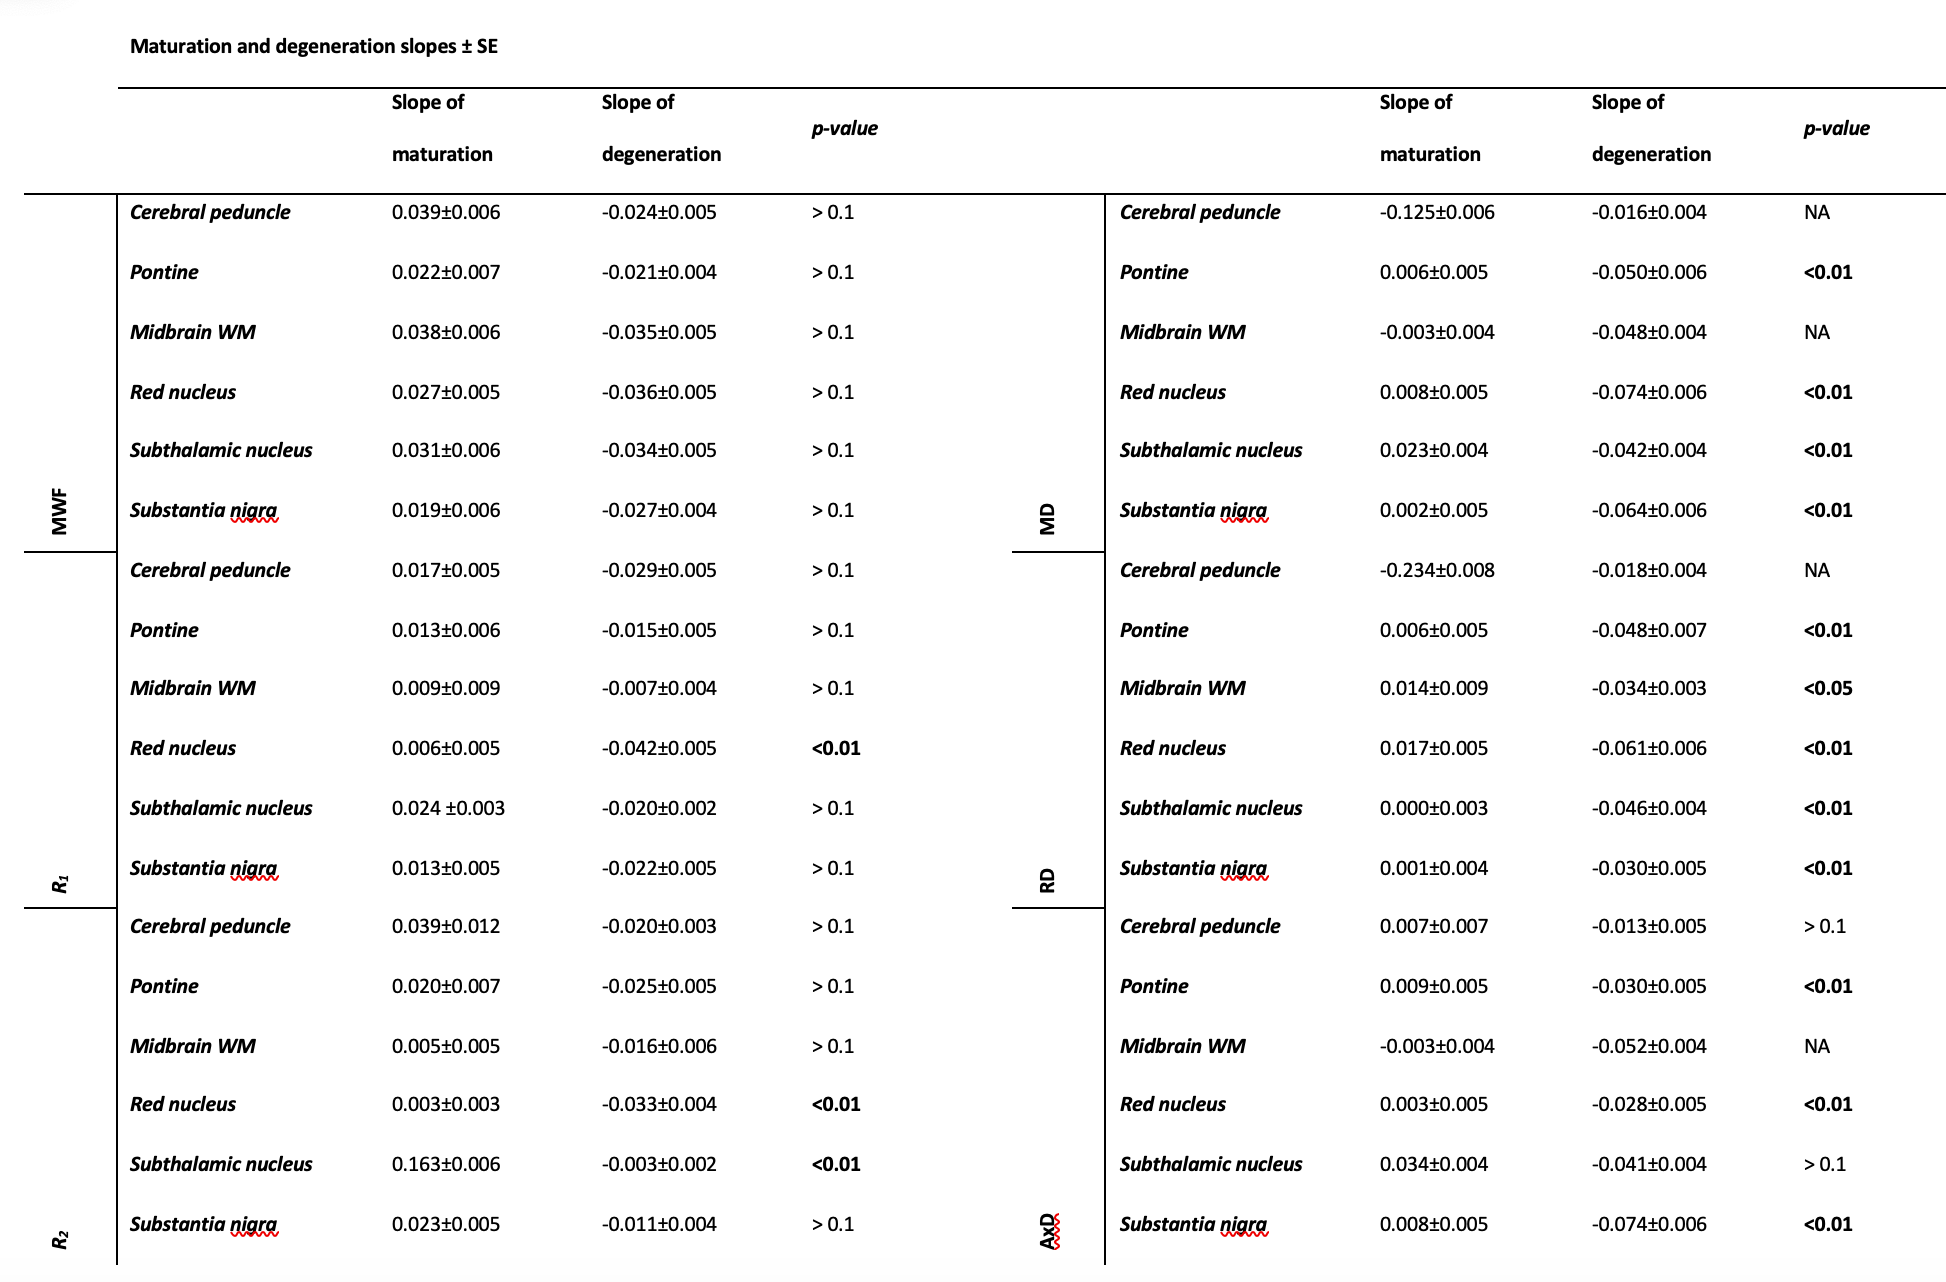
To further characterize the maturation and degeneration phases in the brainstem, we standardized the mean MWF, relaxation, and DTI indices ROI values as a function of age in ROIs that showed a significant quadratic association with age. For each ROI, a piecewise linear model consisting of two segments was developed, one corresponding to maturation and the second to degeneration. The point of transition was defined as the maximum or minimum of the parameter under consideration. The absolute values of the slopes were compared statistically for each ROI20.
RESULTS & DISCUSSION
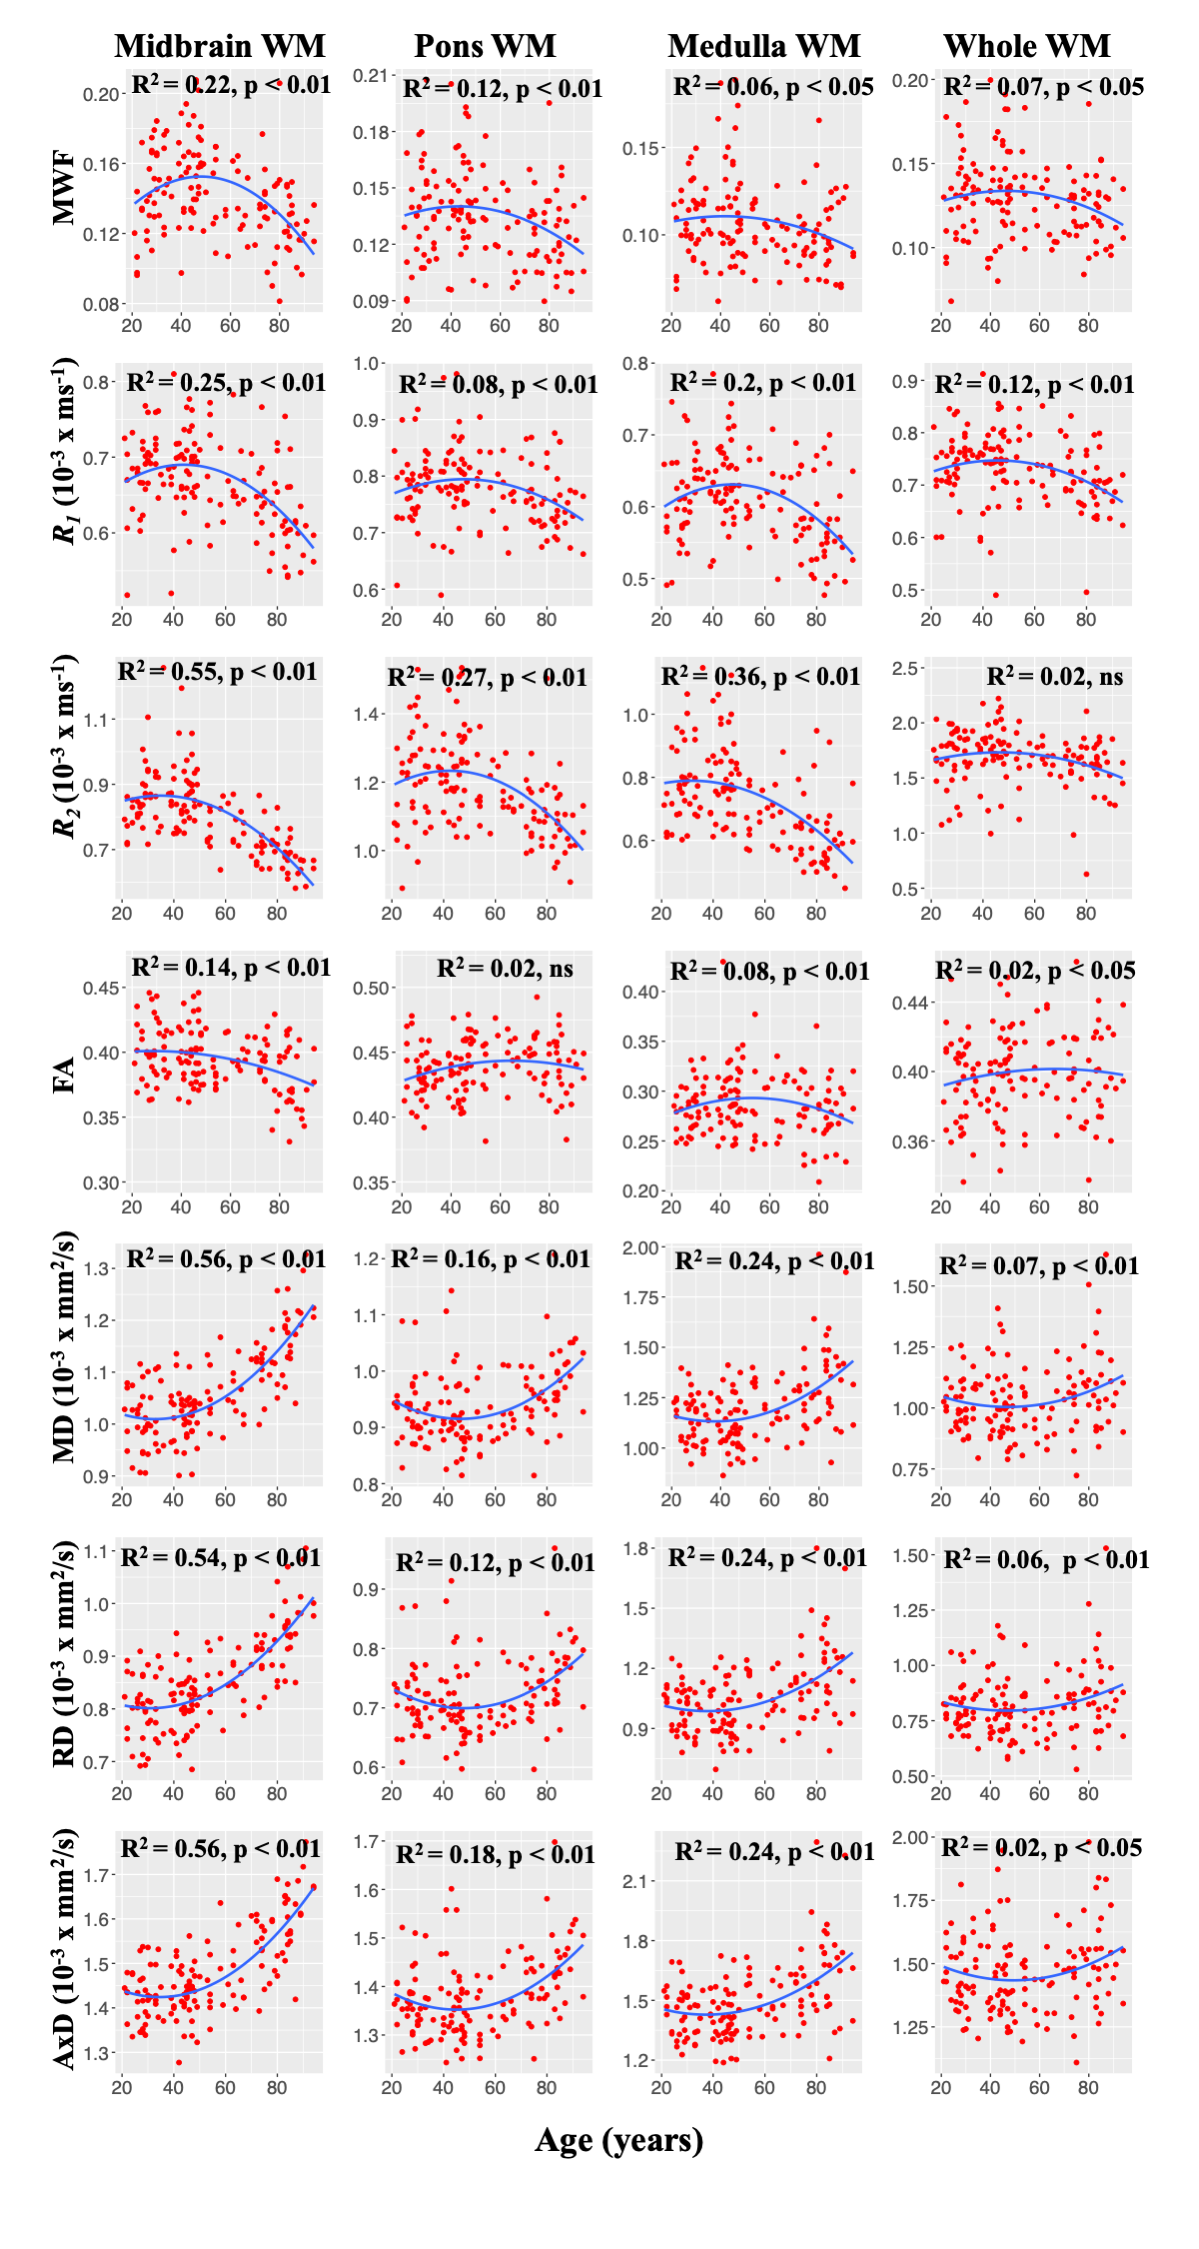
Figure 1 illustrates the representative plots of derived MWF, relaxation rates, and DTI indices from all subjects as a function of age. The best-fit curves all indicate a fundamental nonlinear association between MRI metrics and age, with expected regional variation. Our linear regression analysis showed numerous significant (p < 0.05) associations with age after FDR correction (Table 1). We also found statistically significant sex differences in myelin content in certain brain regions, with women exhibiting higher myelin content than men (Table 1). These observations are consistent with previous work on the cerebrum1,3,21,23 and brainstem2,4. Interestingly, these quadratic associations with age were most prominent in the midbrain division. We conjecture that these observed spatial variations reflect differences in tissue composition and function. In agreement, previous anatomical studies and tractography investigations have demonstrated that certain myelin tracts exhibit decreasing axonal and myelin densities as they extend from superior to inferior positions within the brainstem24-25.To the best of our knowledge, no prior MRI-based study has sought to examine age or sex-related differences with DTI indices in the brainstem. Here, we illustrate significant quadratic associations between MD, RD, and AxD and age in some regions examined (Figure 1 & Table 1). In contrast, FA maps demonstrated an overall decrease with age in most brainstem regions. These findings further support the notion that the brainstem matures until middle age and then rapidly degenerates in senescence.
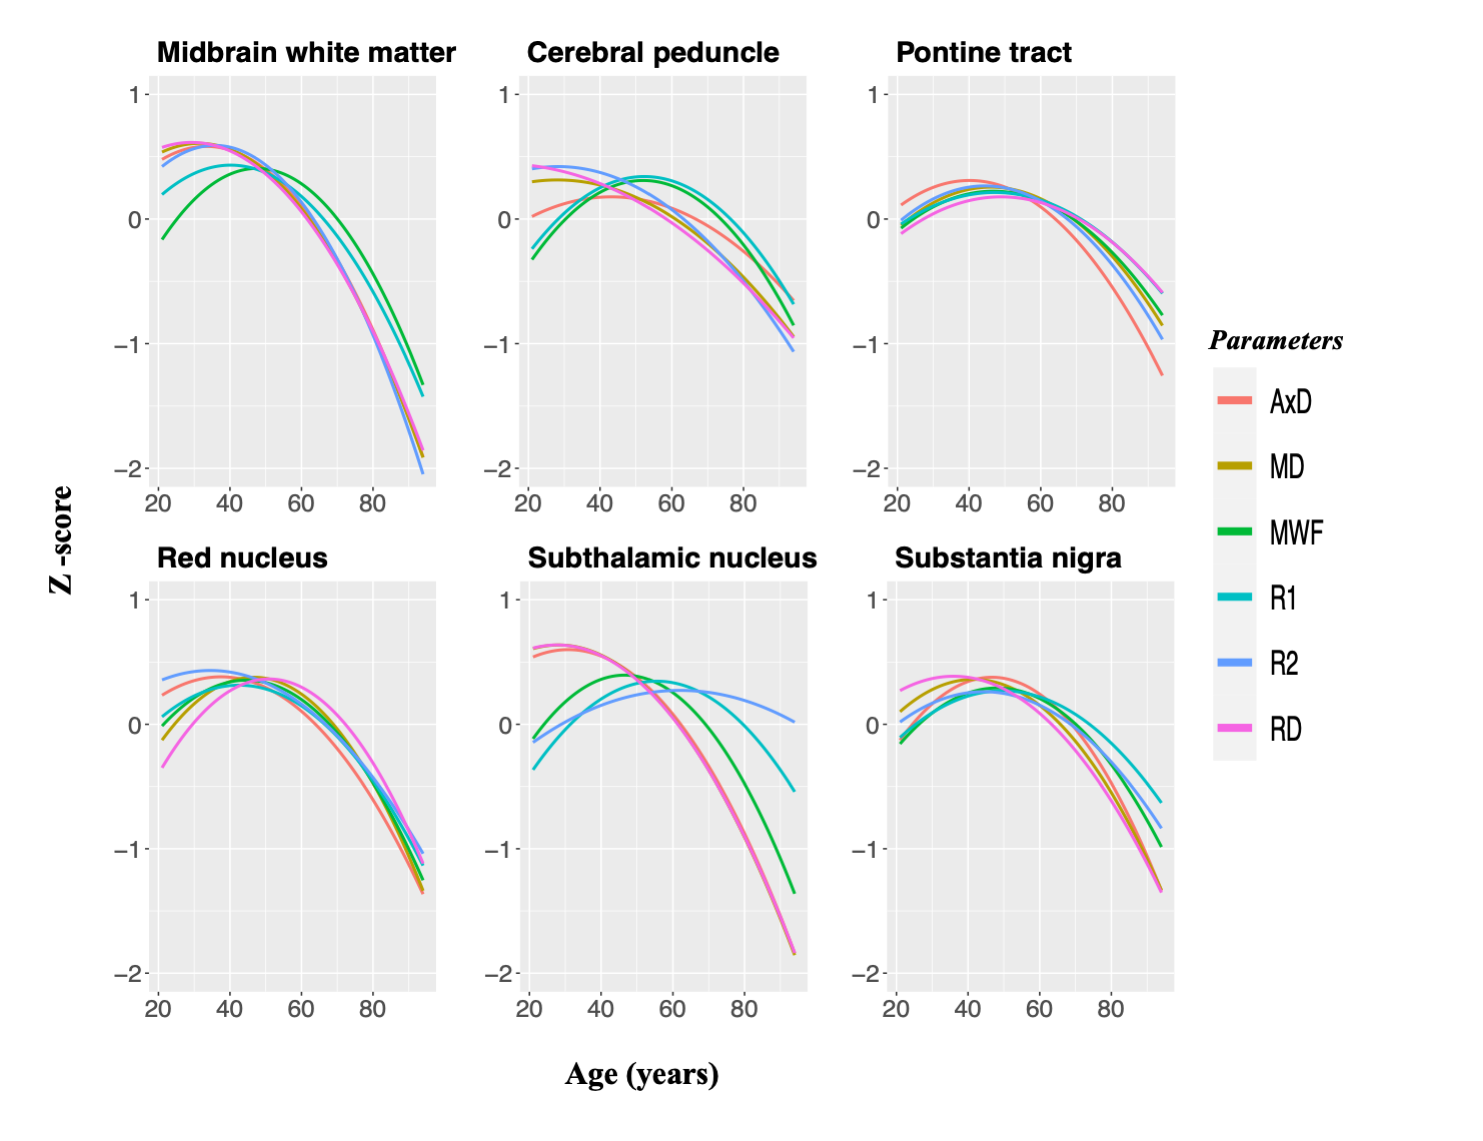
Finally, we tested the postulated gain-predicts-loss hypothesis of aging. MRI-based studies in the cerebrum8 have demonstrated support for this hypothesis, indicating that the rate at which a region matures will predict the rate at which the region degenerates. In agreement with work in the cerebrum, our novel results support the gain-predicts-loss hypothesis in the brainstem for myelination (Figure 2 & Table 2). Interestingly, MWF and R1, both well-established proxies of myelin content, followed a symmetric inverted U-shape trend in most regions evaluated while diffusivity indices and R2 had a more prominent degenerative phase that was significantly different from the maturation stage (Figure 2 & Table 2). Therefore, we postulate that the maturation and degeneration of myelin content follows a symmetric time-course with age while axons mature at a faster rate than they degenerate.
CONCLUSIONS
Using various quantitative MRI modalities, we showed nonlinear associations between myelin content and axonal density and age in most brainstem subdivisions as well as significant sexual dimorphism. Just as important, we demonstrated support for the gain-predicts-loss hypothesis, indicating that maturation and degeneration of myelin content occurs in a more temporally symmetric fashion than axonal maturation and degeneration.SUMMARY OF MAIN FINDINGS
Myelin content and axonal density follow an inverted U-shaped association with age in the brainstem, with myelin following a roughly symmetric time-course while axons appear to degenerate significantly more rapidly than they mature.Acknowledgements
We gratefully acknowledge the Intramural Research Program of the National Institute on Aging of the National Institutes of Health.References
1. Arshad M, Stanley JA, Raz N. Adult age differences in subcortical myelin content are consistent with protracted myelination and unrelated to diffusion tensor imaging indices. Neuroimage. 2016;143:26-39.
2. Bouhrara M, Cortina LE, Rejimon AC, Khattar N, Bergeron C, Bergeron J, et al. Quantitative age-dependent differences in human brainstem myelination assessed using high-resolution magnetic resonance mapping. Neuroimage. 2020;206:116307.
3. Bouhrara M, Rejimon AC, Cortina LE, Khattar N, Bergeron CM, Ferrucci L, et al. Adult brain aging investigated using BMC-mcDESPOT-based myelin water fraction imaging. Neurobiol Aging. 2020;85:131-9.
4. Lambert C, Chowdhury R, Fitzgerald TH, Fleming SM, Lutti A, Hutton C, et al. Characterizing aging in the human brainstem using quantitative multimodal MRI analysis. Front Hum Neurosci. 2013;7:462.
5. Bouhrara M, Reiter D, Bergeron C, Zukley L, Ferrucci L, Resnick S, et al. Evidence of demyelination in mild cognitive impairment and dementia using a direct and specific magnetic resonance imaging measure of myelin content. Alzheimer's & Dementia. 2018;14(8):998-1004.
6. MacKay AL, Laule C. Magnetic Resonance of Myelin Water: An in vivo Marker for Myelin. Brain Plasticity. 2016;2(1):71-91.
7. Dean DC, III, Sojkova J, Hurley S, Kecskemeti S, Okonkwo O, Bendlin BB, et al. Alterations of Myelin Content in Parkinson’s Disease: A Cross-Sectional Neuroimaging Study. PloS one. 2016;11(10):e0163774.
8. Flynn SW, Lang DJ, Mackay AL, Goghari V, Vavasour IM, Whittall KP, et al. Abnormalities of myelination in schizophrenia detected in vivo with MRI, and post-mortem with analysis of oligodendrocyte proteins. Molecular psychiatry. 2003;8(9):811-20.
9. Alvarez JC, Diaz C, Suarez C, Fernandez JA, Gonzalez del Rey C, Navarro A, et al. Aging and the human vestibular nuclei: morphometric analysis. Mech Ageing Dev. 2000;114(3):149-72.
10. Montplaisir J, Petit D, Lorrain D, Gauthier S, Nielsen T. Sleep in Alzheimer's disease: further considerations on the role of brainstem and forebrain cholinergic populations in sleep-wake mechanisms. Sleep. 1995;18(3):145-8.
11. Simic G, Stanic G, Mladinov M, Jovanov-Milosevic N, Kostovic I, Hof PR. Does Alzheimer's disease begin in the brainstem? Neuropathol Appl Neurobiol. 2009;35(6):532-54.
12. Rub U, Del Tredici K, Schultz C, Thal DR, Braak E, Braak H. The autonomic higher order processing nuclei of the lower brain stem are among the early targets of the Alzheimer's disease-related cytoskeletal pathology. Acta Neuropathol. 2001;101(6):555-64.
13. Lee JH, Ryan J, Andreescu C, Aizenstein H, Lim HK. Brainstem morphological changes in Alzheimer's disease. Neuroreport. 2015;26(7):411-5.
14. M. Bouhrara, R.G. Spencer. Incorporation of nonzero echo times in the SPGR and bSSFP singal models using in mcDESPOT. Magn. Reson. Med., 74 (5) (2015), pp. 1227-1235
15. Bouhrara M, Spencer RG. Improved determination of the myelin water fraction in human brain using magnetic resonance imaging through Bayesian analysis of mcDESPOT. NeuroImage. 2016;127:456-71.
16. Deoni SC, Rutt BK, Peters TM. Rapid combined T1 and T2 mapping using gradient recalled acquisition in the steady state. Magnetic resonance in medicine. 2003;49(3):515-26.
17. O.A. Williams, Y. An, L. Beason-Held, Y. Huo, L. Ferrucci, B.A. Landman, S.M. Resnick. Vascular burden and APOE ε4 are associated with white matter microstructural decline in cognitively normal older adults. Neuroimage, 188 (2019), pp. 572-583
18. Wakana S, Jiang H, Nagae-Poetscher LM, van Zijl PC, Mori S. Fiber tract-based atlas of human white matter anatomy. Radiology. 2004;230(1):77-87.
19. Kenichi Oishi, Andreia V. Faria, Peter C M van Zijl, Mori S. MRI Atlas of Human White Matter2010
20. Paternoster R, Brame R, Mazerolle P, Piquero A. USING THE CORRECT STATISTICAL TESTFOR THE EQUALITY OF REGRESSIONCOEFFICIENTS Criminology. 1998;36:859-66.
21. Yeatman JD, Wandell BA, Mezer AA. Lifespan maturation and degeneration of human brain white matter. Nat Commun. 2014;5:4932.
22. Yakovlev P. The myelogenetic cycles of regional maturation of the brain. Regional development of the brain in early life. 1967:3-70.
23. Peters A. The effects of normal aging on myelin and nerve fibers: a review. J Neurocytol. 2002;31(8-9):581-93.
24. Angeles Fernandez-Gil M, Palacios-Bote R, Leo-Barahona M, Mora-Encinas JP. Anatomy of the brainstem: a gaze into the stem of life. Semin Ultrasound CT MR. 2010;31(3):196-219.
25. Stieltjes B, Kaufmann WE, van Zijl PCM, Fredericksen K, Pearlson GD, Solaiyappan M, et al. Diffusion tensor imaging and axonal tracking in the human brainstem. Neuroimage. 2001;14(3):723-35.
26. Bouhrara M, Spencer RG. Rapid simultaneous high-resolution mapping of myelin water fraction and relaxation times in human brain using BMC-mcDESPOT. NeuroImage. 2017;147:800-11.
27. Qian W, Khattar N, Cortina LE, Spencer RG, Bouhrara M. Nonlinear associations of neurite density and myelin content with age revealed using multicomponent diffusion and relaxometry magnetic resonance imaging. NeuroImage. 2020;223:117369.
Figures