1900
Reduction of susceptibility artifact using echo-planar imaging with compressed SENSE (EPICS) in the upper abdomen1Department of Radiology, Chiba University Hospital, Chiba, Japan, 2Department of Diagnostic Radiology and Radiation Oncology, Graduate School of Medicine, Chiba University, Chiba, Japan, 3Eastern Chiba Medical Center, Togane, Japan, 4Philips Japan, Tokyo Japan, Tokyo, Japan
Synopsis
Intestinal gas in upper abdomen interferes with diffusion-weighted image. Echo-planar imaging with compressed SENSE (EPICS) can reduce the susceptibility artifacts by shortening the data sampling time. In this study, EPICS and conventional SENSE-DWI were compared visually and quantitatively. The visual score of EPICS were significantly higher than that of SENSE in the pancreatic head and body. The signal ratio between the pancreas and spinal cord was significantly higher in the pancreatic tail in SENSE. The ADC value of EPICS was significantly higher in the pancreatic head. EPICS is feasible for reducing gas-producing artifact in the upper abdomen.
INTRODUCTION
Diffusion-weighted imaging (DWI) is a helpful sequence for tumor detection and differential diagnosis in the upper abdomen1. In the upper abdomen, image degradation occurs due to magnetic susceptibility artifacts from gas in the intestinal tract. This artifact also causes distortions of upper abdominal organs such as the pancreas and stomach. Recently, a combination of parallel imaging and compressed sensing technique (Compressed SENSE, C-SENSE) was developed. The C-SENSE framework has been reported to reduce noise artifacts in single-shot DW-EPI images (EPI with C-SENSE: EPICS) (Fig. 1). We hypothesized that the compressed sense in upper abdominal imaging would reduce magnetic susceptibility artifacts by shortening the data sampling time. The purpose of this study is to evaluate the EPICS for reducing gas-producing artifact compared to conventional SENSE-DWI.METHODS
Thirty-eight patients (median age 68, age-range 41-87, 20men and 18women) were included in this study. Respiratory-triggered diffusion-weighted images (b=1000) with SENSE with factor 2 and EPICS with factor 3 using trousseau coil on 3-tesla MRI (Philips Ingenia CX) for evaluating the upper abdomen. The scanning parameters are summarized in Figure 1.Two radiologists visually evaluated magnetic susceptibility artifacts on pancreas and stomach using the 4-grade scoring with consensus. The pancreas was evaluated in three parts: the head, body, and tail. The stomach was evaluated in three parts: the fundus, body, and antrum. Signal ratio (SR) was calculated between the head, body, tail of the pancreas, and spinal cord as follows: SR = SI (pancreas) / SI (spinal cord). Apparent diffusion coefficient (ADC) was calculated pancreas head, body, and tail (Fig. 2). SR and ADC were tested with the Wilcoxon signed-rank test. P-values less than 0.05 were considered significant.RESULTS
The visual scores of EPICS were significantly higher than that of SENSE in the pancreatic head, body, and gastric antrum (P= 0.02341, <0.001, <0.001) (Fig. 3, 4). The SR of SENSE in the pancreatic tail was significantly higher than that of EPICS (P=0.0253). The ADC value of EPICS in the pancreatic head was significantly higher than that of SENSE in the pancreatic head (p=0.04947) (Fig. 5).DISCUSSION
In this study, the visual score of EPICS were significantly higher than that of SENSE in the head and body of pancreas and antrum of stomach. Since CS factor was 3 and SENSE factor was 2, the data sampling time was shorter for EPICS than for SENSE. The reduction of the data sampling time resulted in reduced the magnetic susceptibility artifacts. The SR of SENSE was significantly higher than EPICS in the pancreatic tail presumably due to reduced sampling data in CS factor 3. However, there was no significant difference in SR in other part of the pancreas, suggesting that the denoise effect of EPICS secured the signal in the pancreatic head and body. The ADC values were significantly higher in the pancreatic head. These results are comparable to previous reports2, 3 and show a tendency for ADC values in EPICS to be higher than in SENSE. The cause of higher ADC values of EPICS was most likely due to the reduction of noise by C-SENSE.CONCLUSION
EPICS was feasible to reduce the magnetic susceptibility artifact caused by intestinal gas. EPICS may be a more robust sequence to detect upper abdominal lesions than conventional SENSE-DWI.Acknowledgements
No acknowledgement found.References
1. Park MJ, Kim YK, et al. Preoperative detection of small pancreatic adenocarcinoma: value of adding diffusion-weighted imaging to conventional MR imaging for improving confidence level. Radiology; 2014; 273: 433–443
2. Masami Yoneyama, Kosuke Morita, et al. Noise Reduction in Prostate Single-Shot DW-EPI utilizing Compressed SENSE Framework. Proc. Intl. Soc. Mag. Reson. Med. 27 (2019) 1634
3. Kosuke Morita, Masami Yoneyama, et al. Pseudo-3D Diffusion-Weighted Imaging of the Brain using Echo Planar Imaging with Compressed SENSE (EPICS). Proc. Intl. Soc. Mag. Reson. Med. 27 (2019) 3355
Figures
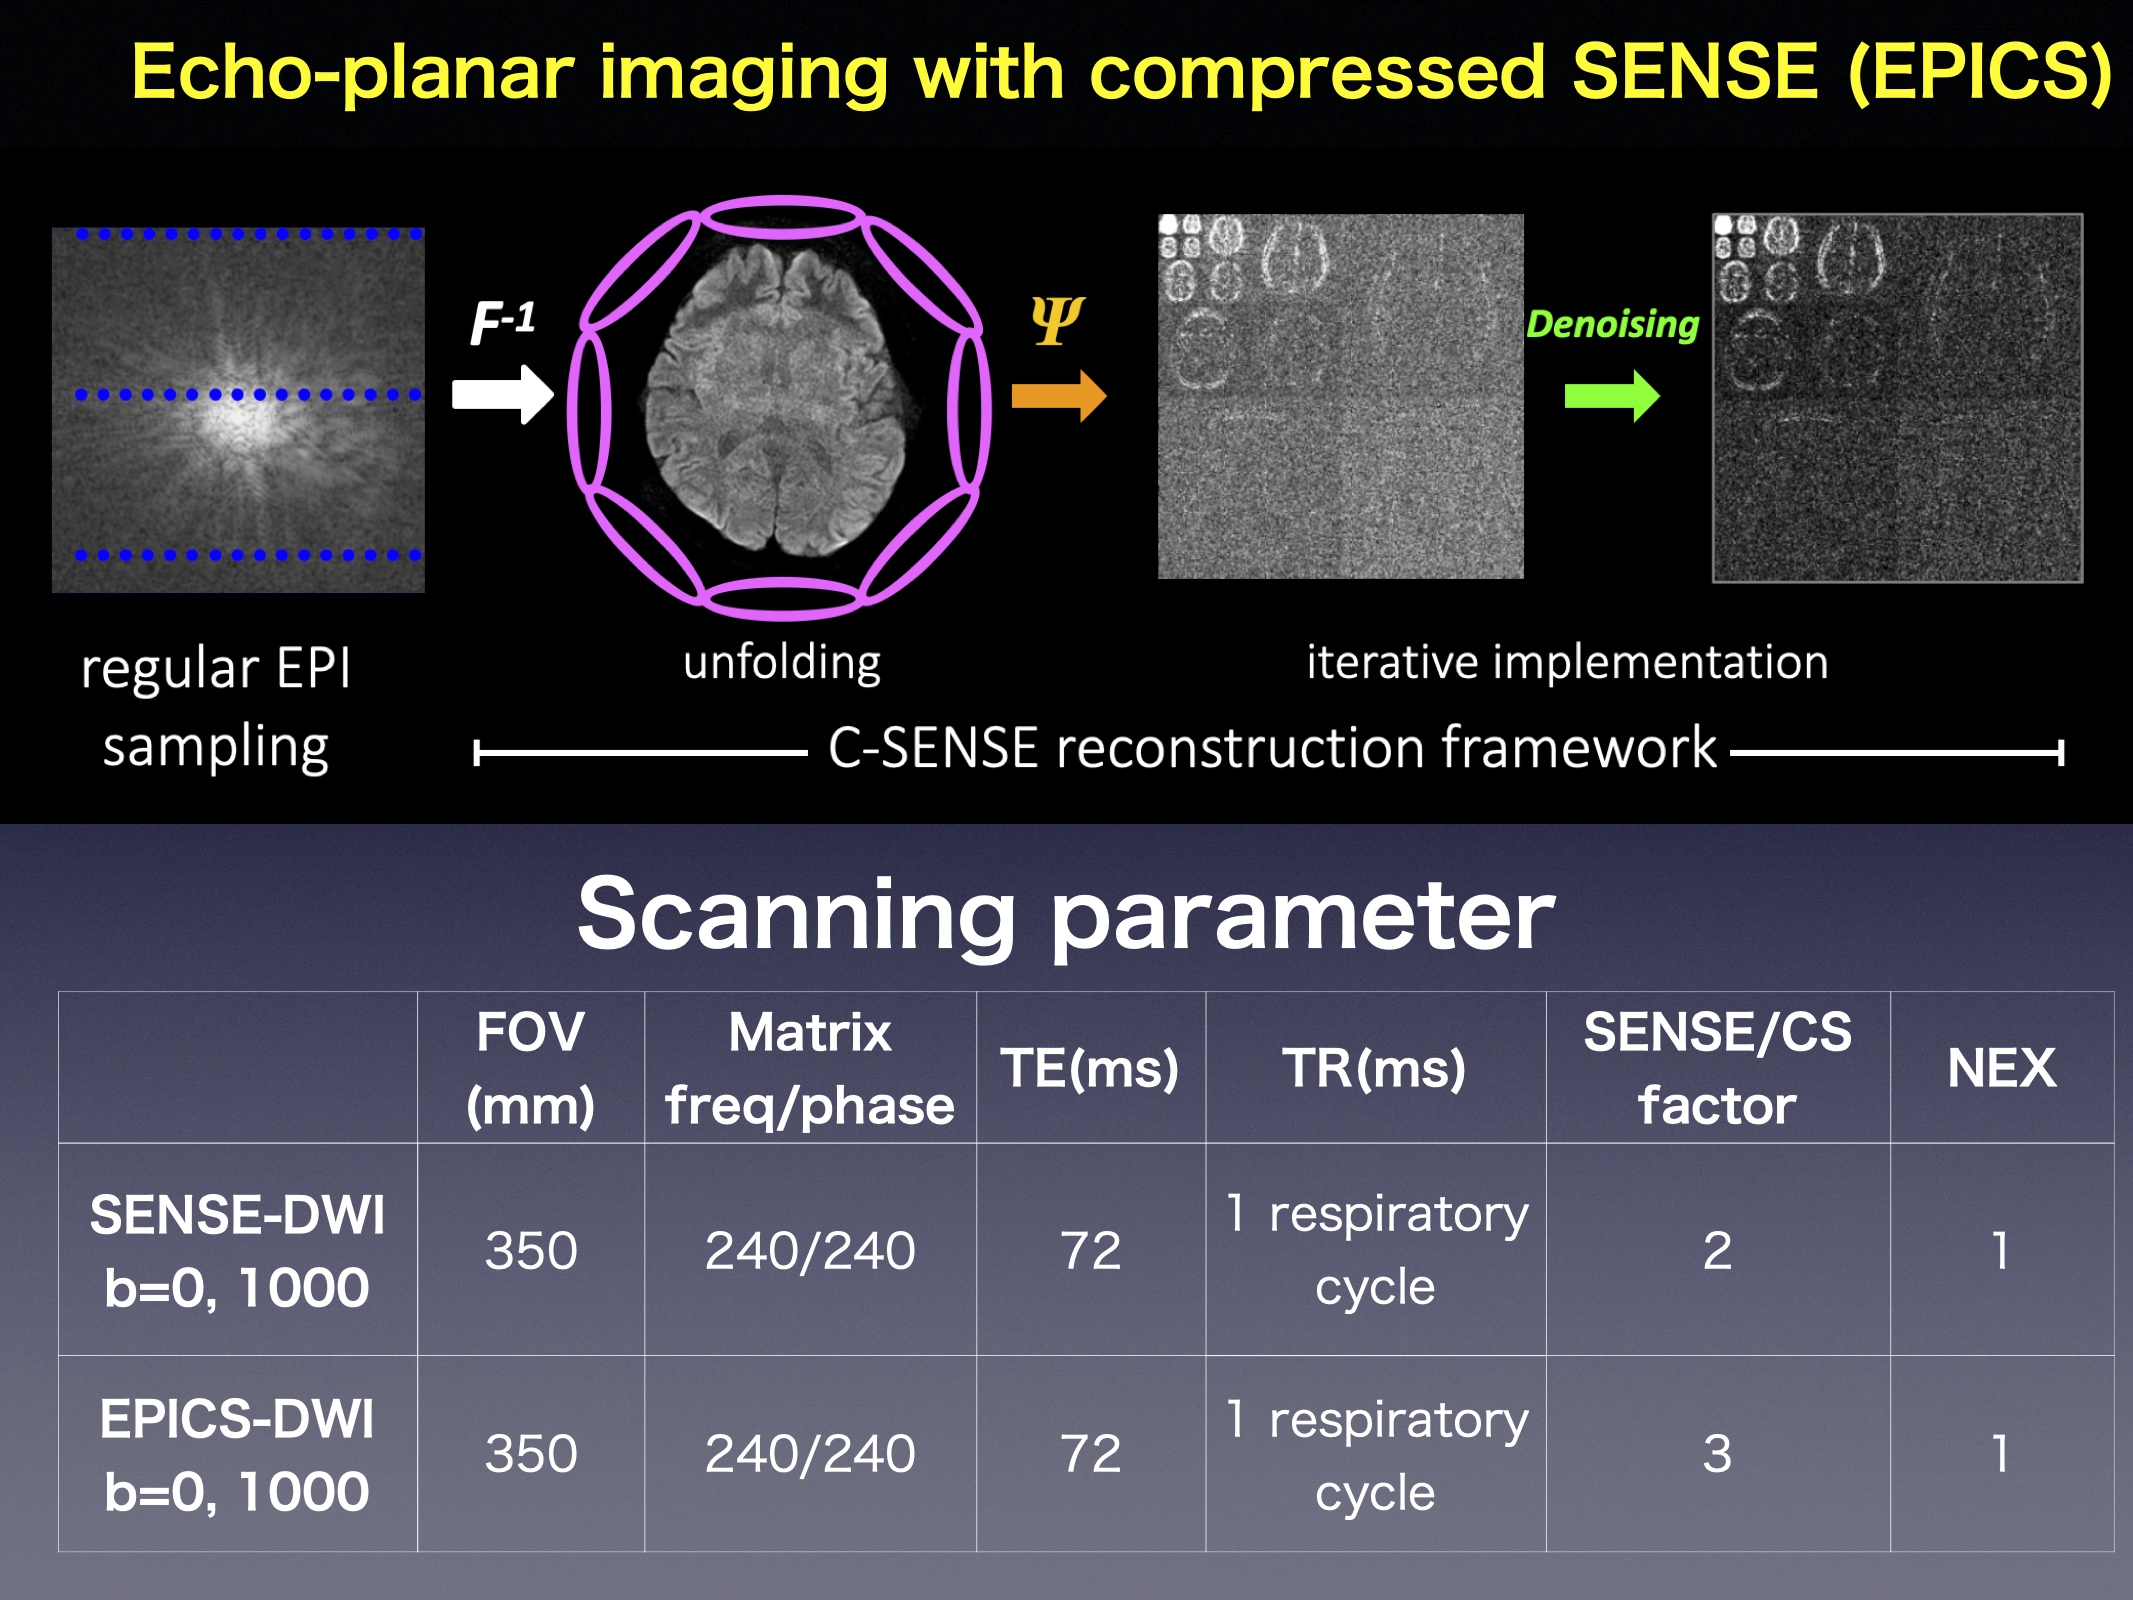
Figure 1. Framework of EPICS and scanning parameters
(Upper) Framework of echo-planar imaging with compressed SENSE (EPICS): a combination of parallel imaging and compressed sensing technique.
(Lower) Scanning parameter: CS factor was 3 and SENSE factor was 2. The other parameters are the same.
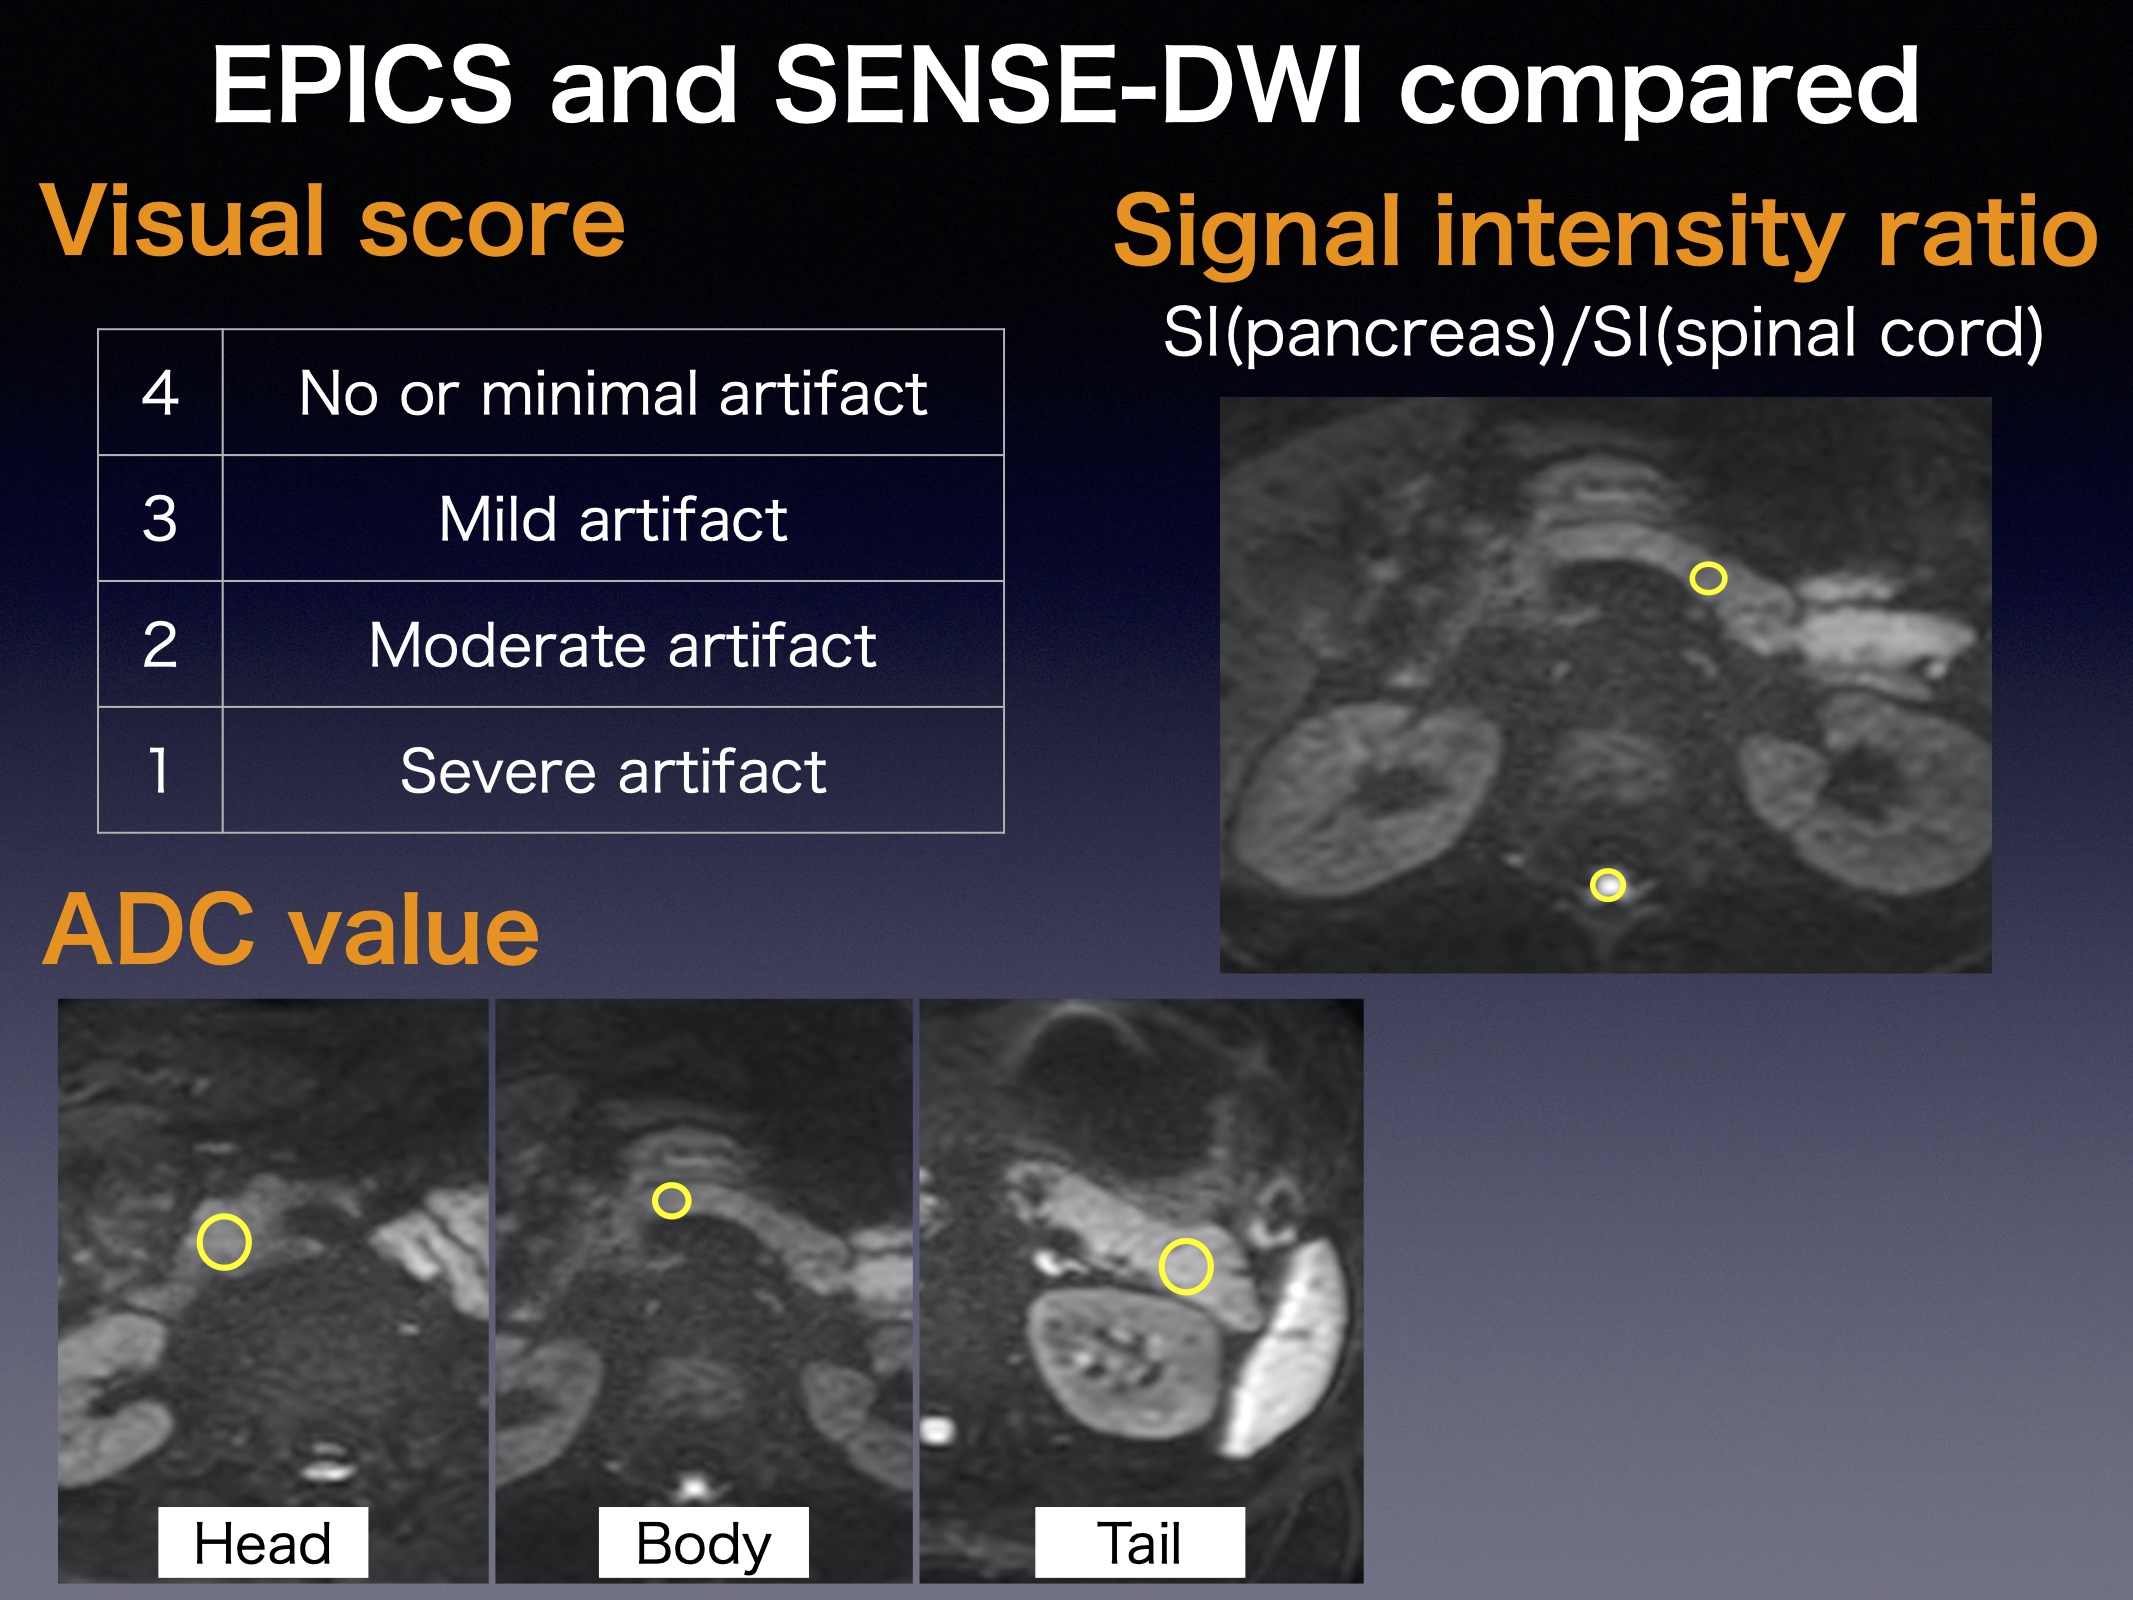
Figure 2. Methodology of this study
(Upper-left) Visual score: susceptibility artifact was visually evaluated by using4-graded-score.
(Upper-right) Signal intensity ratio: SI (pancreas)/SI (spinal cord) was evaluated. Pancreatic head, body, and tail were measured.
(Lower) ADC values were measured in the pancreatic head, body, and tail.
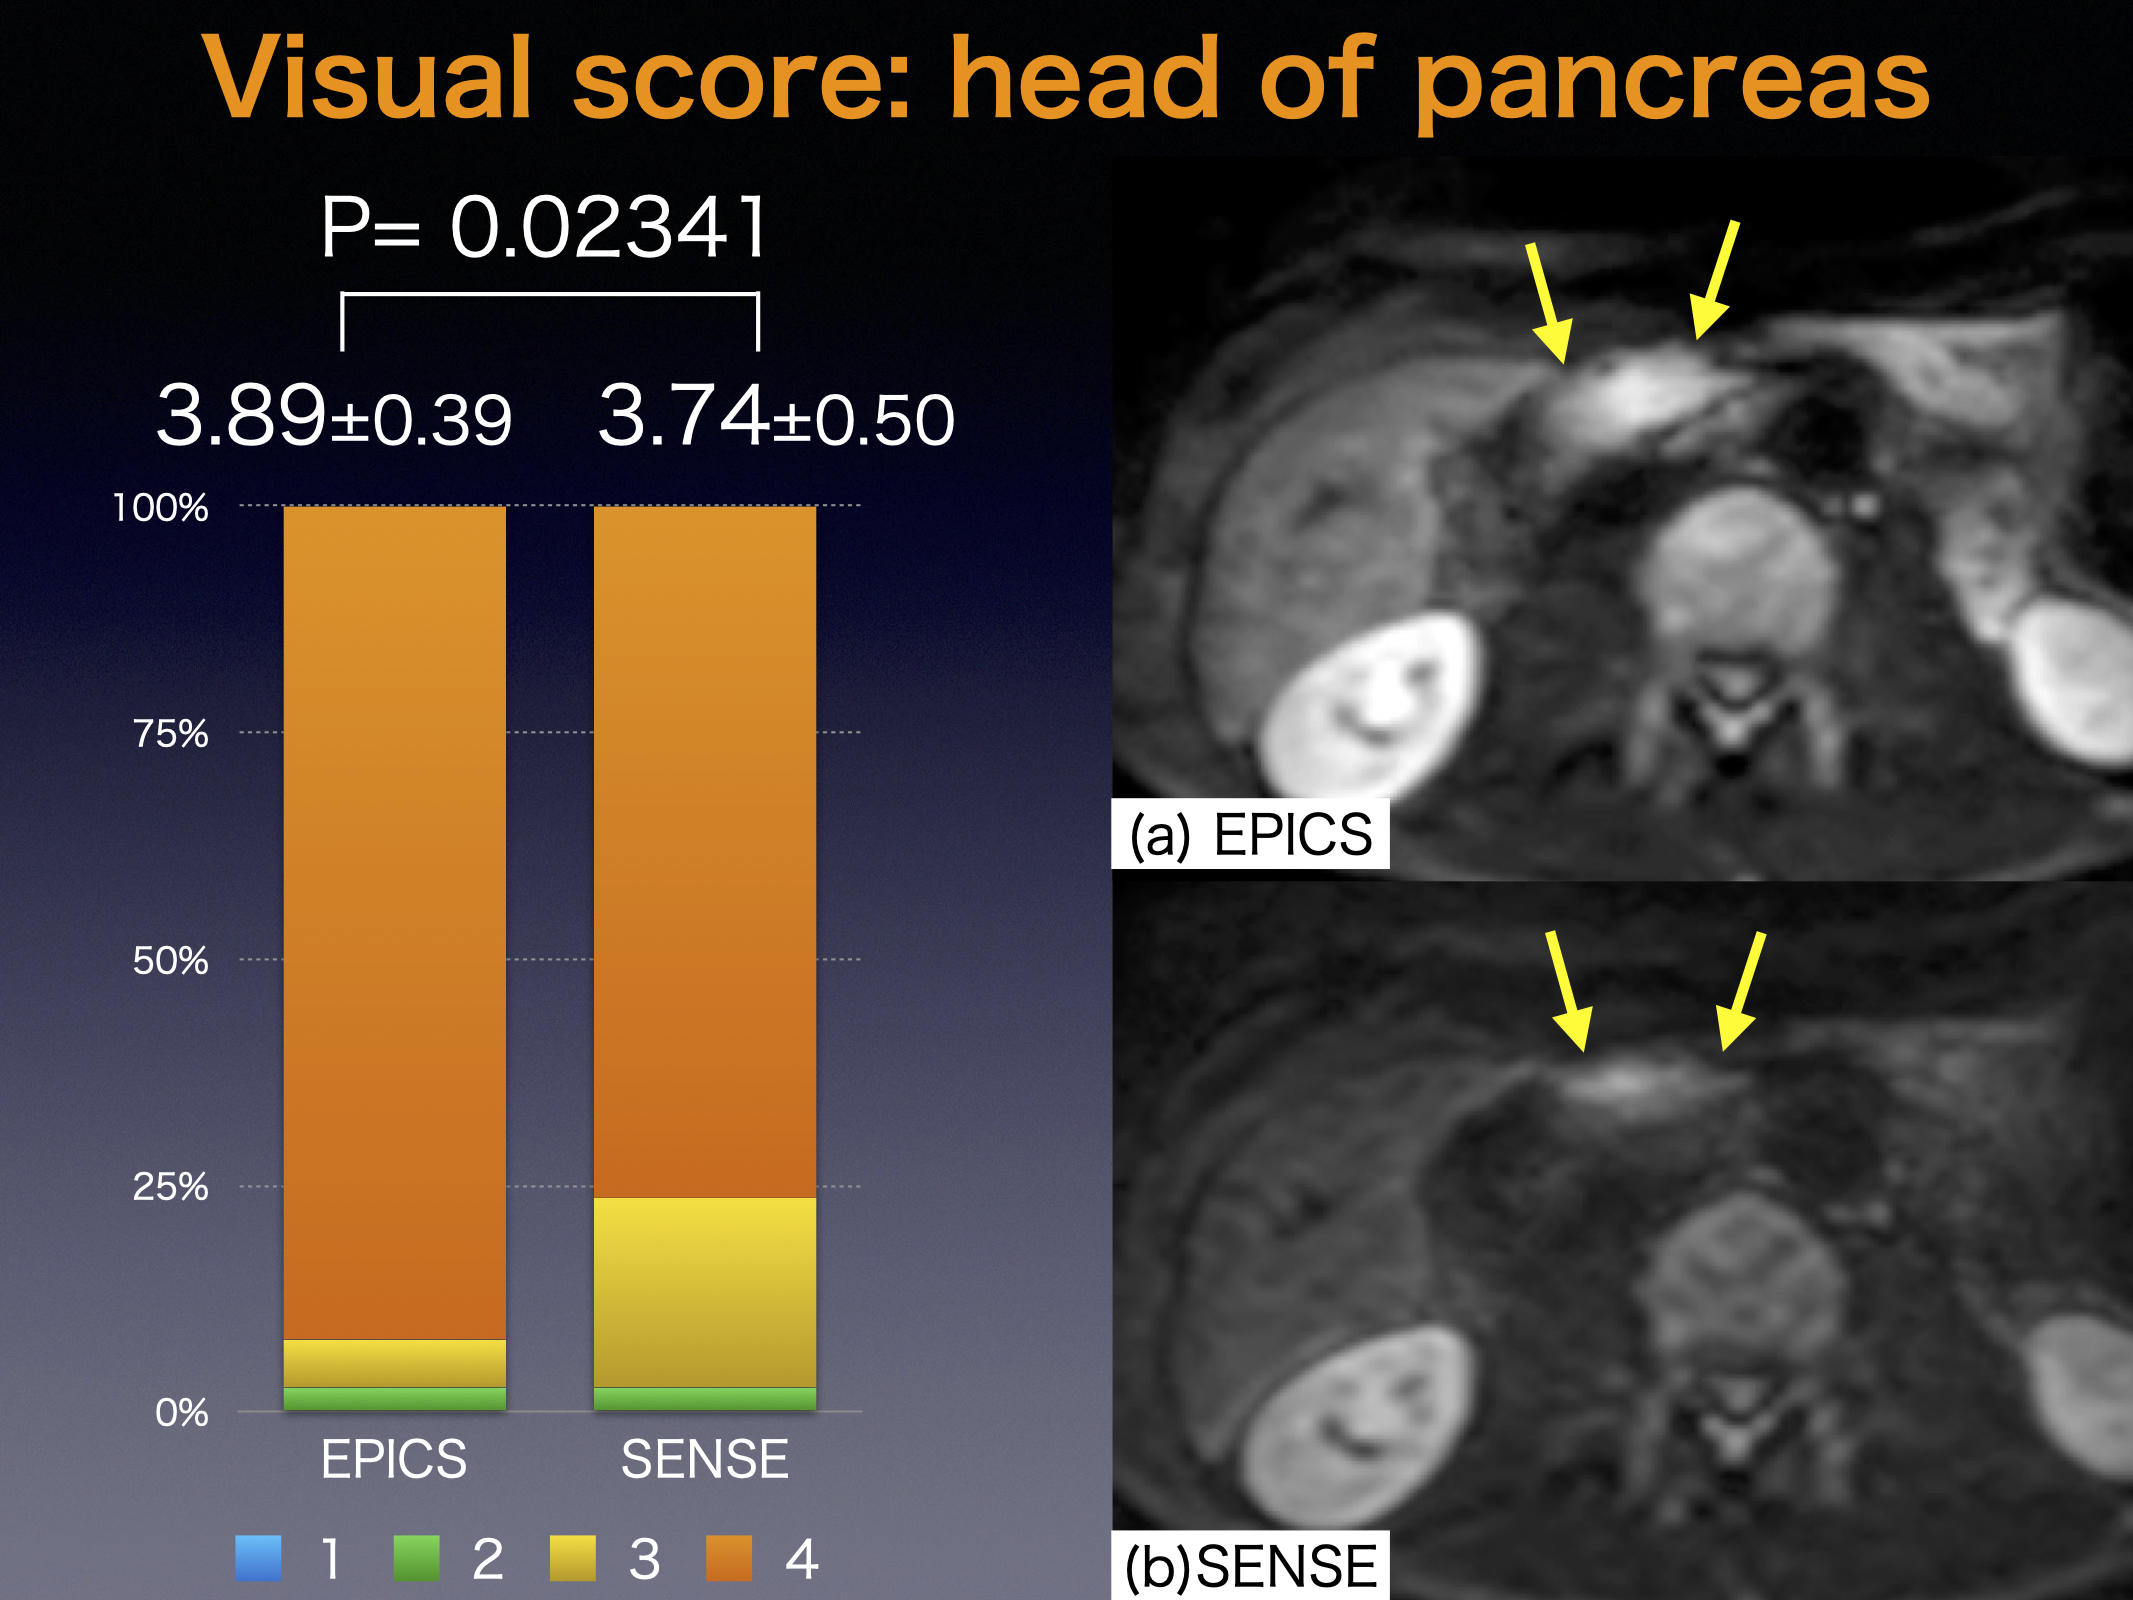
Figure 3. Visual score of the pancreatic head
The visual scores of EPICS were significantly higher than that of SENSE in the pancreatic head (P= 0.02341). Normal pancreas tissue in (a) EPICS and (b) SENSE. The border of the pancreas is clearly visible in EPICS, while it is obscured in SENSE due to susceptibility artifact.
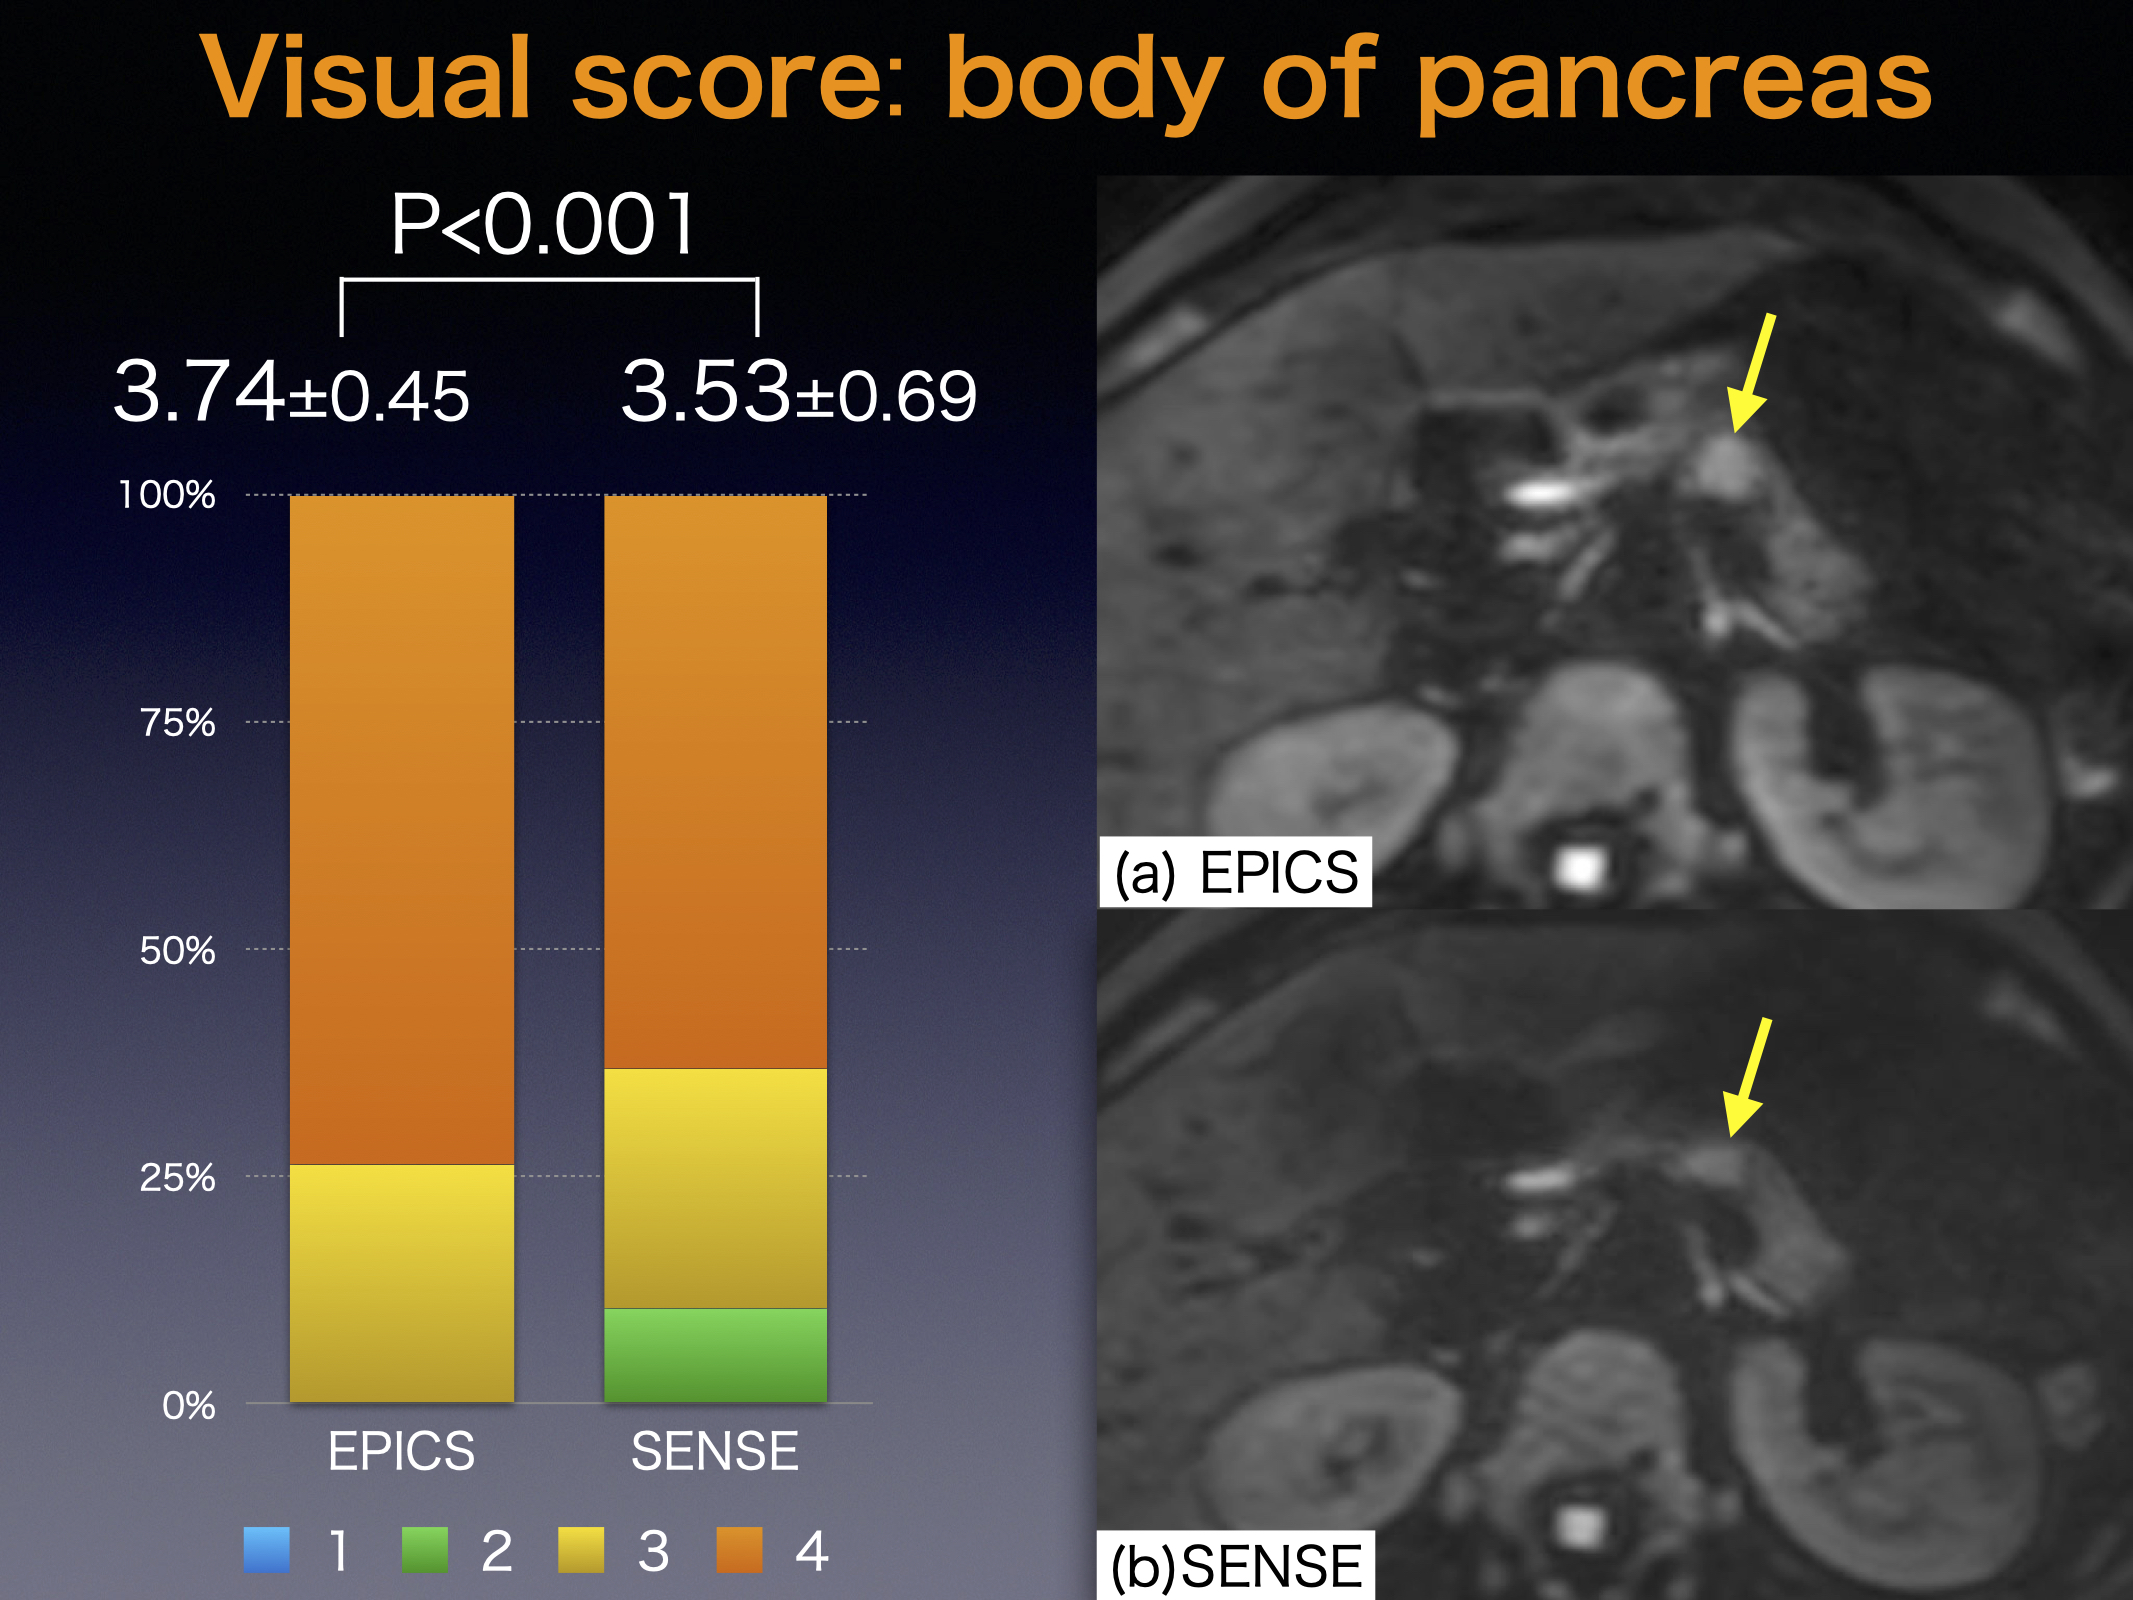
Figure 4. Visual score of the pancreatic body
The visual score of EPICS were significantly higher than that of SENSE in the pancreatic body (P<0.001).
A solid and pseudopapillary neoplasm of pancreas in (a) EPICS and (b) SENSE. Tumor borders are obscured, and the tumor size appears to be smaller in SENSE than in EPICS due to susceptibility artifact.
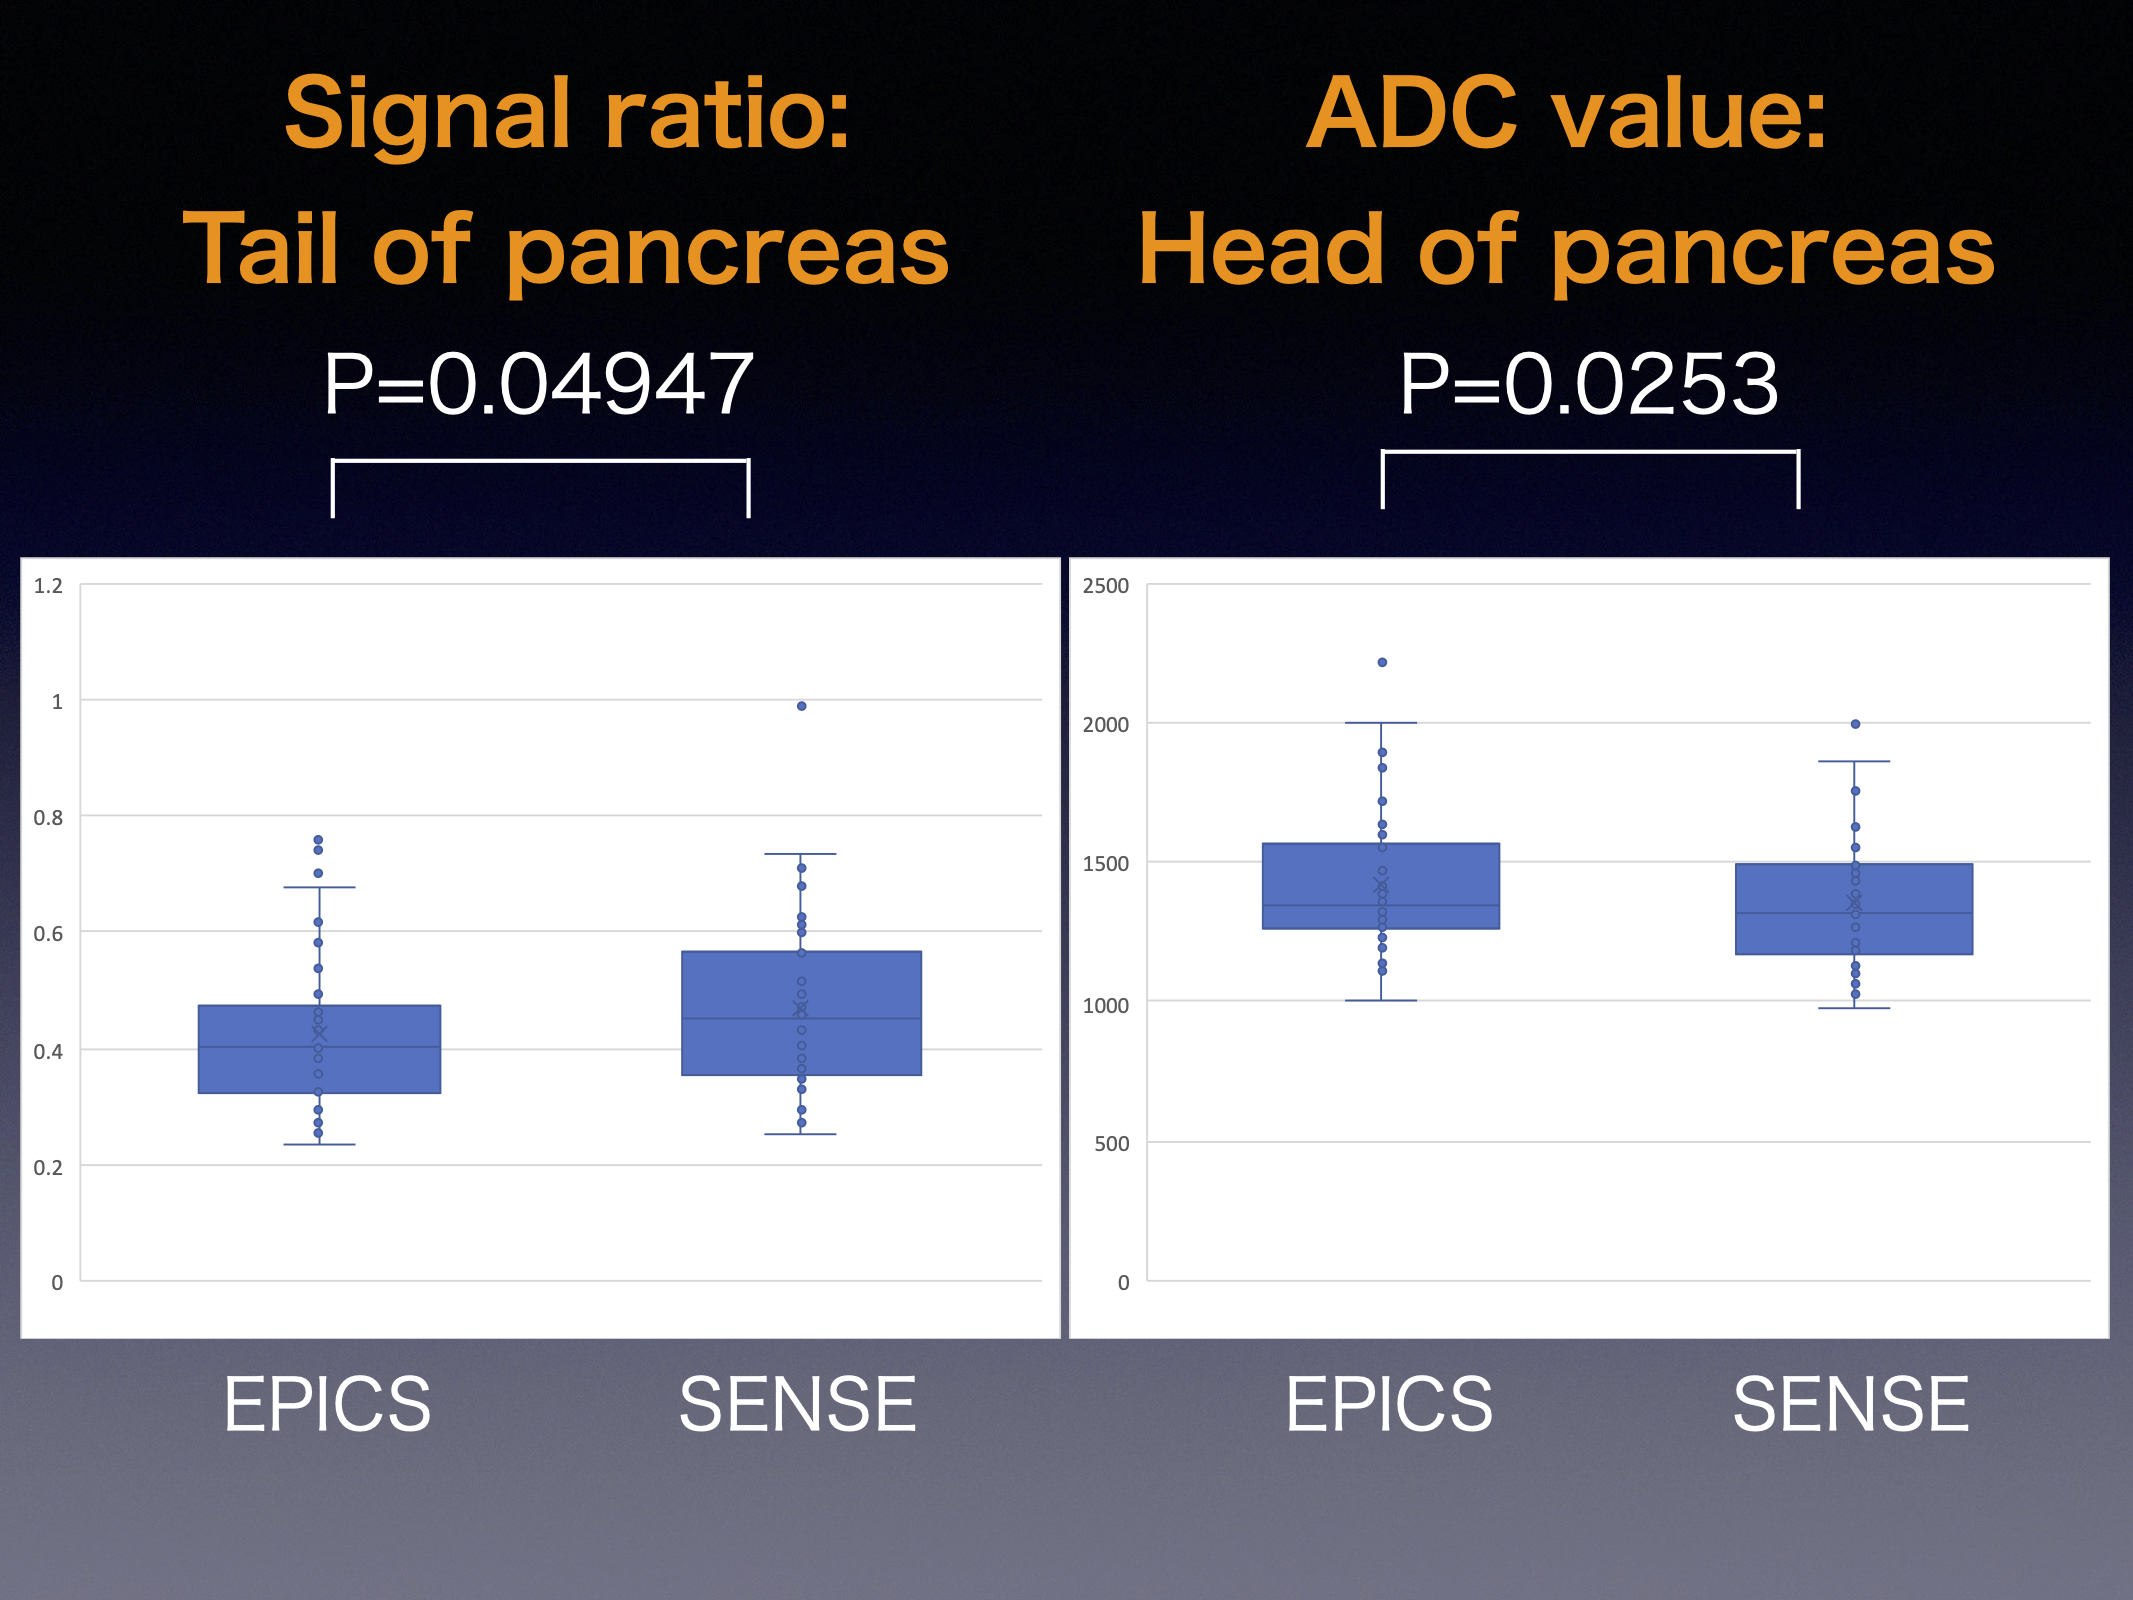
Figure 5. Signal ratio and ADC value comparison between EPICS and SENSE
The signal ratio (SR) of EPICS was significantly lower than that of SENSE in the pancreatic tail (p=0.04947). The SRs were no significant difference in the other regions.
The apparent diffusion coefficient (ADC) of the pancreatic head was significantly higher in EPICS than in SENSE (P=0.0253).