1897
Quantitative assessment of the pancreas in T2DM patients using DWI and T2 mapping
Zihao Xu1, Qinhe Zhang1, Chao Liang1, Shuangyi Li1, Yaru You1, Jiazheng Wang2, Liangjie Lin2, Ailian Liu1, and Qingwei Song1
1Department of Radiology, the First Affiliated Hospital of Dalian Medical University, Dalian Liaoning, China, 2Philips Healthcare, Beijing, China
1Department of Radiology, the First Affiliated Hospital of Dalian Medical University, Dalian Liaoning, China, 2Philips Healthcare, Beijing, China
Synopsis
This study measured the ADC and T2 values of the pancreas in T2DM patients and control subjects. Distribution of T2 values were uneven in different locations of pancreas in both T2DM patients and control subjects , and the T2 values in head and neck were higher than those of body and tail. While distribution of ADC values was even in both of the two groups (P>0.05). ADC values of pancreas in T2DM patients were lower than those of control subjects, and it is inversed for T2 values . It may indicate that pancreatic cells are more closely arranged with reduced cell gaps.
Introduction
This study measured the ADC and T2 values of the pancreas in T2DM patients and control subjects. Distribution of T2 values were uneven in different locations of pancreas in both T2DM patients and control subjects (P<0.05), and the T2 values in head and neck were higher than those of body and tail. While distribution of ADC values was even in both of the two groups (P>0.05). ADC values of pancreas in T2DM patients were lower than those of control subjects, and it is inversed for T2 values (all P<0.05). It may indicate that pancreatic cells are more closely arranged with reduced cell gaps, and water diffusion is limited in T2DM patients. And in T2DM patients, inflammatory cell recruitment induces parenchymal changes, including edema that may lengthen the T2 relaxation time.Materials and methods
Patients with 1) T2DM; 2) complete records of laboratory indicators and clinical parameters, including both clinical history and laboratory examination results; 3) DWI and/or T2 mapping sequences included in upper abdomen MRI examination were included. Patients with 1) evidence of alcohol consumption: ≥20 g alcohol/day for female and ≥30 g alcohol/day for male; 2) a history of pancreatic disease; 3) weight change by more than 5% (within one month); 4) low MRI images quality were excluded. A total of 20 patients (12 males and 8 females) with T2DM were included in the study. In addition, 44 control subjects (33 males and 11 females) were enrolled from inpatient department. All patients/subjects underwent MR scans on a 3.0 T MR scanner (Ingenia CX, Philips Healthcare). T2 mapping scan parameters included:FOV= 400 mm, TR/TE=100 /1.2 ms, slice thick 7.0/2.0 mm. DWI scan parameters included:FOV=450 mm, TR/TE=7700/74 ms, voxel size 3.7×6.3 mm2, slice thick 6.0/0 mm. On the ISP workstation (Philips Healthcare), 2D regions of interest (ROIs) were placed by two radiologists on the head, body and tail regions of pancreas in DWI and T2 mapping, respectively (Fig.1). Mean value of three ROIs was calculated as the value of the whole pancreas. ROIs area were approximately 25-100 mm2. All ROIs were placed within the interested tissue by avoiding blood vessels, pancreatic duct and abdominal adipose tissue as much as possible. The intraclass correlation coefficient (ICC) was used to check the consistency between the two observers. Quantitative metrics were compared among different pancreatic locations by Frideman test. The significance of the inter-group difference of continuous data between T2DM patients and control subjects were determined using two-sided t-tests or the nonparametric Mann-Whitney U-test for normally or non-normally distributed data. This study has been approved by the local IRB.Results
The patients' age, sex, body mass index (BMI), blood pressure and fasting blood glucose are listed in Table 1, and ICC results for evaluation of two-observer measurement consistency are presented in Table 2. Distribution of age, sex, BMI, SBP and DBP were similar in T2DM patients and control subjects (P=0.910, 0.178, 0.104 and 0.528). The distribution of T2 values in head and neck, body, and tail were uneven in both T2DM patients and control subjects (P<0.05), and the T2 values in head and neck were significantly higher than those of body and tail (P<0.05). But the distribution of ADC values was even among different locations of pancreas for both of the two group (P>0.05) (Table 3). ADC values of pancreas in T2DM patients were significantly lower than those of control subjects (P<0.05) (Table 4) (Fig 2). And, T2 values of pancreas in T2DM patients were significantly higher than those of control subjects (P<0.05) (Table 4) (Fig 3).Discussion
This study viewed that the distribution of T2 values in head and neck, body, and tail of pancreas was uneven, and the T2 values in head and neck were higher than those of body and tail. ADC values of pancreas in T2DM patients were lower than those of control subjects. And, T2 values of pancreas in T2DM patients were higher than those of control subjects. These results may reveal that pancreatic cells are more closely arranged with reduced cell gaps, and water diffusion is limited in pancreas of T2DM patients, which may be resulted from the infiltration of mononuclear cells into the pancreas [1]. In addition, inflammatory cell recruitment induces parenchymal changes, including edema that may lengthen the T2 relaxation time in pancreas of T2DM patients [2].Conclusion
This study measured the ADC and T2 values of the pancreas in T2DM patients and control subjects. The distribution of T2 values in head and neck, body, and tail of pancreas was uneven, and the T2 values in head and neck were higher than those of body and tail. ADC values of pancreas in T2DM patients were lower than those of control subjects. And, T2 values of pancreas in T2DM patients were higher than those of control subjects.Acknowledgements
No acknowledgement foundReferences
1.Lavdas I, Rockall AG, Castelli F, et al. Apparent Diffusion Coefficient of Normal Abdominal Organs and Bone Marrow From Whole-Body DWI at 1.5 T: The Effect of Sex and Age. AJR Am J Roentgenol. 2015;205(2):242-250. 2.Vietti Violi N, Hilbert T, Bastiaansen JAM, et al. Patient respiratory-triggered quantitative T2 mapping in the pancreas. J Magn Reson Imaging. 2019;50(2):410-416.Figures
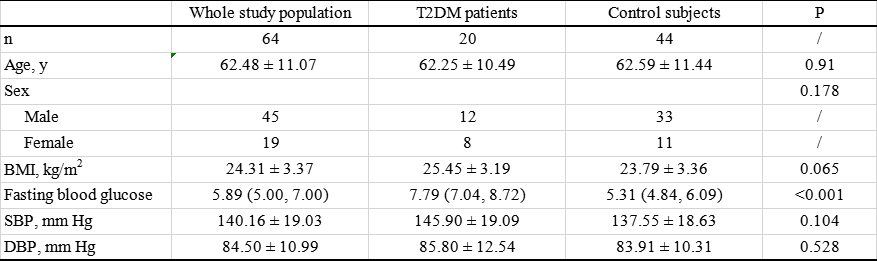
Table 1. General Characteristics of the Study Population
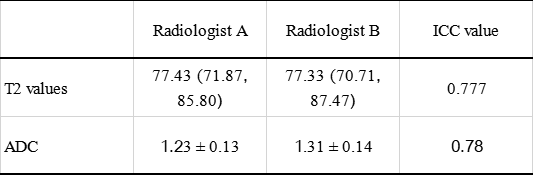
Table 2. Two-observer measurement consistency
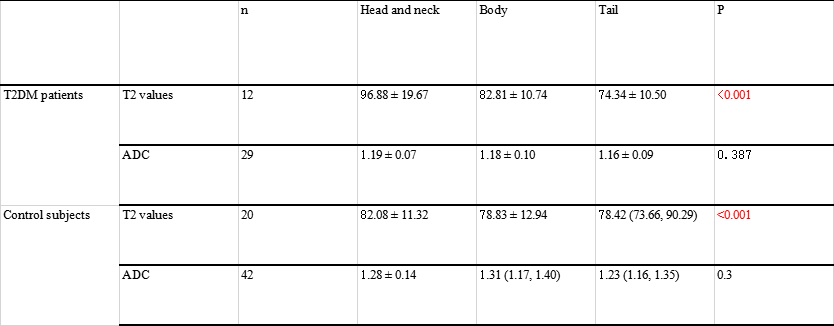
Table 3 Difference of T2 values in different pancreatic locations
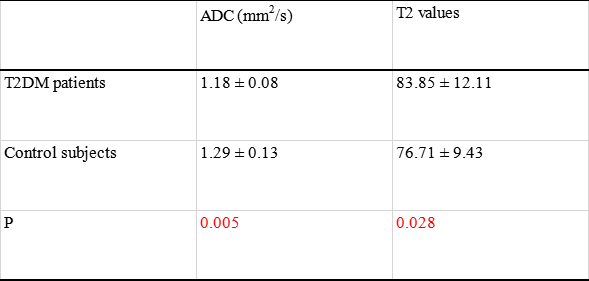
Table 4 Difference of ADC and T2 values between two group
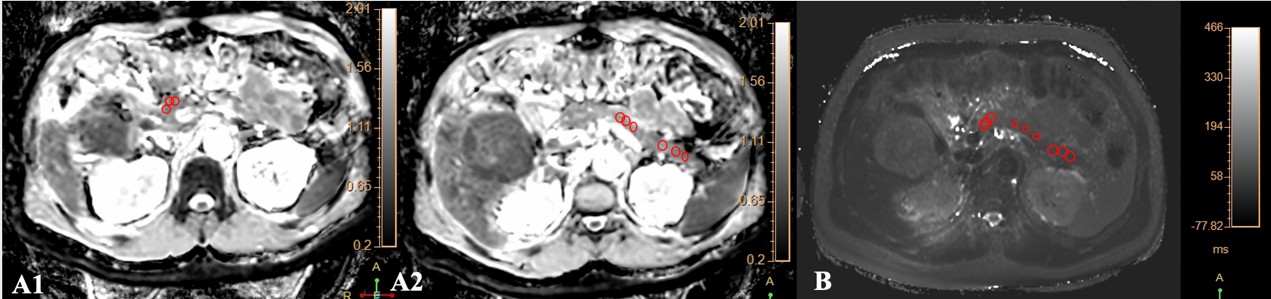
Fig 1. 2D region of interest (ROI) were placed on the head and neck, body and tail regions of pancreas in ADC (A1 and A2) and T2 (B) maps. ROI areas were approximately 25-100 mm2. All ROIs were placed within the interested tissue by avoiding blood vessels, pancreatic duct and abdominal adipose tissue as much as possible.
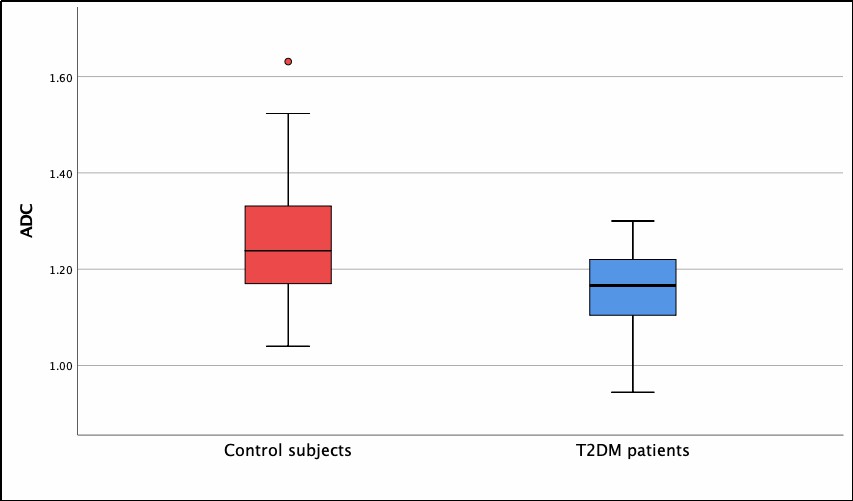
Fig 2. ADC values (mm2/s) in T2DM patients were significantly lower compared to control subjects (P<0.001).
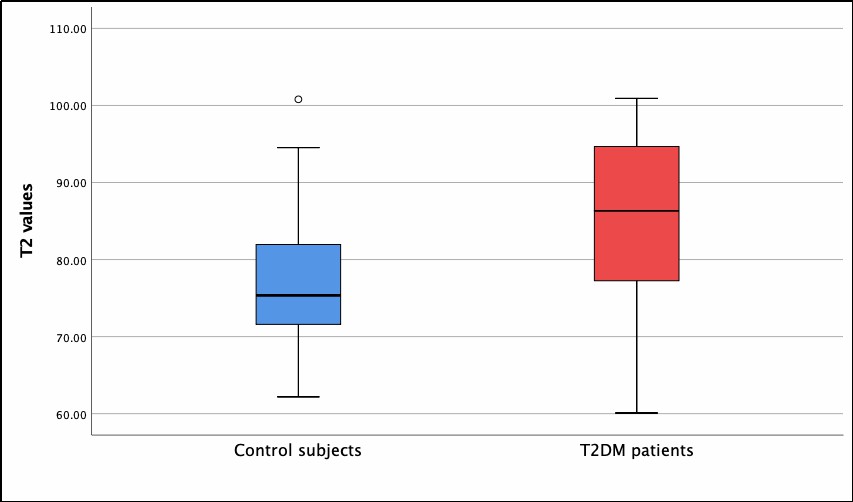
Fig 3. T2 values (ms) in T2DM patients were significantly higher compared to control subjects (P<0.001).